Part IV: Revenue
Table 11 provides estimates of tax, non-tax and total revenue from 1999-2000 to 2002-03.1 Relative to the 1999-2000 Budget, the MYEFO estimate of total revenue is slightly lower in 1999-2000 but higher in the following three years.
Table 11: Estimates of Commonwealth General Government Revenue(a)
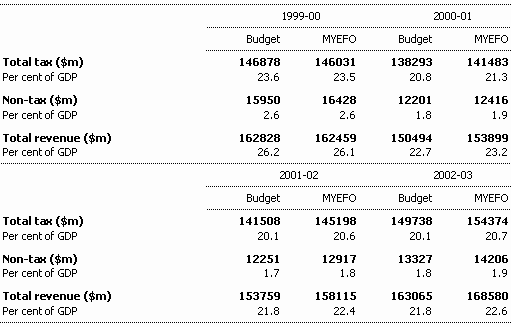
(a) All revenue data in this table are produced on a AAS31 basis. All estimates expressed as a proportion of GDP use current MYEFO GDP estimates. There has been a reclassification of revenue since Budget of around $1 billion from tax to non-tax components. Estimates are net of the diesel fuel rebate scheme.
The changes to the 1999-2000 Budget estimates (shown in Table 12) incorporate: policy decisions taken since the Budget; a revised assessment of the economic outlook; and actual revenue outcomes up to mid-November 1999.
Table 12: Reconciliation of General Government Revenue Estimates(a)
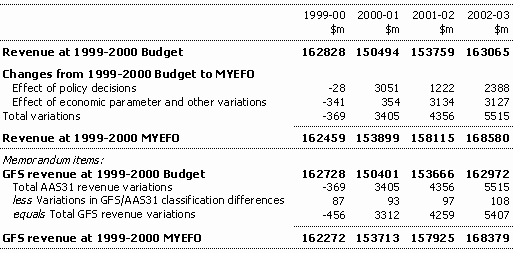
(a) All data in this table are produced on a AAS31 basis unless otherwise specified.
Policy decisions subsequent to the 1999-2000 Budget are estimated to reduce revenue marginally in 1999-2000 but increase it significantly in the following years. All revenue policy decisions are listed in Table 13 (and detailed in Appendix A).
The main increase in revenue derives from changes to A New Tax System, following agreement with the Australian Democrats to secure legislation in the Senate. In particular, reductions in income tax cuts for income earners over $50,000 and changes to the Diesel Fuel Rebate Scheme will together add around $1½ billion to revenue from 2000-01, which partly offsets the expenditure increases from that package. (See Box 2, Part I.)
The other major package of tax reform measures is The New Business Tax System. Over the period as a whole, these measures are estimated to be broadly revenue-neutral, with gains to revenue in 2000-01 and 2002-03 slightly more than offsetting losses in the other two years. (See Box 2, Part I.)
The temporary Defence — East Timor levy, to partially offset the costs of Australia’s involvement in East Timor, adds $900 million to revenue in 2000-01. (See Box 1, Part I.)
Table 13: Revenue Measures since the 1999-2000 Budget(a)(b)
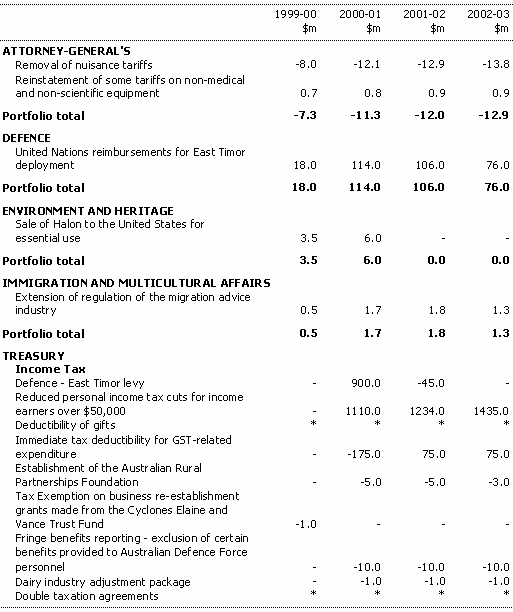
Table 13: Revenue Measures since the 1999-2000 Budget(a)(b) continued
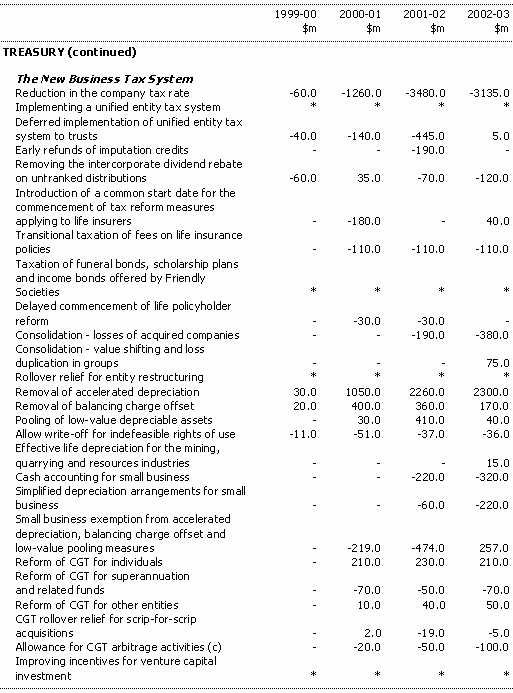
Table 13: Revenue Measures since the 1999-2000 Budget(a)(b) continued
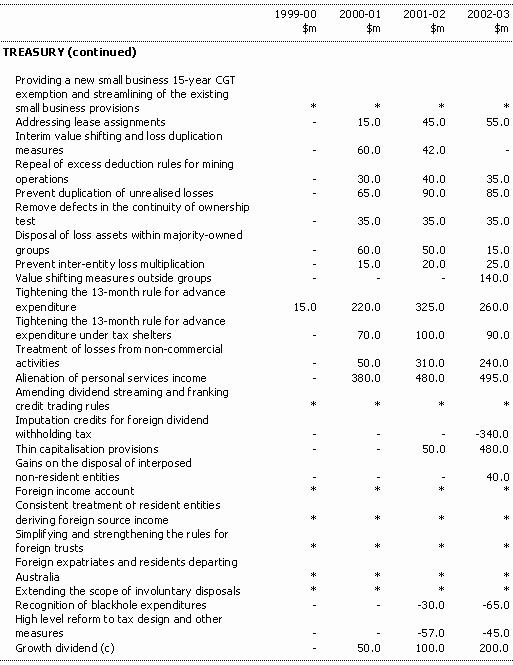
Table 13: Revenue Measures since the 1999-2000 Budget(a)(b) continued
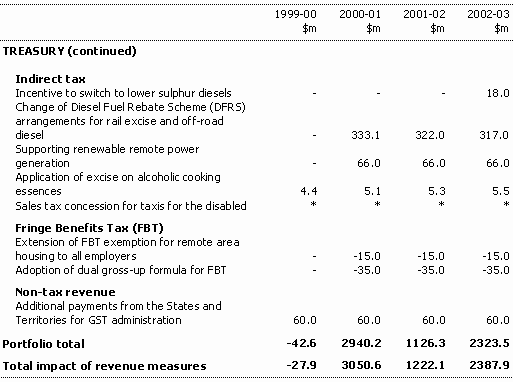
* The nature of this measure is such
that a reliable estimate cannot be provided.
(a) Revenue is on a AAS31 basis.
(b) Minus sign before an estimate indicates a reduction in revenue; no sign before an
estimate indicates a gain to revenue.
(c) The allowance for CGT arbitrage activities and growth dividend are not
strictly policy decisions, but have been included in the summary table in order to show
the overall fiscal impact of business taxation reform.
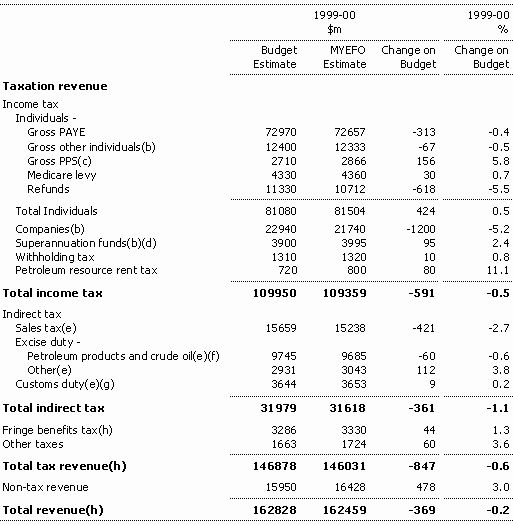
As noted, policy decisions since Budget will have little impact on the revenue outlook for 1999-2000. Further, as is evident in Table 12, there is also very little variation in aggregate revenue expected in 1999-2000 from changes in economic parameters and other variations, consistent with the unchanged outlook for nominal GDP growth since Budget. However, this small variation in aggregate revenue relative to Budget comprises some more significant changes to individual revenue categories, as detailed in Table 14.
Table 14: General Government Revenue Estimates(a)
(a) All data in this table are produced on a
AAS31 basis.
(b) Includes tax on realised capital gains.
(c) PPS denotes Prescribed Payments System which includes Reportable Payments System
payments by individuals (around $2 million in 1999-2000).
(d) Includes superannuation contributions surcharge.
(e) Excludes revenues raised on an agency basis for the States and Territories (for
example, Revenue Replacement Payments).
(f) Estimates for Petroleum Products Excise are net of the diesel fuel rebate scheme
(around $1.6 billion in 1999-2000).
(g) Customs duty collections include customs duty imposed on imported petroleum products,
tobacco, beer and spirits, which is akin to excise duty on these items (around
$900 million in 1999-2000).
(h) Excludes Fringe benefits tax collected from Commonwealth Government agencies (around
$300 million in 1999-2000).
Table 14 shows that, for 1999-2000, net downward revisions to both income tax and indirect tax are largely offset by upward revisions to fringe benefits tax, other taxes and non-tax revenue.
Downward revisions have been made to the following revenue items:
- Individuals income tax (both PAYE and other), reflecting a reduction in the estimated provision for outstanding revenue considered unlikely to be collected, but with little variation in the outlook for household income growth;
- Companies tax, reflecting: the base effect of a lower than expected outcome for 1998-99; slower than expected growth in taxable income in the 1998-99 income year; downward variations of payments by some large taxpayers (which reflect the individual circumstances of those companies rather than general macroeconomic conditions); and greater than expected deductibility of Y2K expenditure (although this revenue loss is likely to be largely recouped in later years);
- Sales tax, largely as a result of recent court decisions and a reassessment of spending on certain components of the sales tax base (particularly in the latter half of 1999-2000); and
- Petroleum excise, largely due to lower than expected collections to date.
Upward revisions to revenue result from the following movements:
- Gross Prescribed Payments System, largely due to stronger dwelling sector activity and the strength of collections in the early part of the financial year;
- Individuals Refunds, reflecting substantially lower than expected outcomes in the year to date, a period when the greater part of refunds are normally processed;
- Petroleum Resource Rent tax, largely due to recent strength in oil prices;
- Other excise, largely due to higher tobacco excise collections;
- Other taxes, partly due to slightly higher than anticipated revenue from some agricultural production taxes; and
- Non-tax revenue, primarily due to larger dividends from Telstra and the Reserve Bank of Australia (RBA) and increased interest revenue from investments and swaps as a result of an increase in market interest rates and an upward revision to the swaps program.
Preliminary forecasts for 2000-01 indicate that, in addition to a substantial impact from policy decisions, the aggregate effect of economic parameter and other variations is small, but positive. Once allowance is made for higher prices resulting from changes to indirect taxation, the preliminary forecast for nominal GDP growth in 2000-01 is very similar to Budget projections. Of itself, the economic outlook would thus suggest little need for change to the budget-time estimates.
However, there are some other variations which will have important, though largely offsetting, impacts. Tending to boost revenue in 2000-01 (and in subsequent years) is the reclassification since Budget of a portion of the diesel fuel offset to excise as a grant (increasing expenses by an equivalent amount). However, company taxable income growth is likely to remain lower than broader measures of corporate performance and overall macroeconomic indicators would suggest, and a continuing high level of deductible expenditure on information technology upgrades (associated with Y2K and the GST) is expected.
Forward projections for revenue in 2001-02 and 2002-03 are higher than presented at Budget due to a combination of the waning of these constraining influences, the ongoing substantial impact of the diesel fuel offset and policy decisions since the Budget. Some further detail on the major categories of revenue is shown in Table 15.
Revenue estimates are highly dependent on general economic conditions and the effects of tax policy measures. In particular, taxpayers may respond to new measures in ways which were not fully anticipated at the time the relevant revenue estimates were prepared. Appendix B provides information on the sensitivity of the revenue estimates to changes in economic parameters while Appendix C contains a description of the sources of risks to taxation revenue.
Table 15: Forward Estimates of General Government Revenue(a)
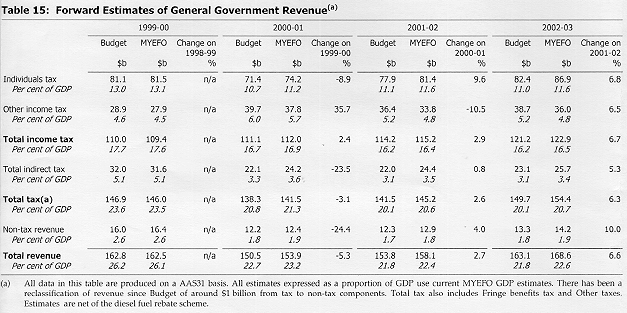
Click to enlarge Table 15
(a) All data in this table are produced on a AAS31 basis. All estimates expressed as a proportion of GDP use current MYEFO GDP estimates. There has been a reclassification of revenue since Budget of around $1 billion from tax to non-tax components. Total tax also includes Fringe benefits tax and Other taxes. Estimates are net of the diesel fuel rebate scheme.
Tax Expenditures
Table 16 shows estimates for the period 1995-96 to 2002-03 of aggregate tax expenditures that have been identified and costed in the Tax Expenditures Statement 1997–98 (TES), which was published in July 1999.
The report A New Tax System outlined significant reforms to both expenses and revenues — some of which will impact on the costings of tax expenditures. Attachment A of the TES sets out the impacts on the benchmarks that have been incorporated and those that are yet to be incorporated. The New Business Tax System has also introduced significant reforms which will impact on benchmarks against which a tax expenditure is costed. A reassessment of the appropriate benchmarks resulting from reform in the two packages will be undertaken prior to the publication of the next TES.
Table 16: Aggregate Tax Expenditures 1995-96 to 2002-03
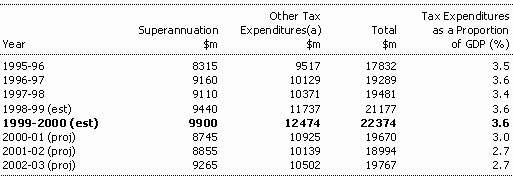
(a) These aggregates do not include measures allowing delayed payments of tax.
In analysing the data presented in Table 16, there are a number of considerations that must be kept in mind.
- These figures will understate the total cost to revenue of tax expenditures. The TES does not provide a comprehensive listing of all tax expenditures, and some of those that are identified have not been costed due to a lack of data.
- Tax expenditures in the form of delayed tax payments (such as depreciation allowances, which merely defer tax revenue collections to a later date), have been excluded from the estimates of aggregate tax expenditures.
- Changes over time in methodology and available data used for calculating the cost of particular expenditures mean that there can be quite large revisions to tax expenditure estimates. Therefore, particular tax expenditure estimates may not be strictly comparable from year to year.
- Forward projections for the outyears can be subject to considerable uncertainty. Caution should be exercised when trying to draw strong conclusions on longer-term trends.
1 All references to 'revenue' in this Part refer to accrual revenue unless explicitly noted otherwise.