


Cash surplus
Non-financial public sector
It is estimated that the consolidated non-financial public sector will achieve a cash surplus of 0.5 per cent of GDP in 2002-03.
Chart 2 illustrates that the consolidated non-financial public sector was generally in a deficit position during the early to mid 1990s. The deficit peaked at 4.3 per cent of GDP in 1992-93 before moving into a surplus position in 1997-98. The consolidated non-financial public sector has remained in surplus, with the exception of 1998-99, due to consecutive consolidated general government surpluses. The deficit in 1998-99 is the result of one-off increases in State funding of superannuation liabilities.
The importance of PNFCs to the consolidated non-financial public sector cash surplus declined from the late 1980s, with the privatisation of government businesses.
Chart 2: Consolidated non-financial public sector cash surplus
by sector(a)
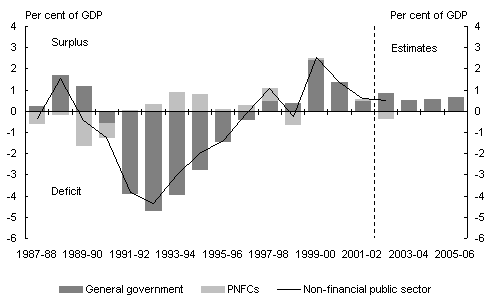
(a) Data for the consolidated PNFCs and non-financial public sector are only available to 2002-03, while general government data is available to 2005-06.
General government sector
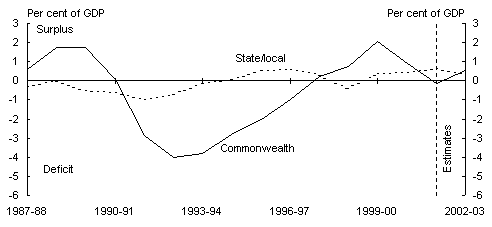
The Commonwealth general government sector has been in surplus since 1997-98, with the exception of a minor cash deficit of 0.1 per cent of GDP in 2001-02.
Chart 3 shows the large contribution of past Commonwealth general government cash deficits to the consolidated non-financial public sector cash deficit. It also illustrates the improvement in the Commonwealth general government sector balance since 1992-93, culminating in the strong surplus outcomes of recent years.
Panel A of Chart 3 shows the sustained improvement in State/local general government balances over the period 1991-92 to 1996-97, from a deficit of 1.0 per cent of GDP to a cash surplus of 0.6 per cent of GDP. The State/local sector has since maintained surpluses (with the exception of 1998-99). It is estimated that the State/local cash surplus will reduce to 0.3 per cent of GDP in 2002-03, down from 0.6 per cent of GDP in 2001-02. This largely reflects the State governments' expectations of a more subdued property market and hence, reduced State government receipts from property taxes such as conveyancing duty.
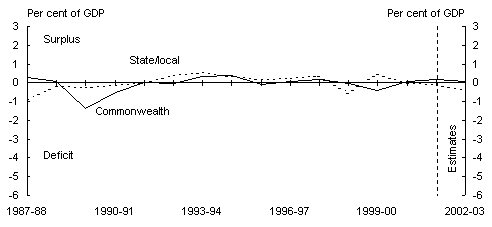
Chart 3: Cash surplus by sector and level of government
A: General government
B: Public non-financial corporations
C: Non-financial public sector
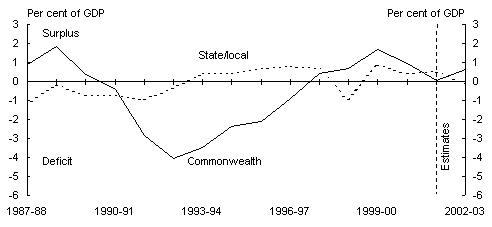
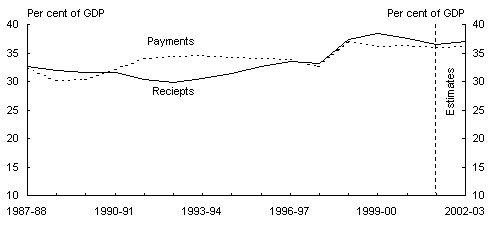
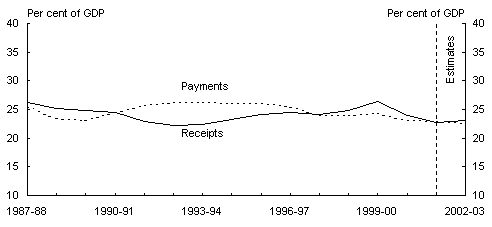
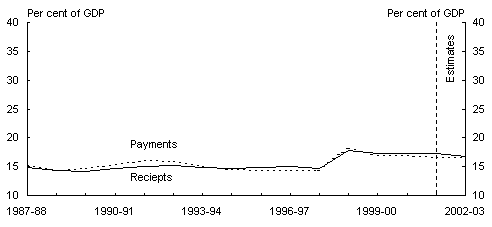
Chart 4 shows trends in general government cash receipts and payments at the Commonwealth, State/local and consolidated levels. Due to its size, the general government sector is the appropriate focus for an assessment of public sector receipts and payments. It is also the sector through which governments primarily affect the level of private sector activity.
Commonwealth receipts and payments estimates in Panel A of Chart 4 are net of goods and services tax (GST) receipts and show a significant decline in 2000-01 with the introduction of The New Tax System. In addition, the reform of Commonwealth and State/local taxes resulted in total consolidated general government receipts falling as a per cent of GDP from 38.5 per cent in 1999-2000 to 36.5 per cent of GDP in 2001-02, in large part reflecting the significant personal income tax cuts and the abolition of Financial Institutions Duty and stamp duty on quoted marketable securities.
The improvement in State finances from 1991-92 is evident in Panel B of Chart 4. This improvement was initially due to payments restraint, helped by lower debt servicing charges, and more recently by the property boom.
The significant increase in both receipts and payments in 1998-99 for the State/local sector and in 1999-2000 for the Commonwealth sector, shown in Panels A and B of Chart 4, were largely due to the move to an accrual accounting framework and the subsequent `grossing' up of cash receipts and payments, whereas prior to this some cash receipts were netted off payments.
Public non-financial corporations (PNFCs)
The PNFC sector is an important provider of economic infrastructure and contributes significant revenue to the general government sector, mainly in the form of dividends. State/local governments account for the majority of total PNFC sector payments, reflecting State responsibility for infrastructure and service provision in areas such as electricity, gas, water and public transport.
PNFC privatisations over the last decade have occurred in two main sectors - electricity and gas (such as Victoria's and South Australia's electricity assets) and transport and communications (such as the partial sale of Telstra). Proceeds of asset sales have largely been used to reduce, or contain the growth of, government net debt, resulting in ongoing savings in public debt interest.
As shown in Chart 2 of this Statement, the consolidated PNFC sector has maintained a cash surplus position through much of the 1990s. Following small surpluses in 2000-01 and 2001-02, the sector is projected to return to deficit in 2002-03, mainly due to relatively large deficits in the New South Wales, Victorian, Queensland and Western Australian PNFC sectors.
Chart 4: General government receipts and payments by level of government
A: Commonwealth
B: State/local
C: Consolidated