


Net debt
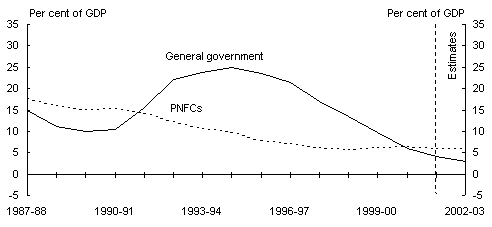
Chart 5 shows that consolidated general government net debt as a share of GDP is expected to further decline over the forward estimates period. Consolidated non-financial public sector net debt is estimated to be 8.8 per cent of GDP in 2002-03, compared with the most recent peak of 34.9 per cent in 1994-95.
Charts 2 and 5 indicate the broad relationship between cash deficits and net debt levels. The financing of Commonwealth cash deficits resulted in a substantial increase in general government net debt as a share of GDP over the early 1990s.
Chart 5 also shows the decline in PNFC sector net debt as a share of GDP since the late 1980s, reflecting lower levels of capital expenditure, improved efficiency and privatisations. This decline moderated the increase in non-financial public sector net debt as a share of GDP in the first half of the 1990s.
The subsequent improvement in non-financial public sector net debt mainly reflects the Commonwealth moving back into budget surpluses and the application of privatisation proceeds to debt retirement at both the Commonwealth and State/local levels.
Chart 5: Consolidated government non-financial public sector net debt by sector (as at end of financial year)(a)
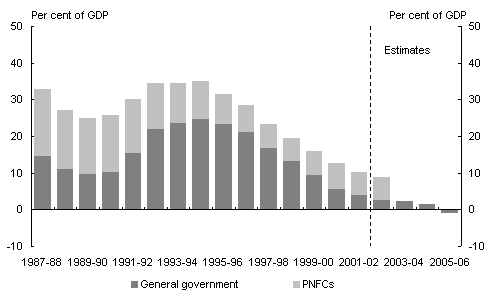
- Data for the consolidated PNFCs and non-financial public sector are only available to 2002-03, while general government data is available to 2005-06.
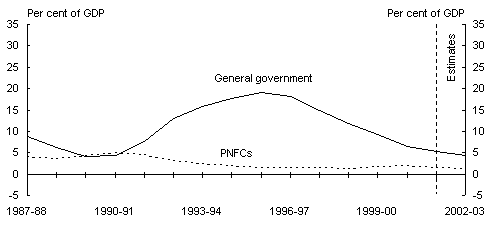
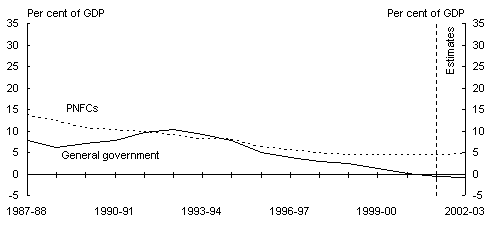
Chart 6 shows that most Commonwealth net debt is held by the general government sector whereas almost all State/local net debt is held in the PNFC sector.
As shown in Panel A of Chart 6, Commonwealth general government net debt as a share of GDP grew from low levels in the late 1980s to a peak of 19.1 per cent in 1995-96. Successive cash surpluses and asset sales (most notably the partial sale of Telstra) have reduced Commonwealth general government sector net debt to an expected 4.3 per cent of GDP in 2002-03.
In contrast, State/local general government net debt grew more modestly in the early 1990s and is expected to decline from a peak of 10.3 per cent of GDP in 1992-93 to around -0.8 per cent in 2002-03, as shown in Panel B. This improvement within the State/local general government sector reflects both the impact of asset sales and fiscal consolidation during the second half of the 1990s. However, some individual States continue to face substantial net debt burdens (see Budget Paper No. 3 - Federal Financial Relations 2003-04 for more information).
Chart 6: Non-financial public sector net debt by level of government and sector (as at end of financial year)
A: Commonwealth
B: State/local
C: Consolidated