



Building on a strong foundation
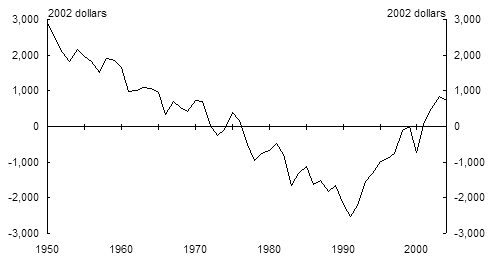
Australia’s recent economic performance is impressive, both compared with other developed countries and by historical standards. In the four decades from 1950, growth in GDP per person — one indicator of improvements in living standards — usually fell below the OECD average rate of growth. However, in the past decade or so Australia’s performance has improved dramatically (Chart 1). GDP per person has grown much faster, on average, than in both the United States and the OECD, raising Australia from 18th highest GDP per person among OECD countries to 8th today.
This section highlights the main drivers of Australia’s new prosperity and discusses the ways in which Australians have benefited.
Chart 1: Australia’s economic revival
The difference between Australian and OECD average GDP per person(a)
- OECD data are for the 24 longest standing OECD member countries.
Source: Groningen Growth and Development Centre and The Conference Board (2005).
The reasons for Australia’s prosperity
One approach to understanding the drivers of economic growth is to consider trends in population growth, labour force participation and productivity (see the detailed discussion in Budget Paper No. 1, Budget Strategy and Outlook 2003-04, Statement 4). Improvement in living standards, as measured by GDP per person, is the result of growth over time in the proportion of the population that is of working age, the number of hours worked by each person of working age, and the volume and quality of goods and services produced during those hours of work.
From the early 1990s, higher rates of labour productivity growth, rather than more favourable changes in the population age structure, or labour force participation rates, have driven Australia’s strong economic performance. Labour force participation, as measured by the combination of average hours worked and the rate of employment among those aged 15 years and older, contributed little to growth in output and average incomes over the last four decades. While the increase in the participation of women in the workforce has more than offset the gradual decline in the participation of men, increased aggregate participation has been largely offset by the decline in average hours worked, largely reflecting the increase in part-time work (ABS 2005f; Reserve Bank of Australia 1997).
Beginning at the start of the 1990s, Australia’s rate of labour productivity growth revived following decades of lagging other major developed countries. Productivity grew more rapidly during the latter half of the 1990s than during any comparable period in the past forty years. Australian labour productivity even grew faster than the ‘new economy’ of the United States (Chart 2). The revival since the 1990s is especially remarkable in that it did not accompany a worldwide productivity boom. Indeed the average rate of labour productivity growth was slower across the OECD during the 1990s than in the previous decade. This suggests that additional circumstances unique to the Australian economy were responsible.
Chart 2: Labour productivity growth(a)
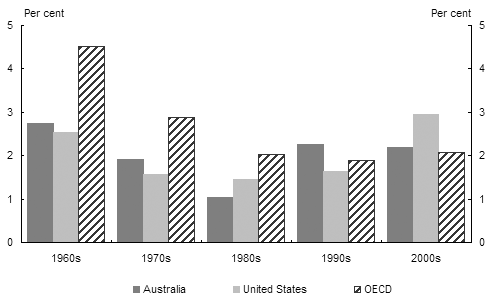
- OECD data are for the 24 longest standing OECD member countries. Data are average annual growth rates.
Source: Groningen Growth and Development Centre and The Conference Board (2005).
Labour productivity growth over time reflects:
- increases in capital per worker (that is, capital deepening);
- improvements in labour quality through education and experience; and
- improvements in the efficiency with which labour and capital are used, through innovative work practices, the achievement of economies of scale and technological developments.
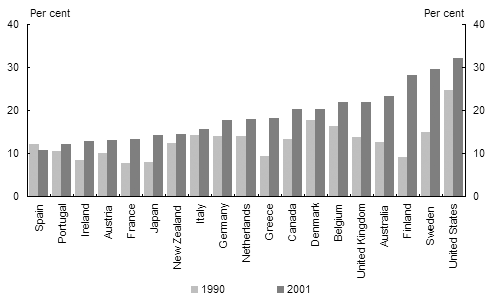
In the 1990s, the rate of capital deepening accelerated from the slow pace of the 1980s (ABS 2004a). The rapid investment in, and use of, information and communication technology was particularly important. Australia has been among the world’s leading users of information and communication technology (Chart 3).
Chart 3: Investment in information and communication technology
Share of non-residential fixed capital formation
Source: OECD (2005b).
However, improved efficiency (often referred to as multi-factor productivity) was the predominant driver of Australia’s productivity revival (ABS 2004a). Australia’s multi-factor productivity growth during the 1990s was stronger than for all other OECD countries for which data are available, except Finland and Ireland (OECD 2005b).
Central among the drivers of this improved efficiency was the broad and deep programme of mutually reinforcing reforms implemented during recent decades (IMF 2004; OECD 2005a; Parham 2004). Key reforms included: liberalising trade, foreign investment, financial markets and workplace relations regimes; tax reform (including reforms of the indirect tax system and targeted incentives to work and save); corporate law reform; and implementing a broad-ranging National Competition Policy agenda.
The resulting increase in domestic and international competition encouraged both a more efficient allocation of resources and a more vigorous pursuit of productivity improvement. More flexible labour markets permitted the reorganisation of work practices to take advantage of improvements in technology and skills. More flexible financial markets improved access for new, developing industries to the capital they required.
Microeconomic reforms and changes in behaviour have worked to raise the level of output the economy is capable of producing. They have been complemented by the Australian Government’s macroeconomic reforms in the mid-1990s which placed both fiscal and monetary policies within sustainable medium-term frameworks. Sound and sustainable macroeconomic policies have delivered a smoother pace of economic growth. They have helped avoid inflationary pressures while accommodating a steady decline in the unemployment rate. The resulting stable, low interest rate environment has provided security for firms to innovate and invest.
In recent years, Australian incomes have been bolstered by favourable changes in the relative prices of our imports and exports. Rapid economic development in China and India raised global demand and prices for the resources that Australia exports, while reducing the world price for manufactured imports. This has continued previous trends that resulted from rapidly declining prices for information technology and communications equipment. Shifts in the terms of trade will influence the direction in which Australia’s manufacturing, mining and service sectors develop and contribute to ongoing prosperity.
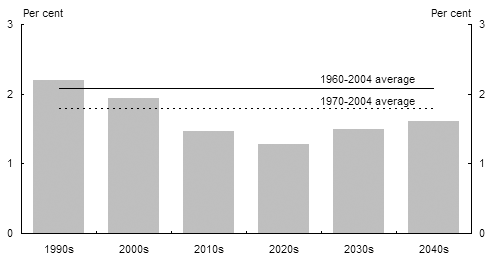
The challenge will be to continue to improve living standards as the baby-boomer generation moves into retirement and causes a decline in the proportion of the population of traditional working age (15 to 64 years, that is, between compulsory school and age pension age). This will tend to reduce the proportion of Australians participating in the labour force and slow economic growth (Chart 4).
Chart 4: Projections of average annual growth in GDP per person
Source: ABS (2004a); and Productivity Commission (2005a).
The benefits of increased prosperity
The benefits of Australia’s greater prosperity have been widely shared.
More Australians are now able to find work, with more than 1.5 million jobs created since 1996 (ABS 2005g). This has permitted a record high proportion of people of traditional working age to be engaged actively in the workforce. The unemployment rate has fallen from a peak of almost 11 per cent in 1992 to around 5 per cent, the lowest rate since the mid-1970s.
The disposable incomes of Australian households have increased. Strong productivity growth has allowed real wage rates to increase. On average, adults working in full‑time jobs earned around $200 more per week in 2004 than they did in 1990 in 2004 dollars (ABS 2005b, 2005c). The benefits of real wage growth have been shared with Australians on a wide range of pensions, including the Age Pension, as those pensions increase in line with male total average weekly earnings.
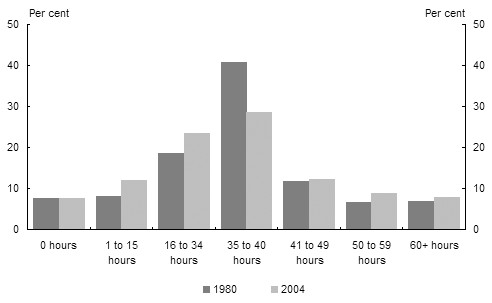
Australian households now also have greater flexibility to manage their work, study, personal and leisure time. This is illustrated by the broader distribution of working hours (Chart 5). Part-time and casual work enables people to tailor their work to the demands of personal commitments and enables employers to meet better the demands of their customers. Almost half of the jobs created in the past decade have been part‑time (ABS 2005a). While the majority of part-time workers are satisfied with the number of hours they work, a minority would prefer to work more hours.
This flexibility has allowed more Australians to study beyond the compulsory school age while managing work commitments. Almost two-thirds of those enrolled in post-secondary education or training are participating in the labour force, with a majority working part-time (ABS 2004b).
Chart 5: Employment by hours worked per week
Per cent of employed persons
Source: ABS (2005f).
Australians also have more flexibility to choose the time at which they retire. Although Australians are living longer than a generation ago, many are retiring earlier from full-time work. Some have moved into more flexible work arrangements, while others are involved in caring and other voluntary roles, or simply enjoying more leisure. Others have chosen to continue to work beyond age pension age.
Economic growth also has strengthened Australian household balance sheets. Household wealth has doubled over the past decade (ABS 2004a). This has been assisted by increased coverage and rates of saving into superannuation over the past two decades. Reliable employment also has provided households with greater capacity to save, borrow and invest for their futures.
Economic prosperity has allowed the Australian Government to expand the provision of public services while lowering tax rates. In addition, sound fiscal management has contributed to a reduction in Australian Government debt levels to among the lowest in the OECD (OECD 2004b).
Australia’s economic development has also allowed the achievement of broader social objectives. The United Nations measures such achievements using a Human Development Index (United Nations 2004). It considers improvements in human capabilities and opportunities by incorporating indicators of health and education together with output per person. By this measure, the wellbeing of Australians ranked the third highest of 177 countries in 2002. This is 11 places higher than in 1990 and nine places higher than rankings based on output per person alone.
The challenge is to maintain and further improve the policy and institutional environment for future prosperity.