



Appendix G: Australia's tax system
Australia's tax system compared with the OECD
The analysis in this section includes the tax systems of all levels of government combined — national, state and local. Comparisons are provided with the tax systems of other OECD economies.
Tax burden
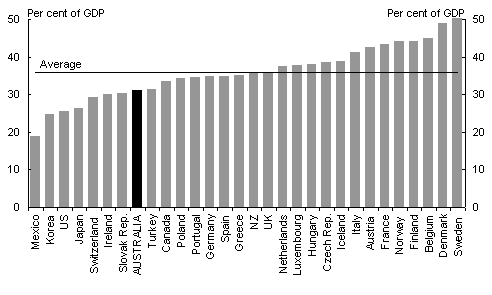
Australia's tax burden — defined as taxation as a proportion of GDP — is low by international standards. In 2004 (Australia's 2004-05 financial year), the latest year for which comparable international data are available, Australia had the eighth lowest tax burden of the OECD countries (Chart G1) and has typically ranked in the bottom third of countries since 1965.
- In 2004, Australia's tax burden was 31.2 per cent — below the OECD average of 35.9 per cent.
Chart G1: Total tax burden for OECD countries, 2004(a)
-
The OECD's measure of the tax burden is the total taxation revenue of national, state and local governments expressed as a percentage of gross domestic product.
Source: OECD Revenue Statistics, 2006.
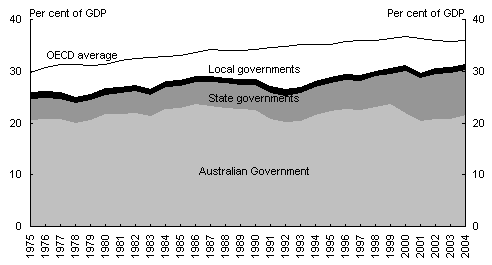
As part of Australia's largest tax reform, The New Tax System, which came into effect on 1 July 2000, the goods and services tax (GST) replaced the inefficient wholesales sales tax and state transaction taxes, and personal income taxes were substantially reduced. The New Tax System also reformed Commonwealth-State financial relations, with all GST revenue provided to the states. The tax burden of Australia's state governments increased from 5.9 per cent of GDP in 1999 to 8.2 per cent of GDP in 2000 with the introduction of the GST (Chart G2). Since 2000, the tax burden of the state governments has increased to 8.6 per cent of GDP in 2004. The Australian Government's tax burden has decreased from 22 per cent in 2000 to 21.7 per cent in 2004.
Chart G2: The Australian tax burden by government sector
Total taxation revenue as a proportion of GDP, 1975-2004
Source: OECD.
Tax mix
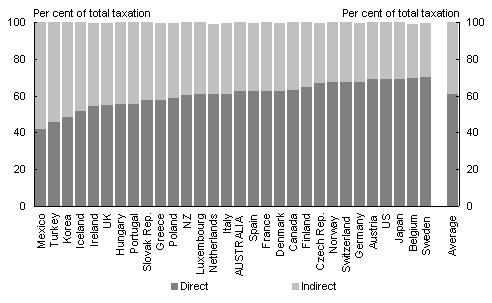
The Australian tax mix is broadly similar to most OECD countries (Chart G3), although there are a few distinguishing features.
Like most countries, Australia raises the majority of its taxation revenue (62.8 per cent in 2004) from direct taxation, which is levied on incomes — wages, salaries, payrolls and profits. Countries with a higher reliance than Australia on direct taxation include Japan (69.7 per cent) and the United States (69.6 per cent).
The remaining 37.2 per cent of Australia's taxation revenue is derived from indirect taxation, including the GST (value added tax), excise and customs duties, and property taxes. The OECD average is 38.6 per cent.
Chart G3: Direct and indirect taxation revenue as a proportion of
total taxation revenue for OECD countries, 2004
Source: OECD Revenue Statistics, 2006.
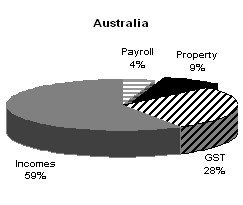
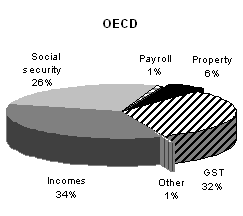
However, Australia's composition of direct taxes differs from most OECD countries. For a significant number of countries, social security taxes are the largest source of direct taxation revenue, whereas Australia is one of two countries that do not levy social security taxes. When income taxes, payroll taxes and social security taxes are taken together, the share of Australia's direct taxes in total taxation is broadly comparable with the OECD average (Chart G4).
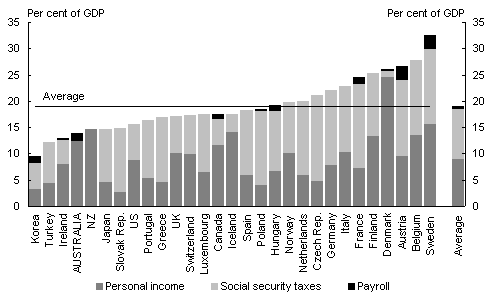
Australia has the fourth lowest level of total taxation on personal income — which includes taxes on personal income, social security taxes and payroll taxes — in the OECD (Chart G5). Australia's tax burden relating to these items (13.9 per cent of GDP) is significantly lower than the OECD average (19 per cent).
Chart G4: Australia's tax mix compared with the OECD average(a)
Direct and indirect taxation revenue as a proportion of total taxation revenue, 2004
|
|
-
Social security taxes are payments to the government that are earmarked to provide social security benefits. They usually consist of two components — one withheld from employees' wages and the other paid by employers. Both components are treated by the OECD as a tax on the income of individuals because they form part of an employee's remuneration. Examples of social security benefits funded through social security taxes include: unemployment insurance benefits and supplements; accident, injury and sickness benefits; old age, disability and survivors' pensions; family allowances; reimbursements for medical and hospital expenses; and provision of hospital or medical services. Australia funds these types of government programmes through general taxation revenue rather than a specific social security tax.
OECD Revenue Statistics, 2006.
Chart G5: Components of direct taxation in respect of
individuals and payrolls, 2004
Source: OECD Revenue Statistics, 2006.
Australian Government taxation
The analysis in the previous section included the tax systems of all levels of government combined. This section includes just the taxes of the Australian Government — that is, it excludes taxes imposed by state and local governments.
Tax mix
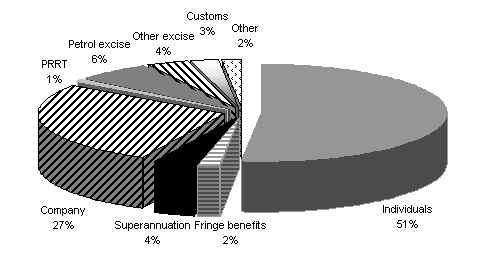
The Australian Government's main source of revenue is from taxes on income. These represent around 85 per cent of total taxation revenue (Chart G6).
- Personal income tax, which is made up of gross income tax withholding, gross other individuals and refunds, accounts for 51 per cent of total taxation revenue. A further 4 per cent is from taxes levied on superannuation and 2 per cent is from taxes on fringe benefits payments.
- Company income tax accounts for 27 per cent of total taxation revenue.
- Most of the remaining taxation revenue is accounted for by excise and customs duties, which account for 13 per cent of total taxation revenue.
Chart G6: Australian Government tax mix, 2007-08
Personal income tax distribution
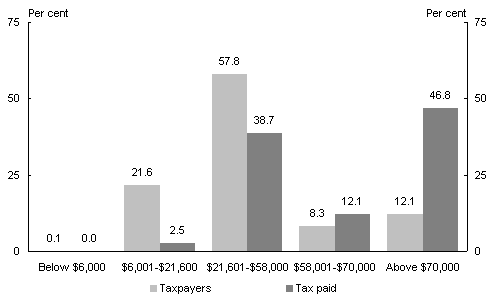
The personal income tax system is progressive — a larger share of the tax is borne by those individuals who are best placed to bear it, while those individuals who have limited means bear relatively little or no tax (Chart G7).
For the 2004-05 income year (the latest year for which tax return data is available from the Australian Taxation Office (ATO)), 47 per cent of personal income tax was collected from the 12 per cent of taxpayers who were in the top marginal tax bracket.
In comparison, the 22 per cent of taxpayers who earned less than $21,600 in taxable income paid only 2.5 per cent of the tax burden.
The 66 per cent of middle income tax payers (in the $21,601 to $70,000 income range) paid 51 per cent of the tax burden.
Chart G7: Personal income tax distribution for 2004-05
Source: Australian Taxation Office, Taxation Statistics 2004-05.
Company income tax distribution
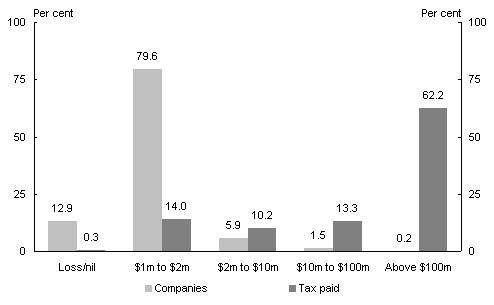
Most company income tax is paid by a relatively small group of large companies (Chart G8). For the 2004-05 income year (the latest year for which tax return data are available from the ATO), over three-quarters of company income tax was collected from the 2 per cent of incorporated taxpayers that earned more than $10 million in total income.
Chart G8: Company tax distribution for 2004-05
Source: Australian Taxation Office, Taxation Statistics 2004-05.
Indirect taxes
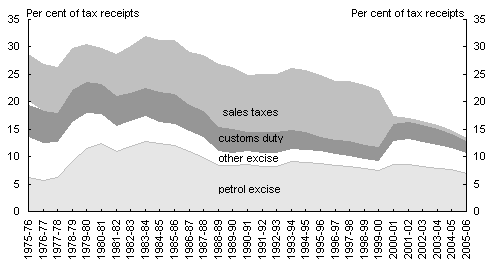
The share of indirect taxes in total taxation receipts is in long term decline because some of the indirect tax bases do not grow as quickly as the income tax bases and because of policy decisions taken by governments to reform the indirect tax base (Chart G9).
Chart G9: Australian Government indirect taxes
Source: Treasury.
With the abolition of wholesale sales tax, the removal of indexation from petroleum excise and trade liberalisation, indirect taxation receipts are expected to continue to decline in relative importance for the Australian Government.
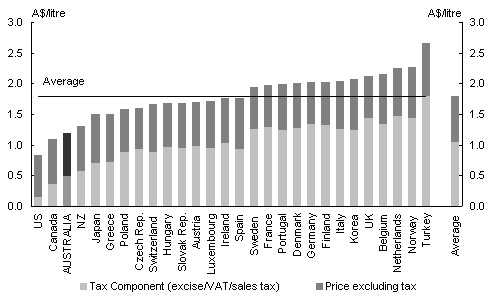
The rate of excise duty on unleaded petrol in Australia is 38.1 cents per litre. It has been at this level since the indexation of petrol excise rates to the consumer price index (CPI) ceased in March 2001. The impact of excise duty on unleaded petrol, combined with the impact of general consumption taxes (VAT, GST and sales taxes), is shown in Chart G10 for most OECD countries. Under this combined measure, which illustrates the total tax impost on consumers, the average level of tax included in petrol prices for the OECD countries shown was A$1.04 per litre in the first quarter of 2006. In comparison, the level of tax included in unleaded petrol prices in Australia for this quarter was less than half this amount at A$0.49 per litre — the third lowest of the OECD countries for which comparable data are available.
Chart G10: Unleaded petrol prices(a)
OECD countries, first quarter 2006
-
Converted to Australian dollars using US/Australian dollar exchange rate from the first quarter of 2006. Tax data is for the first quarter of 2006. Data for Iceland and Mexico was unavailable.
Source: Australian Treasury estimates based on International Energy Agency and OECD data.