




Statement 4: Assessing the Sustainability
of the Budget
Returning the budget to surplus
A plan to return the budget to surplus is a key element of fiscal sustainability. Fiscal sustainability is the capacity of the Government to efficiently finance present and future expenditure programs. Efficient financing requires choosing financing methods that support economic growth and living standards.
Fiscal sustainability is essential for maintaining macroeconomic stability, reducing economic vulnerabilities and improving economic performance. It reduces the degree of uncertainty about future fiscal policy settings and facilitates decision‑making within the economy, especially regarding the accumulation of physical and human capital, technological progress, workforce participation and productivity.
The Government has a clear, achievable strategy to return the budget to surplus. The Government will allow the level of tax receipts to recover naturally as the economy strengthens and will hold real growth in spending to 2 per cent per annum, once economic growth is above‑trend, until the budget returns to surplus.
The return to surplus depends on the trajectory of economic growth
The return of the budget to surplus depends on policy decisions taken and the future trajectory of economic growth in Australia and globally. The speed of Australia's economic recovery will determine the rate at which the automatic stabilisers reverse and tax revenues recover.
The economic recovery in Australia's forecasts and projections is informed by the dynamics of past economic cycles, but economic experiences can vary markedly (Box 2). There is variation across countries and across types of economic downturns, as well as variation depending on the shape and timing of the policy responses.
Australia has experienced eight recessions since the Great Depression. However, there is more difficulty in making comparisons with economic cycles that are further back in time. The recessions of the early 1980s and early 1990s provide the most insight into the current dynamics of the economy. In these recessions, real GDP fell by 2¾ per cent on average from peak to trough, while the unemployment rate rose by an average of 5 percentage points (Chart 4).
Chart 4: Average impact of early 1980s and early 1990s recessions
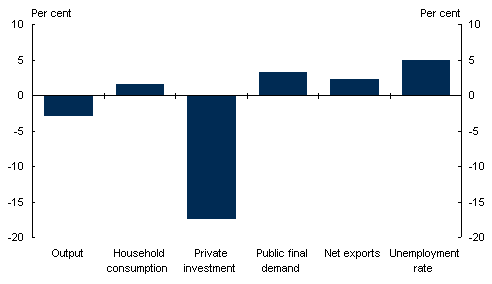
Note: Data are based on the percentage change in the period between the pre‑recession peak and trough in output. The unemployment rate is based on the percentage point change from the pre‑recession low to the post‑recession high. Net exports are shown as a change in level as a per cent of GDP.
Source: ABS cat. no. 5206.0 and 6202.0.
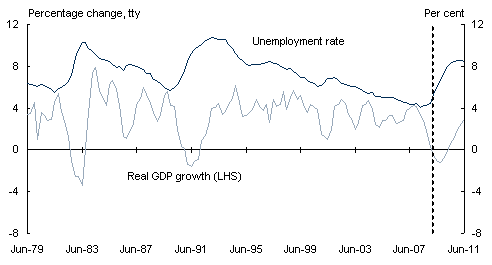
Following a recession, it takes time for the economy to adjust and return to full employment, given the myriad of linkages, both within new and expanding firms and between firms, which need to be re‑established. In particular, the unemployment rate can take significantly longer than real GDP to recover. The unemployment rate returns to its pre‑recession level only after a sustained period of strong growth in the economy (Chart 5).
Chart 5: Real GDP growth and the unemployment rate
Source: ABS cat. no. 5206.0, 6202.0 and Treasury.
The risks around the return to surplus
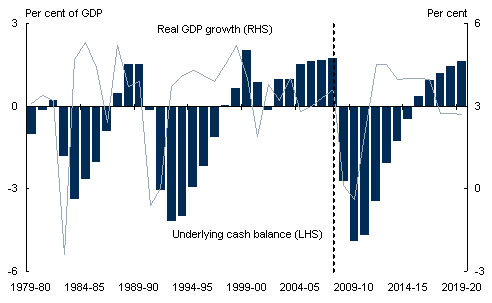
In the economic forecasts and projections, growth in real GDP during the first three recovery years averages 3¾ per cent. This is a slower recovery than after the early 1980s and early 1990s recessions, where growth over the first three recovery years averaged 4.8 per cent and 4 per cent. Under these forecasts and projections, and the medium‑term projections contained in Statement 3, the budget deficit is expected to peak at 4.9 per cent of GDP in 2009‑10 and return to surplus in 2015‑16 (Chart 6).
Chart 6: Underlying cash balance
Source: ABS cat. no. 5206.0 and Treasury.
The economic forecasts and projections involve both upside and downside risks. A discussion of these risks allows an evaluation of fiscal sustainability in an environment of significant economic uncertainty.
On the upside, the speed and size of the global fiscal and monetary policy responses may result in a stronger 'bounce‑back' in the global economy. This would provide support to the Australian economy and would be expected to lead to stronger growth in nominal GDP over the recovery phase. It would also hasten the return to surplus.
The emerging economies of China and India may provide particular support to such a scenario. These economies have a significant process of 'catch‑up' ahead of them, which presents substantial opportunities for the Australian economy (Chart 7).
Chart 7: Per capita GDP convergence for selected Asian economies
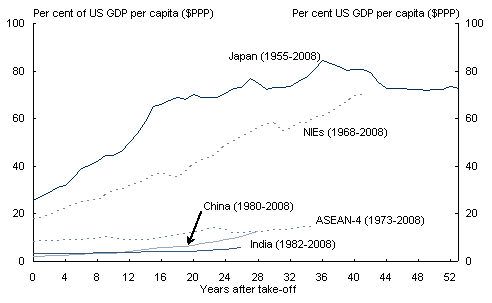
Note: The first year of take‑off for economies, excluding China and India, is the year when the three‑year moving average of constant price export growth first exceeded 10 per cent. The first year of take‑off is 1980 for China and 1982 for India. The ASEAN‑4 consists of Indonesia, Thailand, Malaysia and the Philippines. The Newly Industrialised Economies (NIEs) consist of Hong Kong, Korea, Singapore and Taiwan.
Source: The Conference Board Total Economy Database, IMF 2009c and Treasury.
On the downside, the world is currently facing a significant challenge in responding to the consequences of the global financial crisis and addressing its underlying causes. The longer this takes, the longer it will take for the global economy to recover. An extended period of global adjustment could result in weaker global growth, dragging on Australia's nominal GDP growth and delaying the return to budget surplus.
While global developments may impact on Australia's budget deficit and the exact timing of the return to surplus, this should not generate risks to Australia's fiscal sustainability. Australia has a clear, achievable fiscal strategy that ensures that tax receipts recover naturally, stimulus measures are temporary and real growth in spending is restrained when the economy recovers.
Box 2: IMF research on the general dynamics of recessions and recoveries
The IMF (2009c) has examined the general dynamics of recessions and recoveries in the economic cycles of 21 OECD economies over the past 48 years. This research shows that economic cycles are asymmetric. Changes to output and employment tend to be larger and sharper in both recessions and recovery phases of expansions than during full expansions.
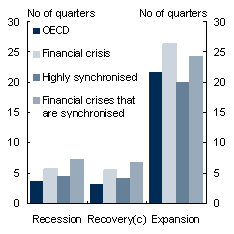
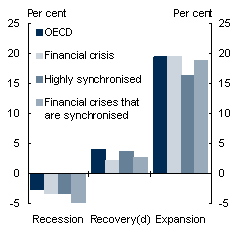
The IMF has found that following a recession, an economy typically recovers to its previous peak output in less than a year (Chart A1). Recoveries tend to be steeper than recessions, with the average growth rate in real GDP being around 25 per cent higher than the contraction rate in a recession. There is also evidence of a bounce‑back effect: output growth during the first year of recovery is significantly and positively related to the severity of the preceding recession.
Chart A: Average duration and amplitude of stages of the economic cycle
A1 Duration(a)
A2 Amplitude(b)
- Duration is the number of quarters from peak to trough for recessions.
- Amplitude is the percentage change in output from the peak to the following trough of a recession.
- From the trough, recovery is the number of quarters taken for output to reach the previous peak.
- Recovery amplitude is the percentage change in output in the four quarters following the trough.
Source: IMF 2009c.
While these are the results for a typical OECD recession, the IMF finds more sobering results for recessions associated with financial crises or those that are highly synchronised across the world. Such recessions have been more severe and longer lasting than the typical recession (Charts A1 and A2). Recoveries from these recessions have also been slower and tend to be characterised by weak domestic demand and tight credit conditions. In recoveries from globally synchronised recessions, exports play a much more limited role in the recovery than in the typical business cycle. The current downturn is both highly synchronised and associated with a deep financial crisis, a rare combination in the past 50 years.
If www.budget.gov.au responds slowly or you are having trouble downloading a document, try one of the Budget Website Mirrors
Note: Where possible, Budget documents are available in HTML and for downloading in Portable Document Format(PDF). If you require further information on any of the tables or charts on this website, please contact The Treasury.