




Statement 5: Revenue
Revisions to the revenue forecasts
With successive downward revisions in economic growth have come revisions in estimated taxation receipts.
Estimated tax receipts for 2008‑09 are now $23 billion, or 8 per cent below the estimate in the 2008‑09 Budget. This is currently estimated to be the largest fall in receipts compared to the budget year forecast since 1930‑31 (Chart 1).
Chart 1: Difference between receipts outcome and budget year forecast(a)
(per cent of the outcome1)
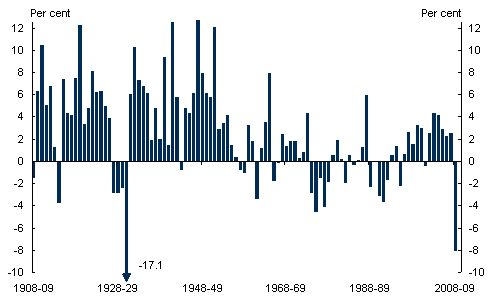
- The differences between forecasts and outcomes include post‑budget measures relating to the budget year or budget measures announced but not enacted. These impacts are likely to be small in most years.
Source: Treasury estimates
The reduction in estimated tax receipts since last year's Budget peaks in 2010‑11 at $54 billion.
In aggregate, since the 2008‑09 Budget estimated taxation receipts (excluding the impact of new policy decisions) were revised down at the Mid‑Year Economic and Fiscal Outlook 2008‑09 ($37 billion over the four years 2008‑09 to 2011‑12), the UEFO ($76 billion) and in the 2009‑10 Budget ($60 billion) (Chart 2). In total, there has been $173 billion of downward revisions over the four years to 2011‑12, equal to 14 per cent of total taxation receipts. Company taxation and capital gains tax account for around $90 billion and around $30 billion, respectively, of these revisions.
Chart 2: Downward revisions to taxation receipts since the 2008‑09 Budget(a)
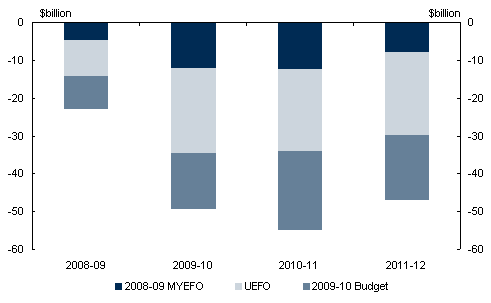
- Downward revisions are parameter and other variations only.
Source: Treasury estimates.
This budget introduces taxation receipt estimates for 2012‑13 for the first time. These estimates are considerably less than they would have been a year ago. Adding potential downward revisions to the 2012‑13 estimates, the total downward revisions to taxation receipts since last budget would be around $210 billion. The downward revisions in 2011‑12 and (implicitly) 2012‑13 and beyond become progressively smaller as the economy recovers and grows above trend.
These downward revisions are approaching the total upward revisions to taxes made in the three years of rapidly rising commodity prices between the 2005‑06 Budget and the 2008‑09 Budget.
As the full extent of the crisis unfolded through 2008‑09, the outlook for tax receipts progressively deteriorated.
As detailed in Statement 2, the global financial crisis radically worsened with the failure of Lehman Brothers in September 2008 and the negative flow‑on effects to an already weak global economy accelerated sharply. Equity prices also fell sharply through this period with the S&P ASX 200 falling below 4,000 points.
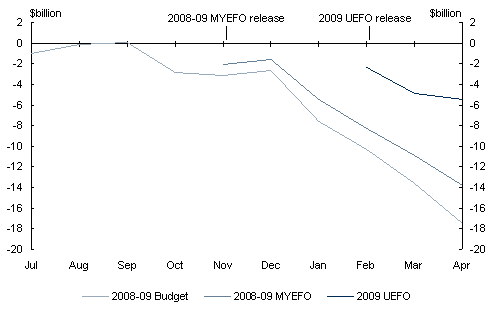
Despite this, tax collections throughout the September quarter of 2008 remained broadly in line with expectations at the time of the 2008‑09 Budget (Chart 3). This was largely associated with steady employment outcomes over this period. A sudden dip in tax collections in October to below those expected at the 2008‑09 Budget primarily reflected shortfalls in company tax collections and, together with the weaker economic outlook, were a key factor in the $37 billion in downward revisions to tax receipts made at MYEFO in November.
However, by late 2008 and early 2009 the recession deepened globally with inevitable consequences for the Australian economy. Tax collections again declined significantly from expectations early in 2009. Company tax collections continued to be below expectations but individuals' income tax collections also softened as the labour market began to deteriorate. These shortfalls in tax collections against expectations contributed substantially to the $136 billion in downward revisions to the tax receipt estimates at UEFO and in this Budget.
Chart 3: Divergence in 2008‑09 total tax collections from expectations
Source: Treasury estimates.
The synchronised nature of the global recession means that other countries have also substantially revised down revenue estimates over the past year (Box 1). Australia's experience compares relatively well with that in other countries, particularly given that our downturn in nominal GDP has been amplified by the fall in our terms of trade.
Box 1: International comparisons of revisions to GDP and receipts
In the past year, the global recession has led governments around the world to markedly revise down economic growth estimates and, in turn, sharply revise down expected government receipts.
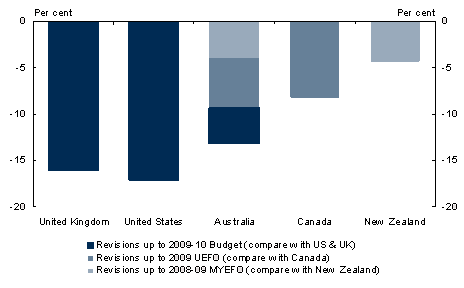
Caution is advised when making direct comparisons across countries. The size of revisions are significantly influenced by cross‑country differences in tax system structures, timing of fiscal updates and the stage of the economic cycle. In addition, the timing of the 'budget' year varies between countries. The closest match to Australia's 2009‑10 year has been used in the analysis, with the revision calculated by comparing the budget forecast with the last published update. Chart A shows revisions to total receipts for 2009‑10 since 2008‑09 Budgets in selected countries.
Chart A: International receipts comparisons in 2009‑10
Revisions to total receipts (excluding new policy)
Source: National budget documents.
Since the 2008‑09 Budget, Australia has revised down expected total receipts by $47 billion (or 14 per cent) in 2009‑10. New Zealand and Canada have made less significant revisions to date. However, their revisions compare closely with Australian revisions at MYEFO and UEFO respectively (which line up with the timing of New Zealand and Canada's latest estimates). The US and UK wiped off 17 per cent and 16 per cent respectively from earlier estimates, more than Australia's revisions in this Budget.
In all countries receipts were revised down by a larger percentage than nominal GDP. This reflects the progressivity of tax systems with automatic stabilisers cushioning economies during downturns. Also, asset price movements affect tax receipts but have little immediate impact on GDP. The US and UK had the biggest difference between GDP and tax revisions indicating a relatively greater direct impact of the global financial crisis in these countries.
Progression of receipts deterioration
Initially, the effects of the global financial crisis were seen most strongly in lower equity and commodity prices, reducing investment income and business profits, which flowed through to lower capital gains tax and company tax receipts. Prior to UEFO, downward revisions to taxation receipts included:
- CGT being revised down at the time of the 2008‑09 Budget by $15 billion (or 19 per cent) over the period 2007‑08 to 2010‑11 and another $12 billion (20 per cent) at MYEFO as equity prices fell significantly from their peak in November 2007.
- Company tax (including a capital gains tax component) being revised down at MYEFO by $29 billion, owing partly to the continued downward revisions to forecast commodity prices.
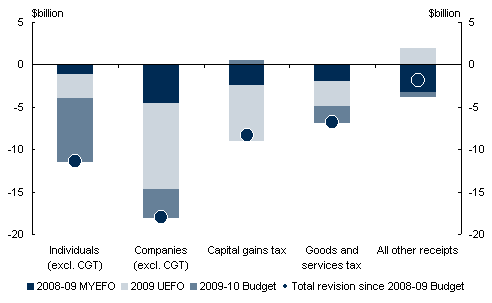
It was only as the crisis unfolded, and the extent of its impact on the outlook for real activity became increasingly evident, that business profits reduced further and consumption slowed, resulting in another reduction in company tax receipts and falls in GST collections. Later, wages and employment growth slowed, reducing collections of pay‑as‑you‑go withholding taxes from the beginning of 2009. Therefore, the recent downward revisions to individuals' income taxes and consumption taxes have become more significant components of changes to taxation estimates. Downward revisions (across the forward estimates period) to individuals' income tax, GST and other consumption taxes account for almost three‑quarters of the revisions in the taxation estimates between UEFO and the 2009‑10 Budget compared with about one‑third of the revisions between MYEFO and UEFO (Chart 4).
Chart 4: Parameter and other variations to receipts in 2009‑10 since the 2008‑09 Budget
Source: Treasury estimates.
Since UEFO, downward revisions to taxation receipts from the weaker economic outlook include:
- estimated individuals' income taxation being $31 billion lower (following a fall of $13 billion at UEFO) between 2008‑09 and 2011‑12 from slower forecast growth in employment and wages;
- company taxation estimates falling a further $11 billion over four years reflecting lower forecasts for company profits (representing 20 per cent of the total revision in this budget, compared with around two‑thirds of the revision at UEFO); and
- GST and other consumption taxes down by $7 billion (following falls of about $11 billion at both MYEFO and UEFO) over four years owing to slower growth in consumption.
Receipts as an automatic stabiliser
A feature of the substantial downward revisions to receipts has been the extent of the decline relative to that of economic growth. This was preceded by a period where 'underlying' revenue growth — revenue growth abstracting from policy decisions —exceeded economic growth (Chart 5). This reflects the fact that certain features of the tax system act as an 'automatic stabiliser' in the economy.
Chart 5: Growth in underlying tax receipts and nominal GDP(a)
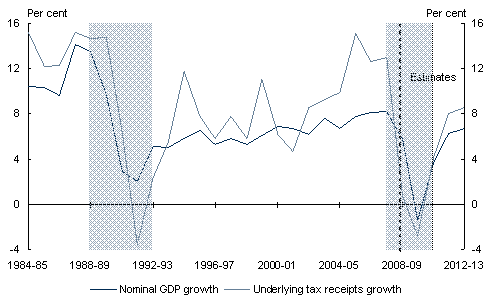
- The shaded areas represent periods of relative weakness in nominal GDP growth, starting from the year before the downturn.
Source: Treasury estimates.
This means that when economic conditions deteriorate, tax receipts fall by a greater percentage than the change in the economy (and vice versa in an upturn). The large reduction in tax then acts to dampen the fall in real GDP.
Consequently, as the economic outlook has weakened, tax receipt estimates have been revised down both because the forecast economy is smaller and due to the counter‑cyclical nature of the tax system. For example, tax receipts are now estimated to be 3.7 per cent lower than at UEFO even though nominal GDP in 2009‑10 is forecast to be 2.4 per cent lower.
The tax system has a number of key automatic stabilisers including the progressive nature of the personal income taxation, company taxation and capital gains tax.
- The progressive nature of the personal income tax system is a major stabiliser. It is progressive because an individual pays a higher proportion of their income in tax as their wage increases.
- Company tax plays a part as in economic downturns profits tend to fall much faster than economic activity, resulting in company tax falling as a share of GDP.
- CGT is also important as asset prices tend to change by more than movements in the real economy, giving it the potential to rise and fall quickly as a share of GDP. The collapse in equity prices since late 2007 has led to a sharp reduction in CGT receipts.
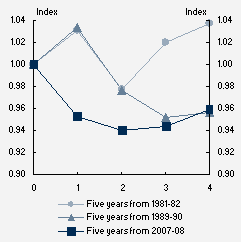
Notably, taxation receipts have fallen more sharply during the early part of the downturn than in the previous two downturns, suggesting that the automatic stabilisers are now more closely aligned with changes in economic circumstances. While the lower inflation environment provides some of the explanation, more important appears to be changes in the composition of revenue and structure of the tax system, including both the higher percentage of tax receipts from CGT as well as the more contemporaneous collection of company and some individuals' tax (Box 2).
The recovery phase
The Australian economy is forecast to recover in 2010‑11 and then projected to grow above trend in 2011‑12 and 2012‑13. As this occurs, tax receipts are expected to begin to grow as the automatic stabilisers reverse their influence. The same contemporaneous relationship between growth and tax receipts that was discussed earlier (and in Box 2) is expected to lead to an earlier recovery in taxation receipts than in previous recessions. However, this effect is expected to be somewhat subdued by the effect of business and capital losses.
In a downturn an increased number of businesses report losses. These losses can be used to offset future taxable profits when business conditions recover. Hence, as the economy begins to recover, there is anticipated to be a period of continued subdued company tax growth as the stock of prior year losses is run down. CGT is expected to behave similarly as accumulated capital losses are used to offset future taxable capital gains.
In addition, the outlook for commodity prices has deteriorated significantly over the past year. The economic forecasts and projections for the terms of trade do not have it recovering to its recent record levels. This will dampen aggregate business profitability to below the levels experienced in recent years. Consequently company tax is expected to average 4½ per cent of GDP over the forward estimates, 1 percentage point below its peak in 2006‑07.
Tax receipts are estimated to grow by 3½ per cent in 2010‑11 but over 8 per cent in 2011‑12 and 2012‑13. The expected growth rates in receipts in 2011‑12 and 2012‑13 are at rates consistent with previous periods of above trend growth.
Revenue as a share of GDP will still be relatively subdued to the end of the forward estimates period but is expected to recover further over the medium term.
This Budget includes medium‑term fiscal analysis past the usual four year forward estimates period, including taxation receipts estimates, in Statement 3.
Box 2: Comparison with past recessions
Tax growth has fallen more sharply during the early part of the current downturn than in the previous two downturns. This reflects the following factors.
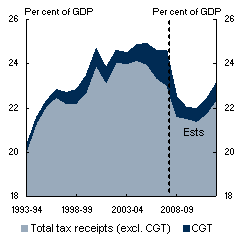
- A decline of over 60 per cent in CGT in the face of collapsing asset prices since late 2007. CGT was only introduced in the mid‑1980s and contributed a small fraction of revenues in the early 1990s, but by 2007‑08 CGT had tripled from 2004‑05 levels, allowing the tax‑to‑GDP ratio to remain stable despite large personal income tax cuts. In 2009‑10, CGT is expected to fall back to around its 2004‑05 level. With falling asset prices preceding the general economic slowdown, CGT receipts were moderating before the economy began slowing.
- A larger fraction of total tax being collected from company profits. A steady increase in the profit share of GDP since the early 1990s saw companies contributing around 21 per cent of tax receipts in 2007‑08, compared with around 13 per cent in the 1980s and early 1990s. In recessions, company profits tend to fall earlier and by more than labour income and, with the profit share starting at a higher level, the tax system responded faster in aggregate to changes in GDP. Movements in the terms of trade have played a significant part in this effect.
- Changes to tax payment arrangements have resulted in tax being paid more contemporaneously as income is earned. This is particularly true for company tax. During the 1980s and early 1990s company tax was paid almost entirely the year after the income was earned so that tax receipts initially remained high even as national income fell, with consequent increases in the tax to GDP ratio. Company tax is now mostly paid during the year income is earned.
Consequently, unlike the first year of the previous two recessions, the tax‑to‑GDP ratio is expected to decrease markedly in 2008‑09 and remain relatively flat during the downturn.
Chart A: Comparison with past recessions
Panel A: Tax to GDP ratio and CGT
Panel B: Underlying tax to GDP ratio
Source: Treasury estimates.
1 All years except 2008‑09 compare the outcome with the Budget forecast. The bar for 2008‑09 compares the 2008‑09Budget forecast with the 2009‑10Budget estimate. The 2008‑09 outcome will be published in the Final Budget Outcome in September.
If www.budget.gov.au responds slowly or you are having trouble downloading a document, try one of the Budget Website Mirrors
Note: Where possible, Budget documents are available in HTML and for downloading in Portable Document Format(PDF). If you require further information on any of the tables or charts on this website, please contact The Treasury.