




Statement 1:
Budget Overview
(Continued)
Fiscal outlook
As a result of the Government's fiscal strategy and a strengthening economy, the budget position is stronger than presented in the Mid‑Year Economic and Fiscal Outlook 2009‑10.
The budget is now expected to return to surplus three years earlier, in 2012‑13. Deficits in earlier years are expected to be smaller than previously forecast.
Table 2: Budget aggregates

- Excludes expected Future Fund earnings.
The size of the deficit is expected to fall each year until the budget returns to surplus, representing a tightening of the fiscal stance of around 1½ per cent of GDP a year. This tightening reflects the planned withdrawal of stimulus, the disciplined approach to spending and the natural increase in tax receipts associated with the strengthening economy.
Notwithstanding the improvement in expected tax receipts associated with the stronger economic growth, over the forward estimates they still remain around $110 billion down on their pre‑crisis levels. Accumulated losses will take some time to work their way through the system and this will delay a full recovery in tax receipts.
An underlying cash deficit of $40.8 billion or 2.9 per cent of GDP is expected in 2010‑11, compared with an estimated deficit of $46.6 billion (3.5 per cent of GDP) at MYEFO. In accrual terms, a fiscal deficit of $39.6 billion or 2.8 per cent of GDP is expected for 2010‑11.
An underlying cash deficit of $13.0 billion is expected in 2011‑12, while surpluses of $1.0 billion and $5.4 billion are expected in 2012‑13 and 2013‑14.
The earlier return of the budget to surplus will bring forward the Government's plan to pay down debt that was accumulated as a result of the global financial crisis. Net debt is now expected to peak at 6.1 per cent of GDP in 2011‑12, compared with the 9.6 per cent peak in 2013‑14 projected in the Mid‑Year Economic and Fiscal Outlook. On current projections, net debt is expected to return to zero three years earlier than previously projected.
Australia's net debt levels remain modest compared with other countries. Australian Government net debt is expected to peak at levels less than a tenth of the average of the major advanced economies (Chart 2).
Chart 2: Government net debt for Australia and the G7
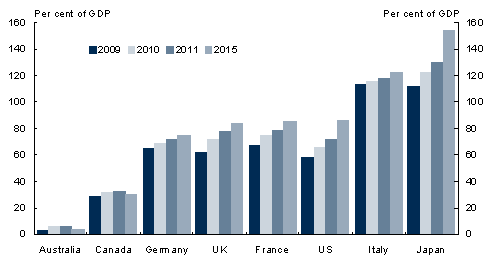
Note: Australian data are for the Australian Government general government sector and refer to financial years beginning 2009‑10. Data for all other economies are total Government and refer to calendar years.
Source: IMF World Economic Outlook April 2010 and Treasury.
If www.budget.gov.au responds slowly or you are having trouble downloading a document, try one of the Budget Website Mirrors
Note: Where possible, Budget documents are available in HTML and for downloading in Portable Document Format(PDF). If you require further information on any of the tables or charts on this website, please contact The Treasury.