




Statement 4:
Benefiting from our Mineral Resources:
Opportunities, Challenges and Policy Settings
(Continued)
Opportunities for Australia
Significant opportunities are available to Australia as a result of abundant mineral resources, coupled with strong global demand and higher world prices for these resources since the early 2000s. There is reason to believe these opportunities will be relatively long‑lasting given the potential for continued strong economic growth over the medium to long term in the world's two most populous nations, China and India, and the impact of that growth on global commodity demand. With the correct policy settings, these opportunities should result in higher national income, the benefits of which are broadly distributed in the community.
The prices we receive for our mineral resources have increased dramatically
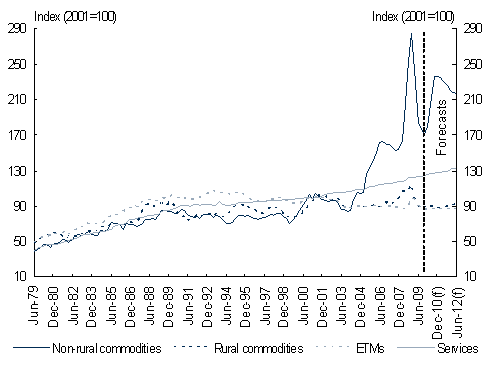
Australia has received dramatically higher prices for its non‑rural commodity exports since the early 2000s (Chart 1), interrupted recently by the impact of the global financial crisis. These higher prices have been driven by increased global demand for energy and metals.
Chart 1: Export prices by goods and services
Note: Elaborately transformed manufactures (ETMs).
Source: ABS cat. no. 5302.0 and Treasury.
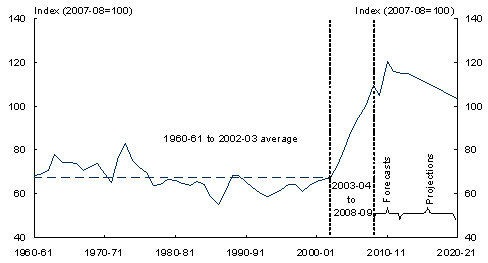
Higher mineral resource export prices, combined with reduced prices of imports (especially imports from low‑cost producing countries in Asia), have translated into an improvement in Australia's terms of trade (Chart 2). An improved terms of trade provides for an increase in Australia's national income, creating an opportunity for an improvement in the wellbeing of all Australians.
Chart 2: Australia's terms of trade
Source: ABS cat. no. 5206.0 and Treasury.
Australia's terms of trade increased significantly over the course of the past decade, to peak initially in 2008‑09 at over 60 per cent above its long‑run average (1960‑61 to 2002‑03). While the terms of trade declined with the onset of the global financial crisis, they are forecast to reach a new peak in 2010‑11 before declining slightly in 2011‑12. The medium‑term projections assume that the terms of trade will continue to decline, reflecting an anticipated increase in the global supply of non‑rural commodities.
Demand is likely to remain strong
The process of economic convergence of China and India with more developed countries, and the prospect that their relatively strong economic growth and consequent demand for resources could well continue into the coming decades, means it is reasonable to expect that there will be a relatively slow unwinding of historically high non‑rural commodity prices.
China's development has resulted in it being the major source of demand growth for mineral resources (ABARE 2010). Since the onset of economic reform around thirty years ago the Chinese economy has enjoyed sustained and rapid economic growth, with a marked catch‑up in per capita incomes against more developed countries (Chart 3). India has also enjoyed solid economic growth since it began liberalising its economy in the mid‑1980s, and has started to reduce its large income gap with other more developed countries (OECD 2010a).
As China's and India's economies have significant remaining potential for catch‑up, their continued growth, barring policy reversals or shocks to their economies, is also likely to underpin relatively strong global demand for non‑rural commodities. However, such growth will not necessarily be smooth, and recent events demonstrate that even as it continues commodity prices can still be volatile.
Chart 3: Catch‑up in GDP per capita: China and India, 1954‑2009
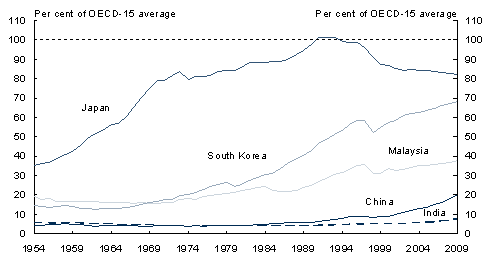
Note: GDP per capita is in 2009 US$ (converted to 2009 price levels with updated 2005 PPPs). The OECD‑15 average is a simple average of Australia, Austria, Belgium, Canada, Denmark, Finland, France, Iceland, Ireland, Netherlands, Norway, Sweden, Switzerland, the United Kingdom and the United States.
Source: The Conference Board Total Economy Database and Treasury.
Aggregate GDP figures alone, however, tell only part of the commodity demand story. The structure or composition of economic activity, and how it changes as an economy grows, is also important (Menzie 1995; IMF 2006a).
In countries with low incomes per capita, consumption of metals and energy (coal, oil or gas) is typically low. But as a country industrialises and urbanises, incomes rise and the consumption of metals and energy typically also rise: in this stage, resource consumption may rise in line with GDP. Industrialisation in China and India is reflected in the high levels of investment and rapid urbanisation in both countries. The urban population shares in China and India in 2009 were respectively around four and two times higher than in 1950. Continued rapid urbanisation in both countries is expected, with urban population shares expected to grow to 73 per cent in China and 54 per cent in India by 2050 (United Nations 2010).
However, once industrialised and urbanised, raw material consumption per person may stabilise or even begin to decline, despite the potential for further GDP catch‑up. At higher incomes, growth typically becomes more services‑driven and the growth in the use of metals per capita tends to stagnate. Growth in the services sector's share of total output is a near‑universal phenomenon in developed countries (Chart 4).
Chart 4: Services share of total output
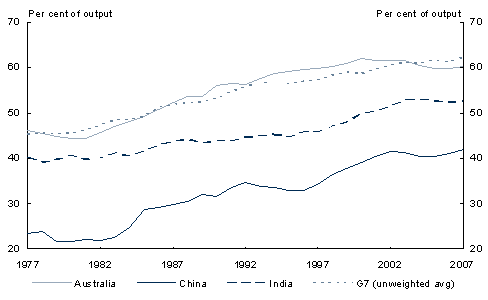
Note: Data for Australia, China and the G7 have been annualised, India uses fiscal year data, data for Japan ends 2006 and Canada ends 2004. For China, data from the tertiary sector proxies the services sector. For India, data are from GDP by industry in current prices with '1999‑00 as the base year'.
Source: EU KLEMS database, CEIC China database, CEIC Asia database and Treasury.
As they are in the industrialisation and urbanisation stage of their development, the potential for substantial catch‑up by China and India in non‑renewable commodity consumption remains, though this may be less than the potential GDP catch‑up.
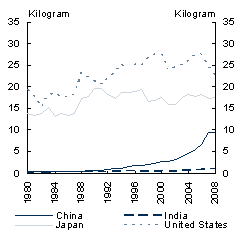
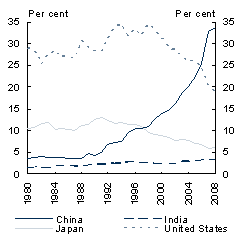
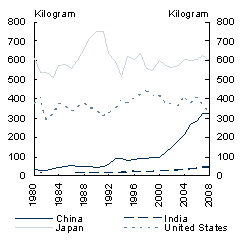
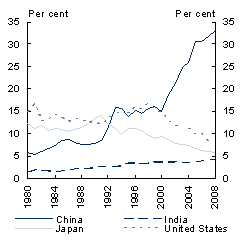
China's and India's growing share of world demand for mineral resources, and further potential for growth, can be seen by consumption trends for aluminium (Chart 5). The remaining scope for catch‑up in consumption by China is less apparent for steel — the production of which uses iron ore and black coal — with China's consumption per capita now around that in the United States, though still less than in Japan. However, as measured consumption includes steel used to produce goods for export, underlying domestic consumption of steel in China is likely to be significantly less than in the United States.
Chart 5: Aluminium and finished steel consumption
Aluminium: consumption per capita
Aluminium: share of world total
Finished steel: consumption per capita
Finished steel: share of world total
Source: ABARE, Steel Statistics Yearbooks and Treasury.
Supply will respond over time
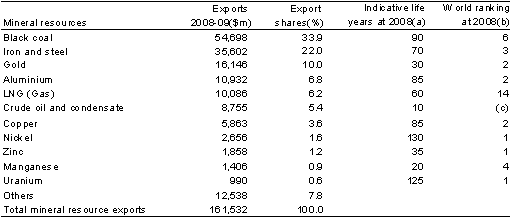
The starting point for Australia's ability to profit on a sustained long‑term basis from higher non‑rural commodity prices is its abundance of mineral resources. For many minerals, Australia's resource reserves rank highly by world standards and their indicative life is considerable (Table 1).
Australian and global supply of mineral resources can be expected to respond to the higher prices, albeit with a lag. Some supply response is already evident. Australia is presently in the early stages of a supply response to price signals that preceded the global financial crisis. The Australian Bureau of Agricultural and Resource Economics is projecting a significant increase in the global supply over the medium term (ABARE 2010). This response is consistent with the projected decline in the terms of trade in the medium term.
Table 1: Mineral resource exports, indicative resource life and ranking
- Indicative life for a commodity is calculated as the stock of the accessible economic demonstrated resource (EDR) relative to annual production for that commodity or the relevant raw commodity.
- The world ranking is based on the EDR in Australia compared to that in other countries.
- The ranking is not available. Australia's reserves of crude oil and condensate accounted for 0.6 per cent of the world total in 2008.
Note: The data for crude oil and condensate and for LNG (Gas) are based on economic demonstrated resources, which for these two commodities is equivalent to accessible economic demonstrated resources.
Source: ABARE, Geoscience Australia and Treasury.
During periods of weak or moderate demand, mineral resource prices tend to reflect the marginal cost of production. A cyclical upturn is often preceded by a period of underinvestment which prevents supply from adequately responding to improved conditions in a timely manner, resulting in significant temporary price increases. Sustained periods of strong prices can generate investment in the resource sector, which is responsive to long‑run price expectations (Grant et al. 2005).
The rate at which supply responds depends in part upon implementation lags from investment decision to supply. These include the time needed for exploration, approval, financing and regulatory compliance, as well as the construction of the mine and its associated supply‑chain.
Long‑run price expectations can also drive a reassessment of the size of global mineral reserves that are recoverable at an economically viable rate. Strong price signals encourage greater investment in exploration activities and new discoveries. Engineering improvements also add to global reserves by increasing the economic viability of marginal resource endowments. However, technological and other productivity improvements can also be offset by a long‑term decline in the quality of resource deposits.
Further, greater political and social stability can create more favourable conditions for mineral exploration investment, leading to an increase in the stock of world mineral reserves. For example, improvements in the political and economic landscape in many Latin American countries have led to increased mineral exploration, investment and production (Kesler 2007). Freight cost barriers are also falling with recent large investments in global shipping (ABARE 2010).
The prices of many commodities declined in the decades leading up to the 2000s (IMF 2006a). A strong supply response and a secular improvement in extraction technology would be consistent with the view that the relative price of many commodities would continue to decline in the long run (Harvey et al. 2010). However, other theories, based principally on concerns over resource depletion, support an alternative view that relative commodity prices will trend upwards over time (Giurco et al. 2010). Other studies have also found slight upward or downward historical trends in commodity prices, with outcomes sensitive to the choice of period over which a trend is considered reflecting the volatility of commodity prices (Frankel 2010).
Prices may remain elevated for some time
Given the above considerations it is difficult to forecast or project long‑term commodity prices and the terms of trade. Nevertheless, there are reasonable grounds — in particular, an expectation that global demand will continue to grow strongly for an extended period — to believe that the terms of trade and mineral resource prices will be sustained at high levels for some time. This depends however on the timing of the supply response and the marginal cost of extraction.
If www.budget.gov.au responds slowly or you are having trouble downloading a document, try one of the Budget Website Mirrors
Note: Where possible, Budget documents are available in HTML and for downloading in Portable Document Format(PDF). If you require further information on any of the tables or charts on this website, please contact The Treasury.