




Statement 4:
Benefiting from our Mineral Resources:
Opportunities, Challenges and Policy Settings
(Continued)
Challenges for the economy
The opportunities provided by the increased worth of Australia's mineral resources together with the associated supply response will also give rise to a number of challenges for the economy as it adjusts over time to the changes in relative prices.
The principal challenges include: ensuring that Australia has institutional and policy settings that make the most of its natural resource endowments; facilitating the adjustments that will arise as labour and capital shift to sectors and regions connected with the mining sector; dealing with tests of the economy's capacity over the next few years; and a current account deficit that is likely to remain relatively high for an extended period.
Converting resource wealth into sustained wellbeing for all Australians
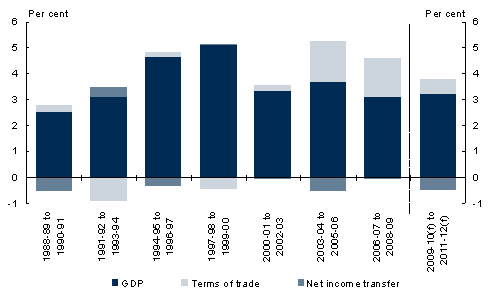
As the terms of trade rose during the 2000s reflecting the increased worth of Australia's exports, gross national income increased at a much faster rate than GDP (Chart 6). Stronger growth in national income relative to domestic production reflects a strong positive effect from changes in the terms of trade, partially offset by an increase in net income transfers to foreigners (including in respect of their ownership of mining companies operating in Australia).1 The expected terms of trade improvement in the forecast period will see a further increase in national income relative to GDP.
Chart 6: Components of real gross national income growth
Source: ABS cat. no. 5206.0 and Treasury.
While the direct effect of higher commodity prices is to increase Australia's national income, natural mineral wealth and increases in such wealth do not always convert into higher sustained growth or wellbeing overall. Not all resource‑rich countries have been able to translate resource wealth into sustained economic performance, and there may be some costs associated with natural resource wealth (see Box 1: Natural resource curses and their causes). But while many resource‑rich countries have at times lagged behind in economic performance, others such as Australia have done relatively well.
The cross‑country evidence highlights sound institutions and policy responses as key explanations for why some resource‑rich countries have had better outcomes than others (Mehlum et al. 2006; Boschini et al. 2007; Frankel 2010). This gives strong support to the notion that, with the right institutions and policy settings, it is possible to not just escape the curse from natural resource windfalls, but to prosper from them.
Box 1: Natural resource curses and their causes
'Natural resource curse' is the term given to the observation that for many countries endowments of oil or other natural resource wealth are associated with lower economic growth than otherwise (Sachs and Warner 2001; Auty 2001). A natural resource curse may also be thought of in terms of its negative impact on political, social, or environmental outcomes (Goodman and Worth 2008). There is an extensive body of literature on the causes of, and policy responses to, the natural resource curse (see Frankel 2010 and Sturm et al. 2009 for recent reviews). Some of the causes documented include the following:
- High commodity price volatility, by leading to income volatility, can adversely affect economic growth (Van der Ploeg and Poelhekke 2007).
- Endowments of commodities, particularly oil, can encourage rent‑seeking and corruption that have significant negative effects on the quality of domestic institutions (Sala‑i‑Martin and Subramanian 2003; Van der Ploeg and Arezki 2007) and democratic processes (Collier 2007).
- The effect of natural resource windfalls on government revenues has the potential to hamper the quality of policymaking. In the absence of a sound fiscal policy framework, this effect can lead to an improper management of public surpluses, for example through pro‑cyclical fiscal policies and unproductive spending (Auty 2001), as well as delays to important economic reforms (Auty 2003).
- Specialisation in natural resources can be detrimental to growth if it leads to reduced incentives to develop non‑resource parts of the economy that may generate spill‑over benefits (Auty 2001; Stevens 2003). For further detail, see Box 2: Dutch disease and de‑industrialisation.
Importantly, the literature finds that it is not inevitable that resource rich‑countries will be worse off than other countries. For the handful of resource‑rich OECD countries like Australia, resource endowments have had a positive effect on GDP per capita (Boulhol et al. 2008). There are also examples of developing countries, such as Botswana, that have benefited from resource endowments (Iimi 2006).
A sustained improvement in the terms of trade will require structural adjustments in the economy
In the long run, sustained higher mineral resource prices will lead to an expansion in the mining sector and related parts of the construction and manufacturing industries, and an increase in national income. For an economy near capacity, this will require a relative decline in other sectors, especially those that are trade‑exposed (see Box 2: Dutch disease and de‑industrialisation). This premise, often referred to in Australia as the 'two speed economy', may present itself as different industries and regions growing at different speeds.
The evidence from recent years points toward the start of these adjustments. However, it is important to note that the structural implications of the terms of trade are not the only adjustments shaping the Australian economy. For example, a sustained increase in the working age population would in part offset these structural adjustments.2 Also, the growth in the services sector, which dwarfs the mining sector as a share of output, is a near‑universal phenomenon in developed countries — representing the other side of the growth composition story (OECD 2005).
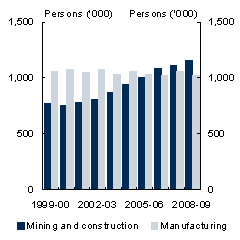
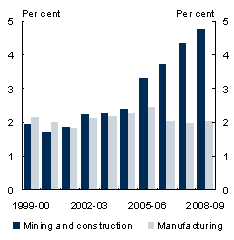
Higher mineral resource prices raise the rate of return on mining investments, inducing greater investment in mining to expand supply capacity. The increased competition for labour from mining (and related parts of the construction sector) puts pressure on other sectors. As expected, the employment and investment shares in mining and construction have increased significantly since the early 2000s (Chart 7).
Chart 7: Growth in mining and construction employment and investment
People employed
Investment as share of GDP
Source: ABS cat. no. 6291.0.55.003, 5204.0 and Treasury.
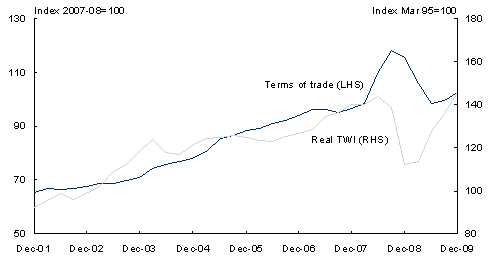
As Australia's terms of trade improve with higher export prices, increased profitability of Australian mining investments attracts capital inflows, causing the exchange rate to increase (Chart 8). The pressure exerted on import competing and non‑mining export industries is one of the means by which economic resources are freed up for use by the mining and mining‑related sectors (Garton 2008).
Box 2: Dutch disease and de‑industrialisation
The potential for rapid growth in the value of mineral exports to have structural implications for the economy was pointed out by Gregory (1976). Subsequently, the term 'Dutch disease' was used by The Economist in 1977 to refer to the adverse effect on Dutch manufacturing of North Sea oil and gas discoveries (The Economist 1977).
A rise in the terms of trade emanating from a rise in the price of commodities due to a demand shock and resource boom affects the Australian economy in two ways: through a resource movement effect and a spending effect (Corden and Neary 1982).
The resource movement effect is the rise in the demand for labour and capital in the commodities sector which leads to a shift in factors of production toward that sector and away from the lagging tradeable sector and (initially) the non‑tradeable sector.
The spending effect occurs as a result of the extra income generated by the commodities boom. This increases the demand for non‑tradeable services, which in turn raises the demand for labour in the non‑tradeable service sector, attracting labour away from the manufacturing sector. As a result of the increased demand for non‑tradeables, their price increases relative to the price of tradeable goods — that is, there is an appreciation of the real exchange rate.
Where capital can be imported and the employment share of the commodities sector is very low, the principal source of adjustment in an economy will occur as a result of the spending effect, including through government spending on non‑tradeables such as retail services and health.
A policy concern associated with Dutch disease is that a temporary increase in commodity prices (or short‑lived resource stocks) leads to a sharp but temporary appreciation in the real exchange rate (which can occur even under a fixed exchange rate regime). As a result, when commodity prices normalise or when resources are depleted, tradeable sectors that have disappeared might not simply reappear. This concern is compounded if government spending does not adjust back to pre‑boom settings.
If the commodity price increase is sustained and resource life long‑lasting, the policy concern is to facilitate structural change to take advantage of the sustained terms of trade improvement, and not to obstruct it. However, this still might lower long‑term growth if the expanding industry does not generate the same extent of positive spillovers as the contracting industry (Gylfason et al. 1999).
This highlights the fact that even though it is difficult to predict, the extent to which an improvement in the terms of trade is sustained can have a strong bearing on the appropriate policy responses.
Chart 8: Real exchange rate and the terms of trade
Note: Trade‑weighted index (TWI).
Source: ABS cat. no. 5302.0 and RBA.
Consistent with the growth of inputs, the volume of mineral resource production has also increased since the early 2000s. However, the rate of growth of outputs for mining so far is relatively restrained, reflecting both the depletion of existing sites and fields and time lags in mining investment generating increased output (Gruen and Kennedy 2006; Productivity Commission 2009). There has also been continued growth in both manufacturing and service exports and outputs over the same period.
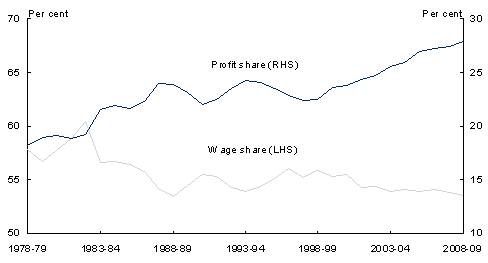
Chart 9: Profit and wage share of total factor income
Note: The profit share excludes returns in respect of dwellings owned by persons and profits of the general government, and the wage share is for non‑farm compensation of employees.
Source: ABS cat. no. 5206.0 and Treasury.
As the mining sector is highly capital‑intensive, its expansion relative to other sectors can also be expected to result in an increase in the profit share of income. The profit share reached a high point of around 28 per cent in 2008‑09 while the wage share has declined in the last decade (Chart 9).
While the rapid growth in the mining sector has been temporarily interrupted by the impact of the global financial crisis, the mining sector's expansion would be expected to increase the demand for labour in Western Australia and Queensland where mining activity is largely concentrated.
Prior to 2008, this increase primarily presented itself in existing residents increasing their participation and hours worked. Between June 2002 and June 2008, the full‑time equivalent employment to working‑age population ratio increased from around 51 per cent to 55 per cent in Queensland and from around 52 per cent to 57 per cent in Western Australia. These increases are large compared to the rest of Australia, for which the ratio increased from around 49 per cent to 51 per cent over the same period.
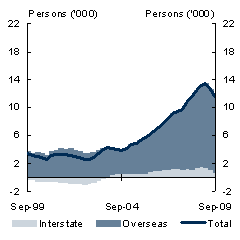
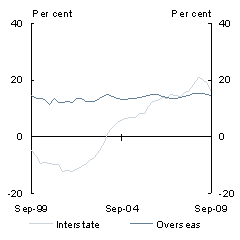
The increased demand for labour has also been reflected in changes in relative wage levels between States (see Statement 2, Chart 11). Workers would be expected to move in response to changes in relative wages and differences in employment rates between regions. Studies have found evidence of labour moving between States in response to state‑specific employment shocks, but with the full adjustment taking up to seven years (Debelle and Vickery 1998; McKissack et al. 2008). During the 2000s, a resource driven change in migration flows between States was evident for Western Australia, reflecting the greater importance of mining for that State's economy (Chart 10).
Chart 10: Migration into Western Australia(a)
Net migration into Western Australia
Share of total migration
- Data are a four‑quarter moving average.
Source: ABS cat. no. 3101.0 and Treasury.
While the mobility of labour between regions is constrained by individuals taking account of the family and social costs of moving (though this could be less relevant for international migrants once they had decided to migrate), constraints can also arise from imposts such as conveyancing stamp duties that increase the financial cost of relocation. The supply responsiveness of other markets, in particular residential housing, is also relevant. In the 2000s, the relative increase in median house prices in Brisbane and Perth may have acted as a brake on migration to those States.
Ensuring income gains from higher terms of trade are distributed appropriately
Australia's mining resource production is concentrated in Western Australia and Queensland, and is of most importance to the Northern Territory and Western Australian economies (Chart 11).
Chart 11: Mining production and value added shares, 2007‑08
Share of total mining production
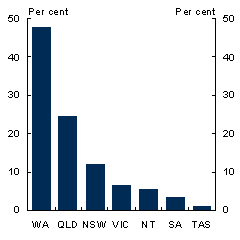
Share of State GVA
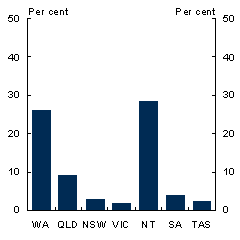
Note: GVA is gross value added at basic prices. The ACT is excluded as there is insignificant mining production.
Source: ABS cat. no. 8155.0, 5220.0 and Treasury.
However, the benefits of mining production are distributed more broadly. Part of the income gains from higher commodity prices accrue to households through their shareholdings in mining companies (directly, or indirectly through superannuation funds). Part of the gains also accrue to government through resource charges or taxes, and where these revenue gains accrue disproportionately to particular State governments, fiscal equalisation arrangements allocate those gains among all State and Territory governments. The overall tax‑transfer system in Australia further acts to spread the gains, as does the reallocation of resources within the economy.
Whether the community in general shares sufficiently in the wealth arising from Australia's natural resource endowments depends critically on whether resource charges or taxes reflect an appropriate price for the right to use or extract those resources. Currently, governments have generally allowed private firms to extract non‑renewable resources in return for a charge, typically per unit of production or percentage of price, regardless of actual production costs. These charges have not kept pace with the increased profitability of Australia's resource deposits.
Over the recent period of rising mineral resource prices the community's share in the increased value of its resources, received through existing resource taxes and royalties, has declined. The effective resource charge has more than halved, from an average of around 34 per cent of resource profits over the first half of the 2000s to less than 14 per cent in 2008‑09 (Commonwealth of Australia 2010a).
A continuing mining boom will test the economy's capacity
The outlook — outlined in Statement 2 — is that the Australian economy is returning to more normal levels of capacity utilisation. A return to full capacity will increase any short‑ to medium‑term stresses from adjusting to the relative strength of the mining and related sectors.
As discussed in Budget Paper No. 1 in the 2008‑09 Budget, changes in the supply of and demand for particular skills in aggregate and within regions are normal features of market economies (Commonwealth of Australia 2008). With flexible and competitive markets, these changes will be reflected in relative wage movements which assist labour markets for those skills, or in particular regions, to eliminate shortfalls over time.
However, even with a flexible labour market, adjustment processes do not always happen quickly, leading to a short‑term shortage for particular skills. For example, workers can take time to respond to the new wage rates, and there may be considerable time lags associated with the movement of labour between States. Long‑lasting skills shortages, however, are an indicator of institutional or other rigidities that impede price signals and adjustment mechanisms.
Infrastructure constraints in some areas have also emerged over the past decade from the sharp increase in world demand for Australia's mineral resources. The long‑lived nature of infrastructure assets makes it inevitable that they will have difficulty coping with an unexpected — or temporary — surge in demand. However, any persistent bottlenecks could suggest the need for a policy response.
Effective policies to expand capacity or address infrastructure bottlenecks should encompass both efficient investment by the private and public sectors and efficient utilisation of existing capacity. Well‑functioning markets with effective price signals are necessary to support such policies.
Implications for the current account deficit
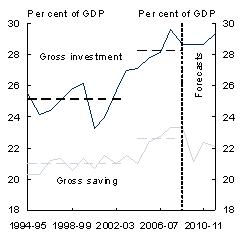
The current account deficit reflects the excess of national investment over national saving, which must be funded from foreign savings. Sustained high mineral resource prices imply a need for high levels of national investment over an extended period (Garton et al. 2010). An increase in national investment would expand the productive capacity of the resource sector, as well as meet housing and infrastructure needs arising from population growth (explained in part by the strength of the resource sector). As saving is unlikely to rise to the same extent, Australia's current account deficit is likely to be relatively high, on average, over an extended period.
Impacts on investment and the current account have been evident since the mining boom began. The current account deficit has averaged 5¼ per cent of GDP since 2004‑05, compared with its average over the preceding 10 years of 4 per cent of GDP (Chart 12). That increase reflects a rise in national investment, which has been about 3¼ per cent of GDP higher than over the preceding 10 years. National saving has been around 1½ per cent of GDP higher, on average, over the same period, funding about half of the increase in national investment.
Chart 12: Gross national saving, investment and current account balance
Saving and investment
Current account balance
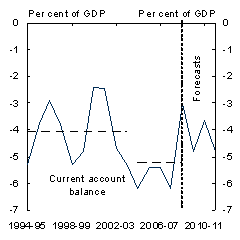
Note: The current account balance may not be equal to saving less investment due to statistical discrepancies. Discrepancies over the forecast period largely reflect the substantial discrepancy in 2008‑09.
Source: ABS cat. no. 5204.0, 5302.0 and Treasury.
The largest contributor to higher national investment has been mining investment, which has risen from around 1¾ per cent of GDP before 2004‑05 to 4¼ per cent of GDP in 2008‑09 (Chart 13). Mining investment as a share of GDP may rise even further: investment in liquefied natural gas projects alone could plausibly increase to around 3 per cent of GDP by 2013‑14. This further rise in investment, together with the assumed easing in commodity prices over the projection period, suggests that the current account deficit might be expected to rise again as a share of GDP after 2011‑12.
Chart 13: Gross fixed capital formation by industry
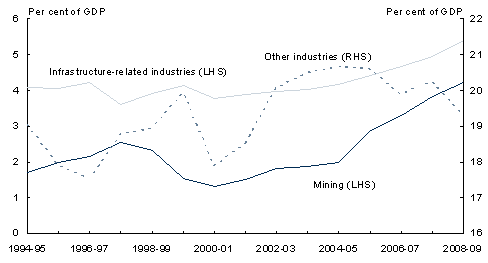
Note: Infrastructure‑related industries are electricity, gas, water and waste services; transport, postal and warehousing; and information media and telecommunications.
Source: ABS cat. no. 5204.0 and Treasury.
High current account deficits do not necessarily indicate a macroeconomic imbalance. Provided the underlying investment and saving decisions are well‑based and not distorted by government policies or over‑exuberant market behaviour, resultant current account deficits would simply reflect a higher level of profitable investment opportunities (IMF 2006b). The fact that Australia's recent high current account deficits reflect increases in mining and infrastructure investment distinguishes us from many other countries where increased deficits over recent years have been driven by either falls in national saving rates or over‑investment in housing associated with house price bubbles (Garton et al. 2010). This increase in investment will raise future productivity and output growth. As long as returns on investment exceed the cost of capital, this will raise Australian incomes (notwithstanding the cost of servicing foreign borrowing).
That said, large current account deficits do expose us to risks in the event of a reversal in capital inflows. The global financial crisis has highlighted the potential for global financial markets to fail and for access to finance to be disrupted. These risks are mitigated by a range of factors (IMF 2006b), including the fact that our deficits are investment‑driven, our healthy fiscal position and flexible exchange rate, extensive hedging of foreign exchange exposures and a robust financial system. However, the potential for external financing to create macroeconomic vulnerability requires ongoing management (see Box 3: Managing the challenges with the current account deficit).
Box 3: Managing the challenges with the current account deficit
Foreign investors' willingness to continue financing large current account deficits over a long period owes substantially to Australia's strong track record in macroeconomic management — in particular, a strong fiscal position — and structural reform. Maintaining fiscal discipline and a continued focus on microeconomic reform will be central to limiting external financing risks. Microeconomic reforms can improve the efficiency of investment and ensure that capital is allocated to its most efficient uses. Providing assurance that borrowing is used for productive purposes, that yield adequate economic returns, promotes confidence that foreign liabilities will be serviced readily.
Boosting national saving so that more of our future investment needs can be financed domestically will also help to reduce current account financing risks. Australia's system of compulsory superannuation savings has contributed significantly to national saving since it commenced in 1992, providing a growing pool of stable financing for investment currently worth $1 trillion. A Tax Plan for Our Future announced measures to build on this successful reform, including an increase in the superannuation guarantee rate from 9 to 12 per cent over time. These measures are expected to boost national saving by a further 0.4 per cent of GDP by 2035 (Commonwealth of Australia 2010b).
The Government's medium‑term fiscal strategy will also help ensure adequate national saving. Achieving surpluses on average over the medium term means that the Australian Government will not be contributing to the current account deficit over time: indeed, surpluses will contribute to financing investment in the rest of the economy.
Financial regulation is another key element in managing risks, as around 70 per cent of Australia's external financing since the mid‑1990s has been intermediated through the financial sector. In the lead‑up to the global financial crisis, inflows of foreign capital into a number of countries helped fuel a build‑up of risk exposures in the financial system. More robust prudential regulation helped keep the Australian financial system largely free of these problems. A challenge will be to ensure that a renewed mining boom does not give rise to imbalances in asset and credit markets.
The quality of financial regulation internationally is also critical in limiting Australia's exposure to external financing risks. During the recent crisis Australian financial institutions were affected by the closure of offshore funds markets, which stemmed from regulatory failures overseas. A key focus of Australia's involvement in the G‑20 is to strengthen global financial regulation. G‑20 Leaders have tasked the Financial Stability Board with developing and implementing new global standards on financial regulation, including stricter capital and liquidity requirements. Another key priority for the G‑20 is the Framework for Strong, Sustainable and Balanced Growth, which aims to secure agreement on policies to promote a sustained global economic recovery without the imbalances that contributed to the global financial crisis. This will help reduce the risk of external shocks that could adversely affect Australia's external financing.
1 None of the conventional national account measures of annual production or income, even net measures that adjust for depreciation of the capital stock, take account of the depletion of non-renewable resources (Stiglitz et al. 2009). However, while estimates of this nature are experimental, the ABS does provide separate estimates of the value of the depletion in subsoil assets (ABS 2010).
2 This is an important implication of the Rybczynski theorem (Rybczynski 1955).
If www.budget.gov.au responds slowly or you are having trouble downloading a document, try one of the Budget Website Mirrors
Note: Where possible, Budget documents are available in HTML and for downloading in Portable Document Format(PDF). If you require further information on any of the tables or charts on this website, please contact The Treasury.