




Statement 5:
Revenue
(Continued)
Outlook for revenue
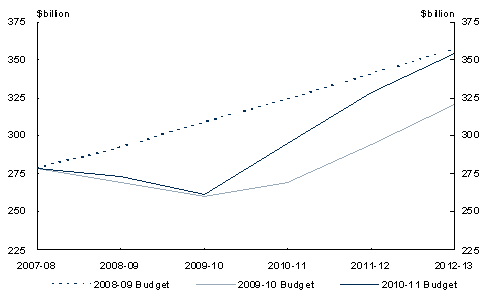
The stronger economic outlook begins to flow into stronger receipts from 2010‑11, and increasingly so in 2011‑12 and later years, as the automatic stabilisers begin to reverse their influence. Indeed, for the same five‑year period (2008‑09 to 2012‑13) which saw downward revisions to taxation receipts of $210 billion in the 2009‑10 Budget, upward revisions over the past year — between the 2009‑10 and 2010‑11 Budgets — have added back around $100 billion (excluding policy decisions), almost entirely in the 2010‑11 to 2012‑13 period (Chart 1). Notably, the recovery in GST receipts accounts for around $16 billion of this.
Chart 1: Revisions to taxation receipts over forward estimates
since the 2008‑09 Budget
Source: Treasury estimates.
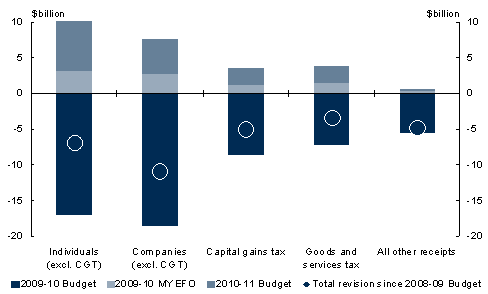
In 2010‑11, receipts have been revised upwards by $17 billion since 2009‑10 MYEFO and by $25 billion since the 2009‑10 Budget, even though they remain around $30 billion (excluding policy decisions) below the 2008‑09 Budget forecasts (Chart 2). As noted, the stronger economic outlook, including a more buoyant labour market and strong commodity prices, is a key factor behind the upward revisions. The current forecasts for 2010‑11 have built in a slightly faster recovery in tax receipts.
Chart 2: Revisions to receipts in 2010‑11 since the 2008‑09 Budget
Source: Treasury estimates.
The improvement in the domestic economy is most evident in stronger‑than‑expected labour market conditions, along with a solid recovery in household wealth reflecting increases in asset prices. The fall in average hours seen in 2009 has begun to unwind, and this can be expected to continue in 2010‑11 and beyond. Consequently, individuals' income taxes and GST are expected to grow significantly from 2010‑11 onwards.
Similarly, the renewed demand for resources has led to an improved outlook for the terms of trade from 2010‑11. As the increase in commodity prices translates into company profits, this is expected to have a positive impact on company tax collections from 2010‑11.
Despite the significantly stronger economic outcomes relative to the 2009‑10 Budget, and the role expected to be played by the stronger economy going forward, there are factors that will continue to exert a dampening effect into 2010‑11 and, in some cases, in 2011‑12 and beyond. In other cases, the improved conditions will take some time to be fully transmitted into revenues.
Company taxation estimates, in particular, will continue to be affected by the delay between income earned and tax paid, by the lags in the company tax instalment system and, finally, by the utilisation of losses incurred during the downturn to offset future profits. These are expected to subdue growth in company tax receipts not just in 2010‑11 but over the entire forward estimates period (Box 3).
Box 2: GST revenue
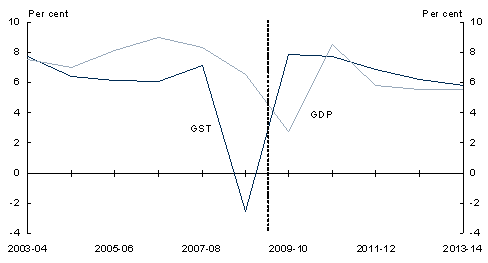
From its introduction in July 2000 up until the global economic recession, GST receipts rose steadily with nominal GDP, adding to the revenue base. This changed during the global financial crisis. As Chart A shows, GST was hit much harder than nominal GDP during the global crisis, but has since bounced back earlier than GDP.
Chart A: Growth in nominal GDP and GST receipts
Source: ABS, Treasury estimates.
In general, the responsiveness of a tax to economic activity hinges on what is included in the tax base. Because consumers use discretionary spending to smooth consumption when income drops dramatically, a GST that has a relatively high discretionary component to its base — such as where basic food and health spending is exempt — will fall further than the base during economic downturns. For similar reasons, however, such a tax base is more likely to generate stronger revenue growth during the recovery.
Capital gains tax is similarly affected by the timing of tax payments and utilisation of losses to offset future profits and its recovery is also expected to be somewhat delayed. The impact of these losses can be expected to be largely dissipated by the end of the forward estimates period.
After reaching a trough in the March quarter 2009, share prices have recovered solidly, resulting in a less severe fall in capital gains tax than was predicted. House prices did not fall very far during the downturn, with the support of the First Home Owners Boost (particularly at the lower end of the market) throughout 2009.
Box 3: Carried‑forward company losses
Company tax losses incurred in a given year can be used to offset profits made in subsequent years. This suppresses company tax collections for several years after the economy recovers from a period of weakness.
Company losses have been increasing since the share market falls of late 2007, and are expected to have peaked during 2009. These will be used to reduce taxable income from 2009‑10. As a company returns to profit, a prior year's loss will appear in tax assessments the following year, but will not affect revenue until the balancing payment is due in the year following the tax assessment year. This delay forms a significant part of the general lag between profits and revenue. For example, losses incurred during the 2008‑09 income year will be recouped in 2009‑10 income year tax returns; these returns are submitted after the end of the income year, so will result in lower company balancing payments during 2010‑11.
Losses recouped by companies since 1978‑79 are shown in Chart A. Because of the few historical precedents for losses behaviour (which are all influenced by the tax systems in place at the time), the exact size and trajectory of the recouped losses over the forward estimates are highly uncertain. Prior‑year losses were recouped very quickly in 1983‑84 due to the prevailing high inflation — this behaviour is not expected to be repeated. Rather, over the forward estimates, company losses recouped are forecast to follow a pattern similar to the protracted losses recoupment of the early 1990s, although the magnitude will be smaller.
Chart A: Prior‑year losses recouped by companies (income‑year basis)(a)
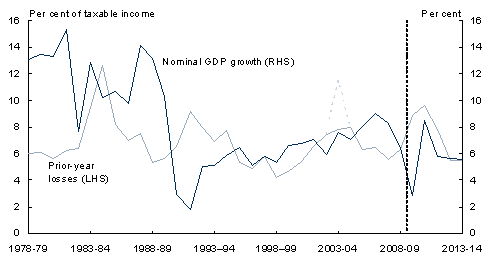
- A significant loss by AMP of $5.5 billion, largely due to its demerger, has been removed in 2003 to better reflect the trend of prior‑year losses recouped over the period. AMP 2003 concise annual report available from http://shareholdercentre.amp.com.au.
Source: ATO Taxation Statistics 2007‑08.
However, the impact on capital gains taxes associated with investment property prices is not expected to be reflected for a number of years as accumulated capital losses accrued during the downturn are used to offset capital gains during the ongoing recovery of asset prices.
With buoyant labour markets, increased household wealth, and a strong terms of trade, and as the temporary effects of losses wash through the system, healthy revenue growth is in prospect in the later years of the forward estimates. This is consistent with, and indeed was explicitly allowed for in, the Government's fiscal strategy, which allows the level of tax receipts to recover naturally as the economy improves.
Despite these promising signs, there are good reasons to keep prospective revenue gains in perspective.
The recent revisions to the economic forecasts have the nominal economy back to levels projected in the 2008‑09 Budget (preceding the global financial crisis) over the forward estimates. In contrast, in addition to the $67 billion in receipts 'lost' in 2008‑09 and 2009‑10, revenues in 2011‑12 will remain somewhat below what had been predicted back in 2008‑09 (Box 4). Therefore, even with the recovery in the economy, which is expected to return to levels forecast in the 2008‑09 Budget during the forward estimates, less than half (or around $100 billion) of the taxation receipts downgrades at the 2009‑10 Budget have been recouped. Similarly, the tax‑to‑GDP ratio is not expected to return to a level around that forecast at the 2008‑09 Budget until 2012‑13 (Chart 3).
Chart 3: Tax‑to‑GDP ratio(a)
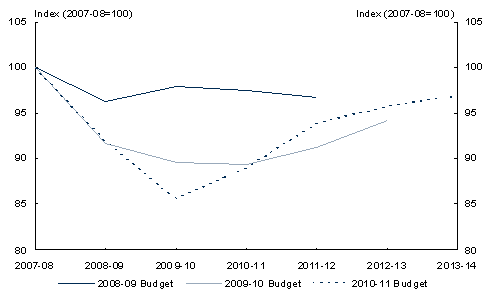
- Conceptual changes to the measurement of GDP in late 2009 makes comparing tax‑to‑GDP ratios since the 2008‑09 Budget problematic. Indexing the ratios partially abstracts from the changes.
Source: Treasury estimates.
Box 4: Revisions to nominal GDP and tax receipts since the 2008‑09 Budget
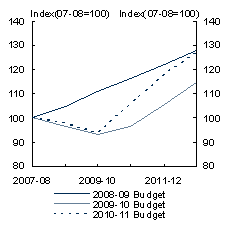
Since the 2008‑09 Budget, significant revisions have been made to the forecasts for both nominal GDP and total tax receipts — between the 2008‑09 and 2009‑10 Budgets, receipts were revised down by $210 billion. The 'automatic stabiliser' properties of the tax system — the progressive personal income tax, and the bases of company and capital gains tax that rely on profits and asset prices that change much faster than GDP over the economic cycle — meant that a larger fall was predicted for receipts than GDP during the downturn.
Although nominal GDP is expected to recover to the levels forecast at the 2008‑09 Budget during the forward estimates (Chart A), receipts are expected to take longer to recover, nearly returning to the levels forecast at the 2008‑09 Budget by 2012‑13 (Chart B). The receipt losses are comparatively greater than the GDP losses due in part to the following factors:
- asset price falls, which are not directly related to GDP, have generated large capital gains tax losses;
- changes to the composition of consumption, from taxed to untaxed components, generated a comparatively large fall in GST revenue;
- changes to the composition of income, from relatively high‑taxed (profits) to low‑taxed (wages), have generated a relatively large fall in income tax revenue; and
- lags in the tax system, which mean that the effects of the downturn are felt for several years afterwards.
Chart A: Nominal GDP revisions
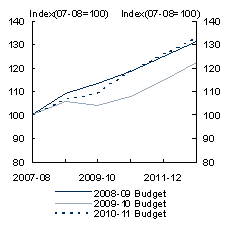
Chart B: Tax receipt revisions
Source: Treasury estimates.
This is partly because of the lags between the recovery in the economy and revenue as explained above, but also because of revenues (such as capital gains tax) that depend on asset prices, which are not necessarily correlated with GDP. Moreover, while past cycles can provide us with guidance on the size and pattern of losses, there remains considerable uncertainty as to how the losses will in fact unfold with the recovery.
And, as always, the outlook for revenue remains inextricably linked with the fortunes of the economy. While the rebound in the terms of trade and stronger prospects in train for the economy portend well, as discussed in Statement 2, there are risks to the economic outlook which could also affect revenue. For example, if concerns about sovereign debt in the euro area undermine the early tentative signs of renewed confidence in global financial markets, this could be reflected both in equity prices and global economic prospects. Such risks from the global economy mean that the Australian economy — and hence taxation revenue — remain vulnerable for some years to come.
If www.budget.gov.au responds slowly or you are having trouble downloading a document, try one of the Budget Website Mirrors
Note: Where possible, Budget documents are available in HTML and for downloading in Portable Document Format(PDF). If you require further information on any of the tables or charts on this website, please contact The Treasury.