




International Development Assistance Budget 2010‑11
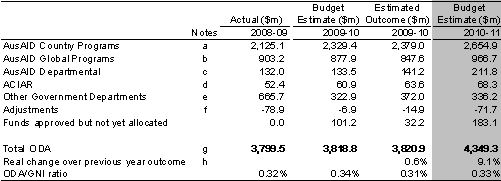
The Government will provide an estimated $4,349 million in total ODA in 2010‑11, of which $3,762 million will be managed by AusAID. This is consistent with the Government's commitment to scaling up ODA to 0.5 per cent of GNI by 2015-16.
Australia's ODA/GNI ratio is forecast to increase to 0.33 per cent in 2010‑11, up from 0.31 per cent in 2009‑10 and the Government expects to increase Australia's ODA to levels equivalent to 0.35 per cent of GNI in 2011‑12, 0.38 per cent of GNI in 2012‑13, and 0.42 per cent of GNI in 2013‑14.
Australia has implemented new international accounting standards used to calculate GNI. The revision increases GNI by around four per cent. The 2009‑10 and the 2010‑11 ODA/GNI ratios are therefore lower than would have been the case under the previous GNI methodology. The changes will also affect historical ODA/GNI ratios. Australia is the first OECD donor country to adopt this new methodology. This makes comparison with other donors difficult.
To provide manageable annual increases in the ODA Budget the Government will not apply previously announced ODA/GNI targets to the higher GNI produced by the new accounting methodology.
Leaving aside the change in GNI methodology, GNI has also increased due to stronger economic growth. This growth has flowed into the ODA Budget contributing to an increase of approximately $530 million when compared with 2009‑10.
Australia's ODA/GNI ratio is forecast to increase to 0.33 per cent in 2010‑11, up from 0.31 per cent in 2009‑10.
Table 1 shows the composition of Australian ODA, including ODA managed by AusAID and other government departments.
Table 1: Composition of Australian ODA
Notes: see page 69.
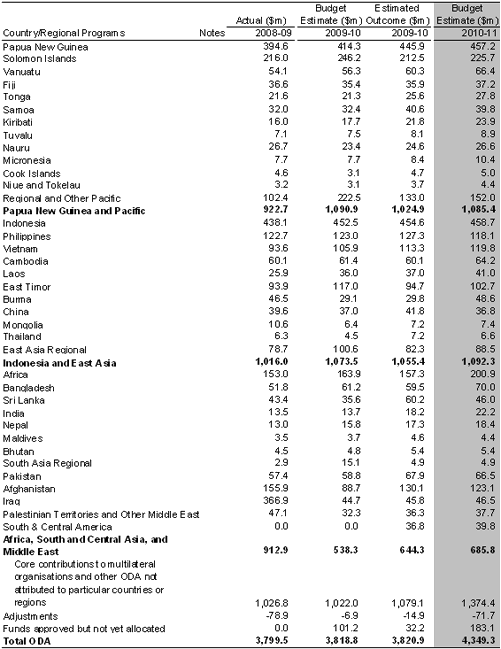
Table 2 shows total Australian ODA from all agencies and programs attributable to partner countries and regions.
Table 2: Australian ODA by partner country and region
Notes: see page 69.
As Australia's ODA increases to 0.5 per cent of GNI by 2015‑16, Australia's aid program will support developing countries achieve the MDGs through basic service delivery. Australian ODA to the education, health, infrastructure and rural development sectors will increase. In 2010‑11, key sectoral shares will increase to education, 19 per cent (see page 7 for details), health, 14 per cent (see page 12 for details), and infrastructure, 14 per cent including transport and water supply and sanitation (see page 20 for details). Diagram 2 illustrates the estimated sectoral breakdown of Australia's development assistance by major sectors for 2010‑11, compared to previous years.
Diagram 2: Estimated breakdown of Australian ODA per sector
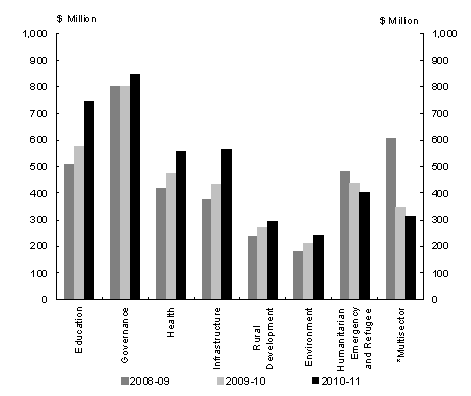
*Multisector includes debt relief. The significant change in Multisector ODA is due to a one-off payment relating to the final tranche of debt relief for Iraq recognised in 2008‑09.
If www.budget.gov.au responds slowly or you are having trouble downloading a document, try one of the Budget Website Mirrors
Note: Where possible, Budget documents are available in HTML and for downloading in Portable Document Format(PDF). If you require further information on any of the tables or charts on this website, please contact The Treasury.