




Detailed domestic forecasts
Australia's real GDP is forecast to grow by 3¼ per cent in 2010‑11 and 3¾ per cent in 2011‑12. The main contributors to economic growth are expected to be business investment, household consumption and commodity exports. Public sector demand is forecast to slow sharply as the fiscal stimulus continues to be withdrawn.
Household consumption is expected to grow above trend in 2010‑11, at 4 per cent, and 3½ per cent in 2011‑12. This reflects solid growth in employment and wages, recent increases in wealth from rising asset prices, and high levels of consumer confidence. Notwithstanding strong growth in consumption, the household saving ratio is expected to remain above levels observed prior to the global financial crisis, consistent with subdued growth in household credit.
Dwelling investment growth forecasts have been revised down, reflecting the recent weakness in housing finance and approvals data. The number of finance commitments for the construction of new dwellings is down nearly 28 per cent through the year, while trend growth in building approvals has fallen in each of the past six months. Nonetheless, the outlook is for dwelling investment to continue growing, consistent with interest rates currently at around neutral levels, a positive employment outlook and a pipeline of construction activity arising from the strength of population growth in recent years. Dwelling investment is expected to grow by 4½ per cent in 2010‑11 and 3 per cent in 2011‑12.
New business investment is expected to increase significantly over the forecast period, returning to around 40-year highs as a proportion of GDP. In the mining sector, rapid growth in profits is supporting strong capital expenditure intentions (Chart 2.2). More broadly, investment intentions have also improved as the outlook for the economy has strengthened. With a large pipeline of investment, the main risks centre around capacity constraints and timing. New engineering construction is expected to grow by a strong 16½ per cent in 2010‑11 and 21 per cent in 2011‑12, underpinned by Liquefied Natural Gas projects. The strength in the mining sector is also expected to drive higher levels of investment in new machinery and equipment, with growth forecast to be 7 per cent in 2010‑11 and 15 per cent in 2011‑12. In contrast, new non-residential building activity is forecast to remain subdued, declining by 2½ per cent in 2010‑11 before growing by 2 per cent in 2011‑12, reflecting high office vacancy rates and the phase‑down of the Building the Education Revolution program.
Chart 2.2: Investment intentions for selected industries
Implied growth rate for 2010‑11
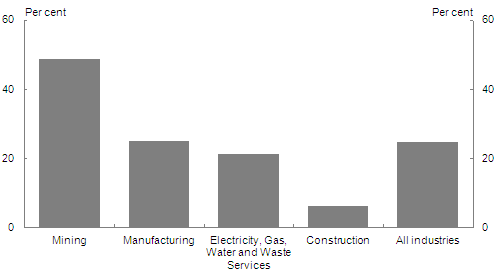
Note: Original data. Implied annual growth rate for 2010‑11 is based on ABS one-year realisation ratios.
Source: ABS cat. no. 5625.0.
Public final demand is forecast to grow 1½ per cent in 2010‑11, before falling by a ¼ of a per cent in 2011‑12 as fiscal stimulus continues to be withdrawn. The withdrawal of fiscal stimulus (which affects not only public final demand, but also household consumption and business investment) is expected to detract around 1 percentage point from GDP growth in 2010‑11 and ½ of a percentage point from GDP growth in 2011‑12.
Export growth forecasts have been upgraded for 2010‑11, reflecting an improved outlook for both rural and non‑rural commodity exports. Favourable weather conditions in eastern Australia are currently expected to support a large wheat crop. For non-rural commodity exports, strong growth is being driven by expanding mining production and port capacity in response to strong demand from Asia and high international prices. Partially offsetting this strength, forecast growth in exports of services and manufactured goods has been reduced, largely due to the higher exchange rate. Total exports are forecast to grow by a solid 7 per cent in 2010‑11 and by 5 per cent in 2011‑12.
Import growth forecasts have been upgraded for 2010‑11, reflecting stronger domestic demand and a higher Australian dollar. Imports are expected to grow by 11 per cent in 2010‑11 and by 8 per cent in 2011‑12. The growth in imports is expected to be broadly based, although the contribution of capital goods imports — driven by the capital expenditure on major mining projects — is expected to be substantial. Net exports are expected to detract 1 percentage point from real GDP growth in 2010‑11 and ¾ of a percentage point in 2011‑12.
The terms of trade are forecast to rise by 15½ per cent in 2010‑11, underpinned by high prices for Australia's non‑rural bulk commodity exports. Record levels of steel production in China earlier in the year led to historically high iron ore contract prices for the September quarter 2010. December quarter contract prices, while lower, also remain well above historical levels. The terms of trade are expected to decline by 4½ per cent in 2011‑12, as significant increases in global mining capacity place downward pressure on non-rural commodity prices.
The current account deficit is forecast to narrow in 2010‑11 and then expand in 2011‑12 in line with the rise and subsequent decline in the terms of trade. The current account deficit is expected to be 2¾ per cent of GDP in 2010‑11 and 4¼ per cent of GDP in 2011‑12. The net income deficit is expected to widen over the forecast period, as improved export earnings generate increased equity income outflows.
The unemployment rate is expected to continue to fall, reaching 4¾ per cent by the end of 2010‑11 and 4½ per cent by the end of 2011‑12. Employment is expected to grow by 2½ per cent through the year to the June quarter 2011 and 2 per cent through the year to the June quarter 2012, consistent with the strong outlook for activity.
Wages growth is expected to pick up, driven by the ongoing tightening of the labour market. The Wage Price Index is expected to grow by 3¾ per cent through the year to the June quarter 2011 and 4 per cent through the year to the June quarter 2012.
Inflation is also expected to rise over the forecast horizon, reflecting the strength in domestic demand, a buoyant labour market and anticipated increases in administered prices. Underlying and headline measures of inflation are expected to be 2¾ per cent through the year to the June quarter 2011 and 3 per cent through the year to the June quarter 2012.
Nominal GDP is forecast to grow by 9 per cent in 2010‑11, reflecting strong growth in the GDP deflator of 5½ per cent, largely driven by the higher terms of trade. Nominal GDP is forecast to grow by 5 per cent in 2011‑12.
Medium-term economic projections
The fiscal aggregates in the MYEFO are underpinned by a set of forward estimates consisting of short-term economic forecasts and projections based on medium-term assumptions.
The 2010‑11 MYEFO forecasts imply that the economy will return to full capacity within the forecast period. The unemployment rate is expected to have peaked at 5.8 per cent during 2009, before continuing to trend down over the forecast period to reach 4½ per cent in late 2011‑12.
With the economy expected to be back to potential during the forecast period, real GDP is projected to grow at its trend rate of around 3 per cent per annum over the two projection years of the forward estimates (Chart 2.3).
Chart 2.3: Real GDP growth over the forward estimates period
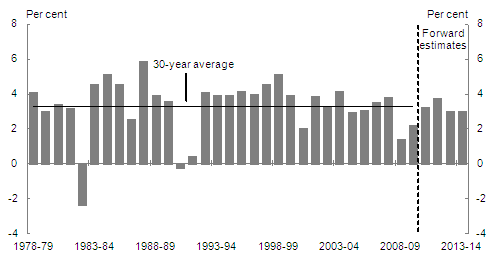
Source: ABS cat. no. 5204.0 and Treasury.
Beyond the forward estimates, trend GDP continues to grow at around 3 per cent until 2018-19 when growth slows to around 2¾ per cent as population ageing generates a gradually falling participation rate.
In the medium term, the unemployment rate is expected to be 5 per cent, in line with current estimates of the NAIRU.1 Inflation is projected to be 2½ per cent, consistent with the Reserve Bank of Australia's medium-term target band.
In the projection period the terms of trade are projected to decline by a total of around 20 per cent over a 15-year period, settling just above their 2005‑06 level. This reflects an expectation that current levels of commodity prices will not be sustained in the longer term, as increases in supply bring down prices over time.
The exchange rate is assumed to remain constant at its current level over the medium term. However, if the projected decline in commodity prices and the terms of trade were realised, it is likely that the exchange rate would fall, moderating the decline in Australian dollar prices and earnings.
1 In Australia, estimates of the NAIRU are around 5 per cent, with recent Treasury estimates ranging between 4½ and 5 per cent. Treasury's estimates of the NAIRU are based on a methodology detailed in Gruen, Pagan and Thompson (1999), 'The Phillips curve in Australia', The Journal of Monetary Economics, and updated in Kennedy and Goldbloom (2008), 'Examining full employment in Australia using the Phillips and Beveridge curves', The Australian Economic Review.
If www.budget.gov.au responds slowly or you are having trouble downloading a document, try one of the Budget Website Mirrors
Note: Where possible, Budget documents are available in HTML and for downloading in Portable Document Format(PDF). If you require further information on any of the tables or charts on this website, please contact The Treasury.