




Statement 5: Revenue (Continued)
Overview
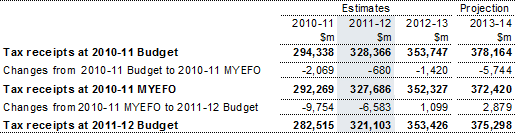
Total tax receipts have been revised down by $9.8 billion in 2010‑11 and $6.6 billion in 2011‑12 relative to the Mid‑Year Economic and Fiscal Outlook 2010‑11 (MYEFO). The $16.3 billion write downs in tax receipts over these two years more than account for the total downward revisions in tax receipts of $12.4 billion over the four years from 2010‑11 to 2013‑14. Table 1 reconciles this Budget's tax receipts estimates with those at the 2010‑11 Budget and the 2010‑11 MYEFO.
The significant revisions in tax receipts in 2010‑11 and 2011‑12 reflect an economy buffeted in the short term by the natural disasters in early 2011, a strong dollar and the legacy of the global financial crisis. That legacy is seen clearly in the emergence of a more 'cautious consumer' and subdued household demand. It is also evident in the larger‑than‑anticipated losses accumulated during the global financial crisis.
The outlook for tax receipts improves from 2012‑13, on the back of a projected recovery in the economy buoyed by stronger terms of trade, and assisted by policy measures. Despite a lower starting point, tax receipts are projected to remain at levels broadly similar to those in the 2010‑11 MYEFO.
The recovery in tax receipts within the forward estimates period is, however, more moderate than might be suggested by the strong terms of trade and the resurgent resources boom. This reflects both significant depreciation expenses associated with strong investment in the mining sector, and conditions remaining challenging in those sectors not benefitting from the resources boom. Continued caution on the part of consumer, a strong dollar and losses associated with the financial crisis work also to dampen tax receipts over the remainder of the forward estimates period.
Table 1: Reconciliation of Australian Government general government taxation
receipts estimates from the 2010‑11 Budget
The weaker outlook for tax receipts in the near term means that the tax‑to‑GDP ratio is expected to be slightly lower than levels projected in the 2010‑11 Budget (Chart 1). The outlook now is for a relatively slower, more extended recovery in tax receipts relative to GDP. Nonetheless, by 2012‑13, tax receipts as a share of GDP are broadly in line with expectations at the time of the 2010‑11 Budget.
Chart 1: Tax‑to‑GDP ratio
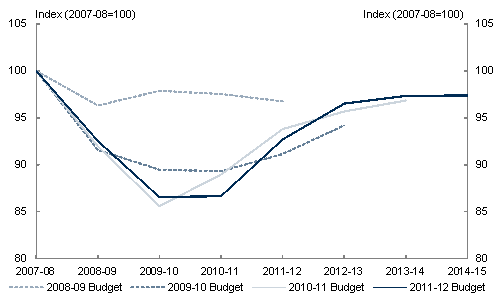
Source: Treasury estimates.
Total receipts (that is, tax receipts and non‑tax receipts) have been revised down in 2010‑11 and 2011‑12 but have been revised up since 2010‑11 MYEFO in the latter part of the forward estimates.
Table 2 provides a summary of receipts estimates and projections.
Table 2: Australian Government general government receipts
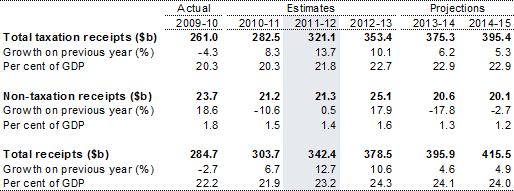
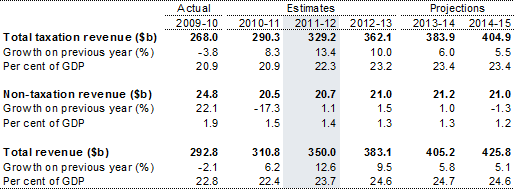
Receipts estimates are measured on a cash basis while revenue estimates refer to accrual based estimates. See Appendix E for further detail regarding the differences between cash and accrual concepts.
Table 3 provides a summary of revenue estimates and projections.
Table 3: Australian Government general government revenue
If www.budget.gov.au responds slowly or you are having trouble downloading a document, try one of the Budget Website Mirrors
Note: Where possible, Budget documents are available in HTML and for downloading in Portable Document Format(PDF). If you require further information on any of the tables or charts on this website, please contact The Treasury.