




Statement 5: Revenue (Continued)
Weaker tax receipts in the near term
The outlook for tax receipts has been significantly revised down in the near term, with 2010‑11 and 2011‑12 being the most significantly affected, and revisions forecast across all key revenue heads. In total, tax receipts have been revised down since MYEFO by $16.3 billion in 2010‑11 and 2011‑12, reflecting a $9.8 billion downward revision in 2010‑11 and $6.6 billion downward revision in 2011‑12.
The downward revisions in 2010‑11 and 2011‑12 reflect:
- more subdued short term economic conditions with growth in 2010‑11 impacted by natural disasters, more cautious behaviour on the part of consumers, and a strong dollar; and
- larger than anticipated losses accumulated during the financial crisis.
Subdued economic conditions
Natural disasters, more subdued household demand and a strong exchange rate have all contributed to lower forecasts of real GDP growth and nominal incomes in 2010‑11. The one percentage point downward revision to nominal GDP in that year lowers tax receipts in 2010‑11 and, given lags in the tax system, continues to impact in 2011‑12.
As the downward revision to forecast economic growth in 2010‑11 is predominantly in corporate profits and consumption, there are consequent downward revisions to consumption taxes, mainly GST receipts, as well as company taxes over both 2010‑11 and 2011‑12. Recent softness in aggregate wages is similarly reflected in lower individuals' income tax withholding receipts over both 2010‑11 and 2011‑12.
Domestic natural disasters in early 2011 are, on their own, estimated to reduce tax receipts by broadly around $1¾ billion, with the impact felt predominantly in 2010‑11 and 2011‑12, and a broad range of revenue heads likely to be affected (see Box 1).
The significant downward revisions to household consumption expenditure is expected to primarily affect GST receipts and other consumption based taxes such as excise and customs duty. In total, these have been revised down by $1.1 billion in 2010‑11 and $1.3 billion in 2011‑12. There is increasing evidence to suggest that there has been a fundamental shift by households to consolidate their household balance sheets in the wake of the global financial crisis while, at the same time, there has been a general tightening in financial conditions in the aftermath of the crisis.
The exchange rate has been strengthening over most of 2010‑11. The 2011‑12 Budget assumption of US$1.07 per Australian dollar is significantly higher than either the 2010‑11 MYEFO assumption or 2010‑11 Budget assumption. The stronger Australian dollar works to dampen corporate profits in both the mining and non‑mining sectors, and boost consumption of imports. Overall, a stronger exchange rate tends to lead to lower company taxes, and somewhat higher consumption taxes, with the overall impact detracting from total tax receipts.
Continuing legacy of the global financial crisis
From the onset of the global financial crisis it had been anticipated that the crisis would hit tax receipts hardest in 2010‑11, with a still significant effect continuing in 2011‑12. Between the 2008‑09 and 2009‑10 Budgets, tax receipts for 2010‑11 were initially revised down by $54 billion, with a further $45 billion revision to 2011‑12 tax receipts.
Although, in subsequent updates, this estimate was revised upwards given a faster than anticipated economic recovery, the magnitude of the anticipated loss of tax receipts in these years remained large, reflecting the pattern of expected loss utilisation. Together with the latest revisions to tax receipts, total tax receipt write‑downs in 2010‑11 since the 2008‑09 Budget are still expected to be around $40 billion, or $14 billion less than was initially expected. For 2011‑12, tax receipts remain around $15 billion lower than at the 2008‑09 Budget.
Box 1: Natural disasters hinder receipts
The significant reduction in economic activity and incomes associated with natural disasters, such as Cyclone Yasi and the flooding in eastern Australia, are expected to have a significant adverse impact on tax receipts.
The Australian natural disasters are expected to result in around $9 billion in lost real output, and subtract around ½ of a percentage point from real GDP in 2010‑11, with the major impact falling on the mining and agricultural sectors. Coupled with the output loss associated with disasters outside Australia, most notably that in Japan, the estimated impact of these recent natural disasters is expected to reduce real GDP by ¾ of a percentage point (see Box 2, Statement 2).
The cyclone and floods have disrupted coal production in Queensland due to the flooding of a number of coal mines, while floods have destroyed many crops in Queensland and Victoria. Losses within the mining and agricultural sectors will reduce current and future income tax receipts. Indeed, more generally, the losses incurred by businesses can have a significant impact on revenue over the medium to long term as they are available to be claimed as deductions against income earned in future financial years.
This reduction in economic activity and incomes impacts on a broad range of tax receipts. The disruption to economic activity and destruction of fixed capital (including buildings and equipment) will be reflected in reduced profits and hence lower company taxes and personal taxes. There may also be a temporary increase in unemployment in affected regions, lowering individuals' income taxes. In the immediate period following a natural disaster, consumption (particularly discretionary consumption) is reduced, affecting indirect taxes such as GST and excise duties. The lower consumption can also be expected to adversely affect business profits and hence further reduce company taxes.
Overall, the production losses associated with recent natural disasters are estimated to reduce tax receipts by an estimated $1¾ billion across the forward estimates, with the impact falling almost entirely in 2010‑11 and 2011‑12. However, losses remain in the system for some years.
The need to replace buildings, rebuild plant and equipment, and consumers replacing their stocks of damaged goods are likely to see a boost to economic activity over the next few years, with some associated recovery in tax receipts.
There is increasing evidence that the effects of the subdued economy on receipts have been exacerbated by what are now seen to be larger than previously anticipated losses incurred during the global financial crisis.
In the 2010‑11 Budget, it was observed that while past economic cycles provided some indication of loss utilisation as the economy recovers, the relative depth and extent of the global financial crisis — and how it would impact on the Australian economy —made this comparison particularly difficult (Budget Statement 5, Budget Paper 1, 2010‑11).
With the benefit of further information, it has become clearer that the extent of capital losses incurred during the crisis is significantly larger than was anticipated previously (Box 2). Indeed, the stock of capital losses in 2008‑09 is estimated to have climbed to over 20 per cent of GDP, or more than double 2007‑08 levels.
The utilisation of these losses as well as operating losses has driven significant downward revisions to receipts since 2010‑11 MYEFO, primarily in company tax and other individuals' tax receipts.
The larger quantum of losses means that it will take longer to recoup those losses. Loss utilisation can also be expected to be drawn out over a longer period given the weaker recovery in profits and growth in 2010‑11.
While not felt as strongly as in 2010‑11, it is anticipated that these losses will continue to exert a larger and more significant influence in 2011‑12 on company tax receipts, and capital gains tax receipts more broadly, than had previously been anticipated, and continue to impact on receipts for some years after that.
With the share market still well below its pre‑crisis peak, and the housing market remaining sluggish, wealth has been slow to recover. To put it in perspective, at the 2008‑09 Budget, the ASX200 was around 5600 points. Had the share market risen at its historical average, it would be around 7000 now—rather than its current level of less than 5000 points. Meanwhile gains from the property market have also been subdued. This further exacerbates the weakness in capital gains tax receipts.
The past losses and slow recovery in wealth are suggestive of capital gains tax receipts not returning to pre‑crisis levels for some years. Capital gains tax is expected to be $3.2 billion lower in 2010‑11, and $3.0 billion lower in 2011‑12, than anticipated at 2010‑11 MYEFO.
Box 2: Capital Gains Tax
The rapid deterioration of financial asset values during the global financial crisis has had a pronounced effect on CGT receipts, which is compounded by the subdued recovery in wealth.
Net capital gains were $30 billion for 2008‑09, which is $60 billion lower than for 2007‑08. The stock of capital losses more than doubled from $104 billion in 2007‑08 (8.8 per cent of GDP) to $260 billion in 2008‑09 (20.8 per cent of GDP), the latest year for which data are available (Chart A). The stock of losses was also around double the average over the period 2000‑01 to 2007‑08.
Chart A. Stock of capital losses as share of GDP
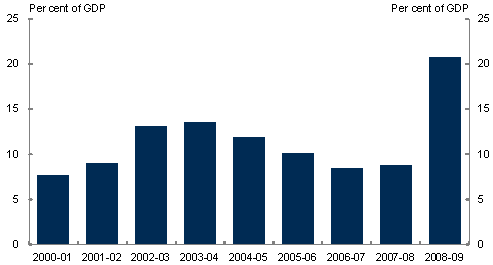
Source: 2008‑09 Taxation Statistics, Australian Taxation Office.
The full impact of these losses on future CGT receipts depends on when the stock of accumulated losses is claimed against future gains. Although it is difficult to gauge from history how quickly these losses will be used, two factors suggest continued softness in CGT receipts.
Firstly, features of the tax system (such as CGT only being levelled on realised gains) mean that, like company tax, CGT is partly paid in the years after capital income is earned. A major proportion of capital gains earned during the 2009‑10 and 2010‑11 income years will be offset by the utilisation of the large stock of losses. This results in a more subdued outlook for CGT receipts in 2010‑11 and 2011‑12, despite the recovery in other forms of revenue.
Secondly, history shows that existing losses in the system take a considerable time to be run down. For example, there was only a modest draw down of losses between the 2003‑04 and 2006‑07 income years — a period of strong asset price growth. This suggests a much longer period of strong asset price growth will be needed to draw down the large 2008‑09 stock of losses.
Taken together, the weaker economic conditions in 2010‑11, and larger than anticipated losses incurred during the global financial crisis, have led to downward revisions to 2010‑11 company tax receipts since MYEFO of around $5.3 billion. Notably, a significant part of the 2010‑11 weakness relates to weaker than expected company tax payments in respect of the 2009‑10 year and the natural disasters in the latter half of 2010‑11, though a softer outlook for capital gains in 2010‑11 is also a factor. In 2011‑12, company taxes have been revised down by a further $2.6 billion.
Individuals' income taxes have been revised down since MYEFO by $2.7 billion in 2010‑11 and $2.8 billion in 2011‑12, reflecting both recent weakness in aggregate wages associated with the weaker economic growth in 2010‑11, as well as lower than anticipated capital gains.
The global financial crisis had the biggest impact on taxes from profits, capital gains and consumption (Box 1, Budget Statement 5, Budget Paper 1, 2010‑11) and it is these taxes that still remain below their pre‑crisis levels. In contrast, taxes on wages are expected to recover to their pre‑crisis forecasts in 2010‑11.
If www.budget.gov.au responds slowly or you are having trouble downloading a document, try one of the Budget Website Mirrors
Note: Where possible, Budget documents are available in HTML and for downloading in Portable Document Format(PDF). If you require further information on any of the tables or charts on this website, please contact The Treasury.