




Statement 5: Revenue (Continued)
Longer term recovery in tax receipts
From 2012‑13, tax receipts are expected to recover from the weakness characterising 2010‑11 and 2011‑12. Indeed, the pickup in tax receipts is expected to be slightly stronger in 2012‑13 and 2013‑14 than anticipated at 2010‑11 MYEFO. In level terms, however, given the lower starting base, tax receipts in 2012‑13 and 2013‑14 remain broadly in line with those projected at the time of the 2010‑11 MYEFO.
The stronger outlook for the terms of trade associated with the current mining boom that buoys the economic outlook over the next few years, is expected to flow through to higher nominal incomes and employment from 2011‑12, which in turn should provide some boost to income taxes from 2012‑13. The improvement in the terms of trade also boosts the incomes received from commodity exports, which are expected to be reflected in a stronger outlook for resource rent taxes.
That said, substantial capital investment in the mining sector, softer prospects in sectors not directly benefitting from the resources boom, the strong dollar and consumer caution, along with loss utilisation will all work to moderate tax receipts over the forward estimates.
Mining boom mark II
It is not anticipated that the strong surge in tax receipts experienced under mining boom mark I (mid‑2000s before the global financial crisis) will be replicated under mining boom mark II (currently in prospect). Abstracting from policy decisions, tax receipts are estimated to have grown by around 11 per cent per year during mining boom mark I. By comparison, tax receipts (excluding policy) are estimated to grow at rates that are around a third less than this between 2012‑13 and 2014‑15.
The anticipated surge in mining investment, coupled with conditions remaining challenging in sectors not benefitting from the resources boom, and continued subdued household demand, all point to a more tempered outlook for receipts under the mining boom mark II relative to the earlier boom.
Anticipated surge in mining investment
A key difference relates to capital expenditure by the mining sector over coming years. Even allowing for the fact that the mining sector tends to be highly capital intensive in general, the current mining boom looks set to be associated with a substantially stronger increase in investment compared with the earlier mining boom. During mining boom mark I, mining investment as a share of GDP increased from 1 per cent to 3 per cent. During the current boom mining investment is forecast to rise to 6 per cent of GDP in 2011‑12.
While this is in itself not surprising, as the current mining boom is occurring at a time when the terms of trade have already been at record highs for a number of years, along with this rapidly growing capital base come significantly rising tax deductions, which work to reduce the company taxes payable. Over the longer term, as the associated production comes on line (and depending on commodity prices prevailing at the time), one would expect to see higher tax receipts from the mining sector.
Box 3 provides further detail comparing the mining boom of the mid‑2000s with the current mining boom.
The multi‑speed economy
Another key difference explaining the softer receipts outlook in prospect in mining boom mark II relative to the earlier boom is an apparent divergence of fortunes between the mining sector and sectors of the economy not benefiting directly from the resources boom.
Box 3: Company tax and a surge in mining investment
The mining boom in the mid‑2000s saw a surge in mining profits and tax receipts. After the global financial crisis, the terms of trade is rising again, as are profits in the mining sector (Box 4, Statement 2). However, differences between the earlier mining boom and the mining boom in prospect suggest that there is unlikely to be an accompanying surge in company tax receipts for some years.
In 2003‑04, mining gross operating surplus (GOS) was around 15 per cent of total private corporate GOS. It is presently around a third. That is, the mining sector now accounts for a larger share of the company tax base.
However, the mining sector is highly capital intensive, and hence tends to have a larger capital stock available for depreciation deductions. Over the decade to 2008‑09, the mining sector accounted for over 20 per cent of total corporate GOS, but only around 10 per cent of company tax receipts. A rising share of the capital intensive mining sector, with relatively larger deductions, is therefore expected to have a dampening effect on growth in company tax receipts relative to growth in corporate profitability.
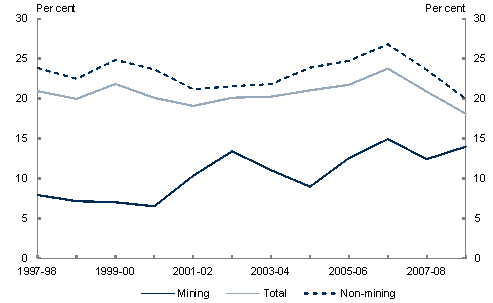
As a result of the surge in mining profits, the overall ratio of company tax to private corporate GOS fell from 20.3 per cent in 2003‑04 to 18.1 per cent in 2008‑09 (Chart A). Given the mining sector's currently larger share of GOS, it is reasonable to anticipate the current mining boom will be associated with an even larger decline in this ratio.
Chart A: Ratio of company tax to corporate GOS — Mining versus non‑mining
Source: ABS, ATO, Treasury estimates.
However, there is another, even more, important factor. While mining investment did increase during the boom of the last decade, the increase in mining GOS was not accompanied by a commensurate increase in the capital stock. By contrast, the current mining boom is expected to be associated with a substantial increase in investment by the mining sector. There is a massive pipeline of investment that is expected from the mining sector over the forecast period (Box 4, Statement 2) such that mining investment intentions for the next year are outstripping private business investment plans for the rest of the economy.
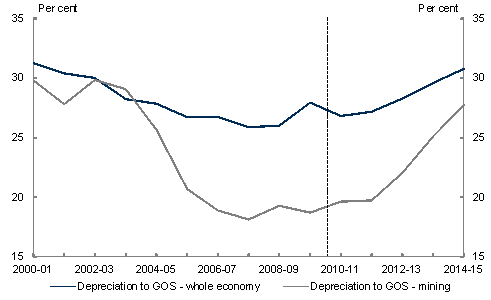
This implies that the re‑emergence of the boom over the forward estimates is projected to be accompanied by a significant increase in the capital stock. This increase, which underpins higher levels of deprecation expenses, means that depreciation is projected to grow faster than GOS for the whole economy across the forward estimates. Depreciation expenses relative to GOS are projected to increase even faster in the mining sector than the economy as a whole (Chart B).
Chart B: Depreciation expenses as proportion of corporate GOS — mining
versus whole economy
Source: ABS, Treasury estimates.
Higher levels of depreciation expenses mean that the levels of taxable income, and thus company tax receipts, are lower than would have been the case otherwise.
The improvements in the medium term economic outlook since MYEFO driven by stronger capital investment (and higher associated levels of depreciation expenses) in the mining sector, are therefore expected to be accompanied by a relatively more subdued outlook for company tax receipts.
The strong Australian dollar (the Budget assumes an exchange rate of US$1.07 per Australian dollar compared with an average of US$0.78 during the boom of the mid‑2000s), continued subdued household consumption and the legacy of the global financial crisis are all expected to dampen tax receipts from sectors not directly benefitting from the resources boom. While corporate profits outside the resources sector grew solidly during mining boom mark I (at around 9 per cent per year), they have been weak in the early stages of the current one. Indeed, over 2010, mining profits grew by around 60 per cent while non‑mining profits fell slightly.
The utilisation of losses associated with the global financial crisis is also expected to impact on tax receipts over the entire forward estimates period.
Nonetheless, along with the strong outlook for economic growth, the prospects for solid employment growth and stronger wages over the forecast horizon, as well as revenue savings measures, mean that individual withholding taxes are expected to be above their earlier forecast levels from 2012‑13. This is, however, somewhat offset by weaker capital gains.
A still cautious consumer
Despite the re‑emergence of the mining boom and the associated rise in incomes, the cautious approach to consumption adopted by households in recent years (and reflected in forecasts of lower GST receipts in 2010‑11 and 2011‑12) translates to lower expected household consumption over the remainder of the forward estimates period. In total, GST receipts have been revised down by $5.7 billion over the budget and forward estimates since MYEFO.
Further exacerbating the weakness in GST are signs of a long term trend decline in the share on consumer spending on goods and services subject to GST (Box 4). That is, consumers appear to be directing relatively more of their total consumer spending on GST‑free goods and services. This, in turn, appears to reflect relatively higher price increases in goods and services not subject to GST.
Box 4: GST
Over recent years, there has been a discernible decline in GST revenues as a share of nominal GDP. This reflects the confluence of a number of factors.
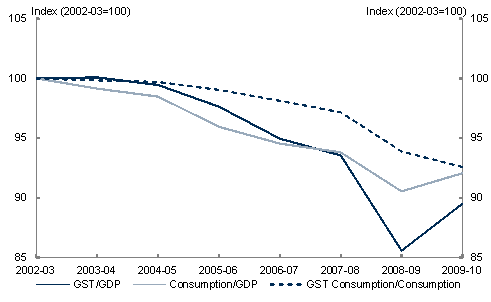
An important factor is the decline in consumption as a share of GDP. As Chart A indicates, consumption steadily declined as a share of GDP over most of the 2000s. This is heavily influenced by increased household savings associated with the 'cautious consumer' and the consolidation of household balance sheets.
There has also been a steady decline in the expenditure on items attracting GST as a share of total consumption (also in Chart A). This effect is partly cyclical — during downturns, households tend to allocate a greater proportion of their income towards GST‑free goods and services, and spend less on goods and services that attract GST.
Chart A: Decline in GST as share of GDP
*This chart has been corrected since originally published on 10 May 2011.
Source: ABS, Treasury estimates.
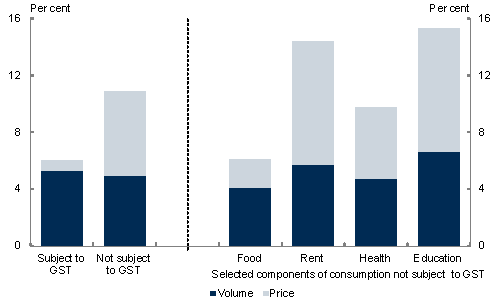
However, there are other factors at work. Chart B breaks down growth in consumption expenditure on goods and services that attract GST and those that do not, by volume and price components for the two years ending December 2010. While volumes of goods both subject and not subject to GST have grown at a similar pace, there are significant variations in prices. Prices of goods not subject to GST increased markedly over this period while prices of goods subject to GST rose only modestly. The price increases were most significant in areas such as rental services, health and education. As these areas are largely non‑tradeable, they are unlikely to have benefitted from factors such as a stronger Australian dollar.
Chart B: Growth in expenditure on GST versus GST‑free goods and services
(Dec 2008 to Dec 2010)
Source: ABS, Treasury estimates.
If www.budget.gov.au responds slowly or you are having trouble downloading a document, try one of the Budget Website Mirrors
Note: Where possible, Budget documents are available in HTML and for downloading in Portable Document Format(PDF). If you require further information on any of the tables or charts on this website, please contact The Treasury.