




Statement 5: Revenue (Continued)
Appendix C: Revenue and receipts history and forecasts
Table C1: Australian Government (accrual) revenue
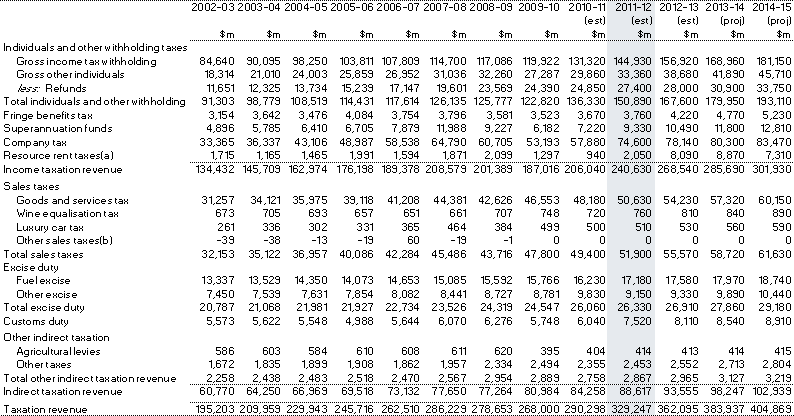
Table C1: Australian Government (accrual) revenue (continued)

- Resource rent taxes include PRRT and gross revenue from the MRRT. The net revenue from the MRRT is $3.7 billion in 2012‑13, $4.0 billion in 2013‑14 and $3.4 billion in 2014‑15, which represents the net impact on revenue across several different revenue heads. This includes the offsetting reductions in company tax (through deductibility) and interactions with other taxes.
- 'Other sales taxes' includes Wholesale Sales Tax prior to 2000‑01, when it was abolished as part of the changes under A New Tax System.
Table C2: Major categories of (accrual) revenue as proportion of gross domestic product
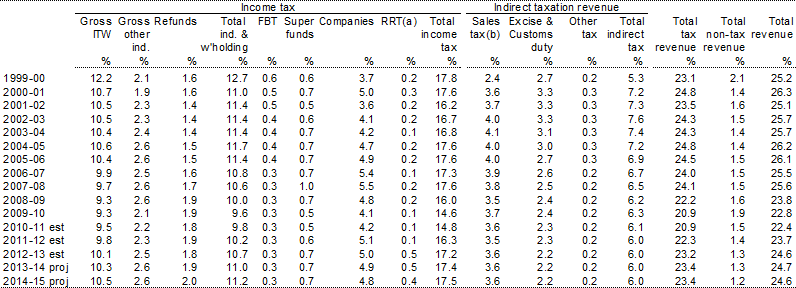
- Resource rent taxes (RRT) include PRRT and gross revenue from the MRRT. The net revenue from the MRRT is $3.7 billion in 2012‑13, $4.0 billion in 2013‑14 and $3.4 billion in 2014‑15, which represents the net impact on revenue across several different revenue heads. This includes the offsetting reductions in company tax (through deductibility) and interactions with other taxes.
- 'Other sales taxes' includes Wholesale Sales Tax prior to 2000‑01, when it was abolished as part of the changes under A New Tax System.
Table C3: Australian government (cash) receipts
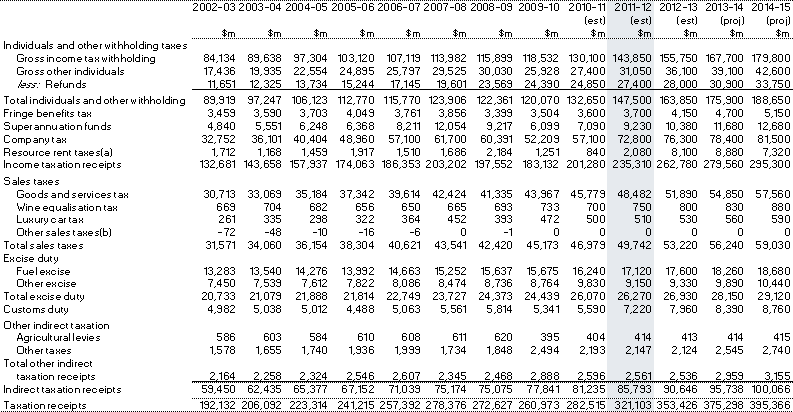
Table C3: Australian government (cash) receipts (continued)

- Resource rent taxes include PRRT and gross receipts from the MRRT. The net receipts from the MRRT are $3.7 billion in 2012‑13, $4.0 billion in 2013‑14 and $3.4 billion in 2014‑15, which represents the net impact on receipts across several different revenue heads. This includes the offsetting reductions in company tax (through deductibility) and interactions with other taxes.
- 'Other sales taxes' includes Wholesale Sales Tax prior to 2000‑01, when it was abolished as part of the changes under A New Tax System.
Table C4: Major categories of (cash) receipts as proportion of gross domestic product
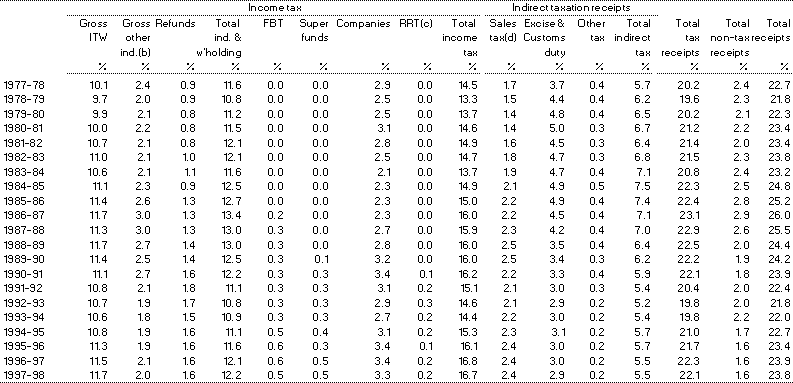
Table C4: Major categories of (cash) receipts as proportion of gross domestic product(a) (continued)
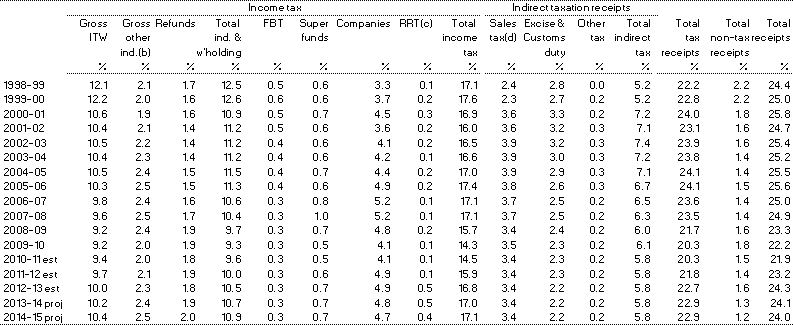
- Figures in 1998‑99 are based on the old Commonwealth Budget Sector cash accounting framework. Figures from 1999‑2000 are on an Australian Government general government GFS basis.
- Gross other individuals includes amounts previously collected under the Prescribed Payments System and Reportable Payments System between 1983‑84 and 1999‑00.
- Resource rent taxes (RRT) include PRRT and gross receipts from the MRRT. The net receipts from the MRRT are $3.7 billion in 2012‑13, $4.0 billion in 2013‑14 and $3.4 billion in 2014‑15, which represents the net impact on receipts across several different revenue heads. This includes the offsetting reductions in company tax (through deductibility) and interactions with other taxes.
- Sales taxes include wholesale sales tax which was abolished in 2000‑01.
If www.budget.gov.au responds slowly or you are having trouble downloading a document, try one of the Budget Website Mirrors
Note: Where possible, Budget documents are available in HTML and for downloading in Portable Document Format(PDF). If you require further information on any of the tables or charts on this website, please contact The Treasury.