




Statement 5: Revenue (Continued)
Appendix D: Forecast methodology and performance
The Government's revenue estimates are prepared using a 'base plus growth' methodology. The last known outcome (2009‑10 for the 2011‑12 Budget) is used as the base to which estimated growth rates are applied, resulting in revenue estimates for the current and future years. The growth rates are determined from forecasts for a large range of economic data, many of which are described in Statement 2.
The smaller and relatively simple heads of revenue, such as luxury car tax and many of the excises, are forecast by mapping an appropriate economic parameter growth rate forecast directly to the tax growth rate. Most of the large and complex heads of revenue, such as personal and company income taxes, are forecast by mapping appropriate economic parameter growth rates to the various income, expense and deduction items on the relevant tax returns. An estimate of total tax payable is then calculated by applying the statutory rates to the estimated income base. Timing models based on past payment behaviour assist in determining whether this tax will be paid in the year the income is earned, such as for pay as you go withholding tax, or in future years, such as for individuals' refunds.
Other information affecting revenue forecasts includes known tax collections for the current year, new policy, and properties of the calendar (for example, more pay as you go withholding tax is paid on a Thursday than any other day so years with 53 Thursdays will result in more revenue than years with 52 Thursdays).
The Government's revenue forecasts, like all forecasts, are subject to a margin of error. The discernable trend between 2000‑01 and 2007‑08 was for revenue forecasts to under predict revenue outcomes (Chart D1). For example, the 2007‑08 Budget forecast taxation revenue to grow by 4.8 per cent in 2007‑08, compared to the outcome of 9.3 per cent, a forecast error of 4.5 percentage points. Since 2008‑09, reflecting the global financial crisis, the outcome for revenue has been lower than the Budget forecast.
The revenue forecasting error may be split into three underlying sources: errors in the forecasts of the economy underpinning the revenue forecasts; errors in translating the economy to revenue forecasts; and miscellaneous factors such as post Budget government policy decisions, court decisions regarding tax law interpretation, changes in compliance activities of the Australian Tax Office and their success, and revisions to historical economic data. Note that there may also be secondary errors relating to the timing of the payments of tax: even if the forecasts were accurate, revenue may be recorded in the fiscal year before or after it was expected.
Chart D1: Budget forecast error on taxation revenue growth
(excluding GST)
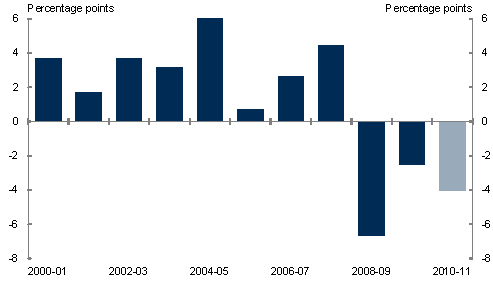
Chart D2 shows the relationship between forecast errors of the economy and tax revenue over recent years, including the current estimates for 2010‑11. The dotted lines in Chart D2 represent a theoretical range for the relationship between the economic and revenue forecasting errors.
- Nominal non‑farm GDP has been chosen as a broad indicator of the economic forecasts. Not all tax revenues are closely linked to GDP — capital gains tax (CGT) for example — and some of the sources of error described above are independent of economic conditions. So the relationship in the chart will only be approximate. The lines assume a revenue forecasting error of plus or minus 0.5 per cent if there is zero error on the economic forecasts.
- On average, economic forecasting errors will be magnified in the forecasting errors for revenue growth due to the progressive nature of personal income tax. The lower and upper lines assume aggregate elasticities (of revenue with respect to nominal non‑farm GDP) of 1.0 and 1.5 respectively, which are consistent with theoretical models of the tax system after broadly allowing for uncertainties such as capital gains tax and the timing of payments.
Chart D2: Budget forecast errors on nominal non‑farm GDP growth and
taxation
revenue growth (excluding GST)
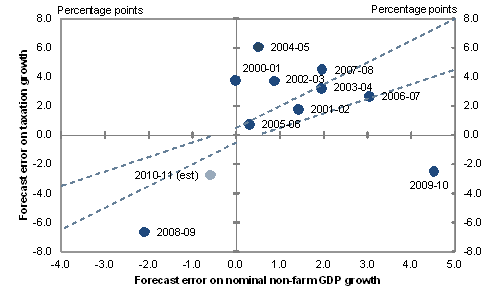
Broadly, points below this range represent forecasts of tax revenue growth that were too high, given the economic growth forecasts, and points above the range represent forecasts of tax revenue growth that were too low, given the economic growth forecasts.
- For example, in 2002‑03 nominal GDP growth turned out to be around ¾ of a percentage point higher than forecast but growth in tax revenue was almost 4 percentage points higher than forecast — higher than the around 1 percentage point error that the rule of thumb suggests should be theoretically associated with an economic forecasting error of that magnitude.
In recent years tax errors in tax revenue have been significantly affected by the economic downturn related to the global financial crisis, particularly with regard to capital gains tax and the utilisation of both operating and capital losses.
The 2008‑09 year was strongly affected by unforeseen movements in CGT. Revenue in 2007‑08 was bolstered by around $18 billion of CGT, an increase of more than 50 per cent from the previous year. Revenue in 2008‑09 was affected in reverse, as plunging stock prices led to a fall in CGT of greater than 30 per cent. Abstracting from CGT, the estimated forecast errors on tax revenue in 2007‑08 and 2008‑09 were much closer to the expected range, given the error on nominal non‑farm GDP.
Nominal GDP was overforecast for 2008‑09 by around 2.5 percentage points, resulting in a much larger overforecast for revenue of around 6.5 percentage points. This high implied elasticity is due partly to overforecasting CGT and partly to compositional changes in GDP associated with the recent economic downturn.
In 2009‑10, tax revenue was forecast relatively accurately despite the economy recovering much more quickly than was forecast at the 2009‑10 Budget. This is partly explained by the fact that the recovery in the nominal economy in 2009‑10 was heavily weighted to the end of the year — nominal GDP grew by only 0.5 per cent in the first quarter compared to 3.4 per cent in the last quarter. This is the most rapid increase in growth over the course of a financial year since 1972‑73 and it has material implications for tax revenue. Because tax is paid with a lag, most of the additional tax from the stronger than expected economy was paid in the early part of the 2010‑11 year rather than in 2009‑10.
In addition, the larger than expected utilisation of losses generated in 2008‑09 have contributed to the forecasting errors in 2009‑10 and 2010‑11. The current estimates for 2010‑11, compared to the 2010‑11 Budget, show that what appears likely to prove to be a modest over‑forecast of nominal GDP will translate into a larger over‑forecast of tax revenue, mostly due to a combination of natural disasters, exchange rate appreciation and larger than expected capital losses being utilised.
If www.budget.gov.au responds slowly or you are having trouble downloading a document, try one of the Budget Website Mirrors
Note: Where possible, Budget documents are available in HTML and for downloading in Portable Document Format(PDF). If you require further information on any of the tables or charts on this website, please contact The Treasury.