




Appendix B: Parameters and Further Information
This appendix provides information on the parameters used in producing this Budget Paper.
Budget Paper No. 1: Budget Strategy and Outlook 2011‑12, Statement 2: Economic Outlook, provides information on the forecasting approach used in the 2011‑12 Budget as well as estimates and projections of GDP and CPI.
Population
Population data is used to distribute funding between the States and in the calculation of annual growth factors.
Estimates of state populations
Table B.1 sets out the state population series used in this Budget Paper.
Table B.1: Population by State, at 31 December

- Treasury estimates.
The state populations for 2010‑11 to 2014‑15 are estimates of the population of each State on 31 December in the respective year. They are constructed using the latest demographic data available from the Australian Bureau of Statistics (ABS) and Treasury assumptions. These assumptions are in respect of fertility, mortality, net overseas migration and interstate migration.
Fertility
Treasury's assumptions about the total fertility rate (TFR) are based on those used in the 2010 Intergenerational Report. The TFR is assumed to fall slightly to 1.9 from the 1.921 TFR for 2009‑10 (as reported by ABS in Demographic Statistics, Australia, September Quarter 2010) and stay at that level for the remainder of the projection period.
Mortality
Treasury's estimates are based on the medium assumption used in the ABS Population Projections, 2006‑2101 (ABS cat. no. 3222.0), and assume a continuing decline in mortality rates across Australia, with state differentials persisting. Overall, mortality is assumed to decline to the year 2013, at the rate observed over the period 1971‑2005, from the level observed in the latest death registration data for 2009‑10.
Net overseas migration
Net overseas migration is the difference between permanent and long‑term arrivals, and permanent and long‑term departures.
Increased volumes of international movements across Australia's borders, changes to the composition of international visitors and their duration of stay behaviour and international travel patterns of Australian residents (including duration of absence and frequency of travel) make estimates of net overseas migration difficult.
In the 2010 Intergenerational Report net overseas migration was assumed to fall relatively sharply from an average of around 244,000 a year over the three years to June 2009 to 180,000 a year from 2012. The decline in net overseas migration has been larger than expected at the time the Intergenerational Report was released. Net overseas migration is now expected to dip below the long term Intergenerational Report assumption of 180,000 per annum in the years ending December 2010 and 2011, before returning to the long term assumption.
Table B.2 shows the net overseas migration assumptions used in this Budget Paper.
Table B.2: Net overseas migration

State and territory shares of net overseas migration are estimated by using a weighted average of the three most recent observed years — 2008, 2009 and 2010 — with weights of 1, 2 and 4 respectively.
Interstate migration
Treasury's estimates of net interstate migration are based on a weighted average of the three most recent observed years — 2008, 2009 and 2010 — with weights of 1, 2 and 4 respectively.
Table B.3: Net interstate migration

Age/gender‑weighted populations
Treasury's estimates of state population have been used to calculate the population weighted for hospital utilisation for different age/gender cohorts. The weighted hospital utilisation forms part of the growth factor for the National Healthcare Specific Purpose Payment (SPP).
Table B.4: Age/gender‑weighted population

School enrolments
Student enrolment projections are based on a 99 per cent grade progression ratio model and take into account movements between government and non‑government sectors. Student enrolment data do not take into account future economic, migration or policy changes. They are used in calculating estimates of the growth factor for the National Schools SPP.
Table B.5: School enrolments

Wage and cost indices
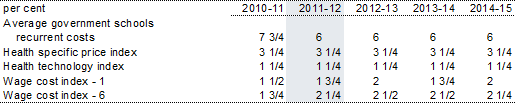
Table B.6 shows the wage and cost indices used in this Budget Paper, rounded to the nearest quarter.
Table B.6: Wage and cost indices
Data sources
The information in Part 4 and Appendix E of this Budget Paper is consistent with the ABS Government Finance Statistics reporting framework for the public sector.
Commonwealth data are sourced from the Commonwealth Government Final Budget Outcomes, ABS, and Commonwealth Government Consolidated Financial Statements. See Budget Paper No. 1: Budget Strategy and Outlook 2011‑12, Statement 10: Historical Australian Government Data, for more information.
State data for 2010‑11 onwards are sourced from States' 2010‑11 mid‑year financial reports, with the exception of Victoria, the Australian Capital Territory and the Northern Territory which are sourced from 2011‑12 Budgets.
Commonwealth Government budget aggregates have been backcast to 1999‑2000 (where applicable) for recent accounting clarification changes that require revisions to the historic series, ensuring that data are consistent across the accrual period from 1999‑2000.
The 2011‑12 Budget also includes revisions to Commonwealth Government budget aggregates that improve the accuracy and comparability of the data through time. See Budget Paper No. 1: Budget Strategy and Outlook 2011‑12, Statement 10: Historical Australian Government Data, for more information on these revisions.
Further information
Several publications of the ABS also provide information that is relevant to analysing federal financial relations, including:
- Australian Demographic Statistics (cat. no. 3101.0);
- Population Projections, 2006‑2101 (cat. no. 3222.0);
- Taxation Revenue, Australia (cat. no. 5506.0);
- Government Finance Statistics, Australia (cat. no. 5512.0);
- Australian System of Government Finance Statistics — Concepts, Sources and Methods (cat. no. 5514.0);
- Information Paper: Developments in Government Finance Statistics (cat. no. 5516.0); and
- Information Paper: Accruals‑Based Government Finance Statistics (cat. no. 5517.0).
Several publications by the Commonwealth Grants Commission can also provide information relevant to the analysis of federal financial relations relating to the distribution of GST revenue. In relation to the 2011‑12 financial year, the relevant publication is:
- Report on GST Revenue Sharing Relativities — 2011 Review.
If www.budget.gov.au responds slowly or you are having trouble downloading a document, try one of the Budget Website Mirrors
Note: Where possible, Budget documents are available in HTML and for downloading in Portable Document Format(PDF). If you require further information on any of the tables or charts on this website, please contact The Treasury.