




Domestic economic outlook
The weaker international environment is weighing on Australia's economic outlook, exacerbating existing pressures on some sectors of the economy and driving downward revisions to forecast growth in real GDP and employment since Budget.
The marked deterioration in global economic and financial conditions over recent months has been transmitted to the Australian economy through a number of channels, with considerable volatility in the exchange rate, falls in Australian equity prices, lower prices for some of Australia's key export commodities — particularly iron ore and coal — and weaker business and consumer confidence. This has contributed to a reduction in momentum in some parts of the economy and a slowdown in employment growth.
Notwithstanding these pressures, Australia's real GDP growth is still expected to strengthen over the forecast period, rising from 2.1 per cent in 2010‑11 to 3¼ per cent in both 2011‑12 and 2012‑13. Employment is forecast to grow 1 per cent through the year to the June quarter of 2012 and 1½ per cent through the year to the June quarter of 2013, still solid but weaker than forecast at Budget. The unemployment rate is forecast to drift up to 5½ per cent by the June quarter of 2012, remaining broadly unchanged through to the June quarter of 2013.
Australia's economic growth outlook is underpinned by the strong prospects for the resources sector, notwithstanding recent declines in commodity prices. Global prices for Australia's key non‑rural commodity exports have declined since early September, coinciding with falls in broader commodities markets, strong growth in supply and a recent easing of global steel production. However, by the end of October, prices appeared to have fallen more than fundamentals would suggest. Iron ore prices have since increased and it is anticipated they will regain further ground over coming months. Notwithstanding recent volatility, coal and iron ore prices remain at high levels and production remains highly profitable for mining companies operating in Australia.
The pipeline of resources investment has continued to build over recent months, reflecting final investment decisions on a number of existing projects and several new project announcements. While cyclical fluctuations in global growth will have implications for commodity prices, mining investment decisions are taken over longer time horizons and are underpinned by projections of the growing resource needs of the large emerging market economies over a period of decades. In value terms, around two‑thirds of the large mining projects included in the economic forecasts have received final investment approval, with the majority of these already under construction. In 2011‑12, the mining sector intends to invest around $82 billion, which, based on the long‑run realisation of investment plans, would see mining investment increase to a record 5.3 per cent of GDP (Chart 2.1).
With continued solid demand from emerging Asia and significant production capacity anticipated to come on line, the volume of non‑rural commodity exports is forecast to grow by around 20 per cent over the next two years.
Chart 2.1: Mining versus non‑mining investment
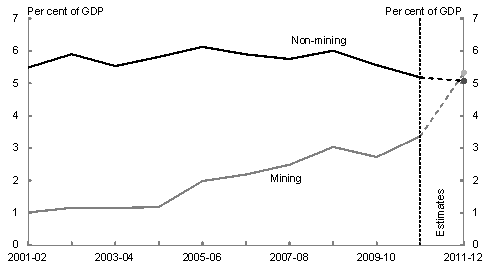
Note: Estimates for 2011‑12 are from the ABS CAPEX survey and are based on long‑run average realisation ratios.
Source: ABS cat. no. 5204.0, 5625.0 and Treasury.
While the Australian economy is forecast to grow at around its trend rate in aggregate, conditions are expected to remain uneven, with the deterioration in international conditions adding to existing pressures on some sectors of the economy (Box 2.1).
Many Australian businesses are well‑equipped to deal with short‑term volatility in the exchange rate; however, the sustained strength of the Australian dollar is placing significant strain on trade‑exposed sectors of the economy. The exchange rate has been above its post‑float average for most of the past decade, prompting a growing number of firms in trade‑exposed industries to re‑evaluate their business models. Even before the recent international turmoil, it was increasingly evident that the elevated exchange rate was having a greater impact on economic activity than previously anticipated.
Compounding these pressures are a number of legacy effects from the global financial crisis, including the difficulty some businesses still confront in accessing credit and cautious household spending behaviour. Household spending is likely to be further affected in the near term by falls in equity markets and easing employment growth. Looking ahead, household spending is forecast to grow broadly in line with income growth, with the household saving ratio expected to remain elevated over the forecast period.
These forces are expected to weigh heavily, if unevenly, on some parts of the economy that are not directly benefitting from the resources boom. Business surveys suggest that the prospects for profitability, investment, and employment outside the resources sector have softened since the start of 2011, notwithstanding the partial recovery in the past couple of months.
With the Australian economy expected to grow at around its trend rate and the unemployment rate forecast to drift up a little, capacity pressures are expected to remain well contained, with forecast wages growth and inflation revised down since Budget. The Wage Price Index is forecast to increase 3¾ per cent in both 2011‑12 and 2012‑13, with continued strong wages growth in resources‑related industries expected to be tempered by more modest increases in other parts of the economy.
Headline inflation is forecast to rise from 2¼ per cent through the year to the June quarter of 2012 to 3¼ per cent through the year to the June quarter of 2013, including a one‑off ¾ of a percentage point increase due to the introduction of the carbon price. Underlying inflation is expected to remain well contained at 2¾ per cent through the year to the June quarter of 2013, including a one‑off ¼ of a percentage point addition due to the carbon price.
The introduction of the carbon price is fully accounted for in the MYEFO forecasts and is not expected to have a material impact on the economic outlook. In addition to the one-off increase in headline and underlying inflation, the carbon price is expected to reduce real GDP and employment growth by less than ¼ of a percentage point in 2012‑13, with no discernible impact on the forecast unemployment rate.
Forecast growth in the terms of trade has been revised up in year‑average terms for 2011‑12, notwithstanding the falls in iron ore and coal prices in September and October. This reflects unanticipated strength in bulk commodity prices through to the September quarter, in part due to a more protracted return to normal operations at Queensland coal mines and underpinned by continued robust demand from China. However, a sharper decline is now expected in 2012‑13, consistent with recent declines in coal and iron ore prices and the expected growth in global supply of Australia's key non‑rural commodity exports. The terms of trade are now expected to increase 1¾ per cent in 2011‑12, before declining 5¼ per cent in 2012‑13. Notwithstanding the near‑term changes in the forecast terms of trade profile, the level of the terms of trade in 2012‑13 is close to that forecast at Budget.
The risks to the outlook remain firmly on the downside. In the context of an already fragile global economy, rapidly evolving events in Europe have shaken confidence and financial markets, and pose a significant risk that the global economic outlook could deteriorate quickly. In this environment, Australia's terms of trade could also decline more sharply than currently forecast.
Table 2.1: Domestic economy forecasts(a)
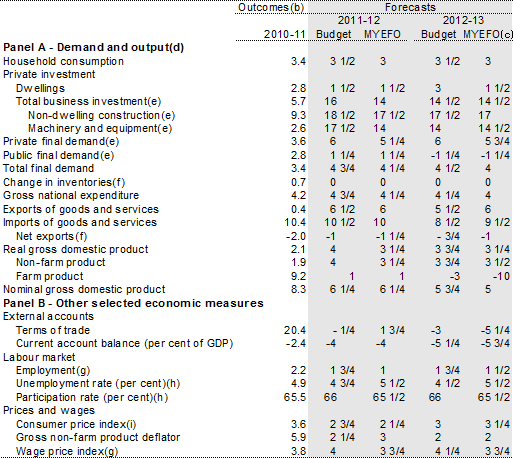
- Percentage change on preceding year unless otherwise indicated.
- Calculated using original data unless otherwise indicated.
- MYEFO forecasts incorporate the introduction of a carbon price on 1 July 2012.
- Chain volume measures except for nominal gross domestic product which is in current prices.
- Excluding second‑hand asset sales from the public sector to the private sector.
- Percentage point contribution to growth in GDP.
- Seasonally adjusted, through‑the‑year growth rate to the June quarter.
- Seasonally adjusted rate for the June quarter.
- Through‑the‑year growth rate to the June quarter.
Source: ABS cat. no. 5204.0, 5206.0, 5302.0, 6202.0, 6345.0, 6401.0, unpublished ABS data and Treasury.
Note: The forecasts are based on several technical assumptions. The exchange rate is assumed to remain around its recent average level — a trade‑weighted index of around 74 and a United States dollar exchange rate of around 101 US cents. Interest rates are assumed to fall in line with market expectations. World oil prices (Malaysian Tapis) are assumed to remain around US$120 per barrel. The farm sector forecasts are based on an assumption of average seasonal conditions.
Box 2.1: The patchwork economy
The past few years have seen an increasing divergence in the performance of different sectors of the Australian economy. While the resources‑related parts of the economy are doing very well, some other parts are struggling under the weight of the high Australian dollar, legacy effects from the global financial crisis and the recent global instability.
The rapid urbanisation and industrialisation in Asia is driving strong growth in demand and high prices for Australia's key non‑rural commodity exports. This has lifted Australia's terms of trade to record highs and contributed to a substantial appreciation of the Australian dollar.
The resources sector has been the key beneficiary. Production is down over the past year, but this largely reflects the effects of the severe flooding earlier in the year, with growth expected to ramp up sharply in 2011‑12. Mining capital investment grew by 34 per cent to a record $48 billion in 2010‑11, with mining employment increasing by 14 per cent over the year to August 2011.
Agriculture is also performing well, buoyed by good weather conditions and relatively high prices, with growth exceeding 9 per cent over the past year.
Elsewhere in the economy, conditions are uneven, with some parts of the economy very weak, while other parts are performing solidly. The weakness is particularly pronounced in the 'goods' parts of the economy —manufacturing, retail and wholesale trade, and road transport. There is also weakness in construction outside of the resources sector.
Manufacturing output rose by 0.1 per cent over the past year, and manufacturing employment declined 5.4 per cent over the year to August 2011. The high exchange rate appears to have accelerated the structural changes that have been underway in the sector for some time. Not all manufacturing has been weaker, however, with mining‑related manufacturing performing strongly. In particular, metal products manufacturing grew almost 8 per cent over the past year.
Domestic retailers have faced subdued conditions in recent years, with retail sales growing well below trend. The weakness reflects a broader pattern of heightened household caution since the global financial crisis, with consumers saving more and borrowing less, notwithstanding solid growth in household incomes. It also reflects the effects of the strong Australian dollar, with Australians taking advantage of cheaper overseas travel. In other parts of the 'goods' chain activity has also been subdued.
The performance of the 'services' sector, which accounts for a large part of the economy, continues to be uneven, with some parts performing poorly, and other parts, including those linked to the resources sector, performing well. Rental, hiring and real estate services output has fallen over the past year and other sectors, such as information media and telecommunications, have also been relatively weak.
On the other hand, education and training, and health care and social assistance have grown solidly, while administrative and support services and professional, scientific and technical services have grown strongly over the same period.
Overall, this part of the economy appears to be doing reasonably well.
The strength of these service sectors helps explain why the unemployment rate has remained low in the face of pronounced weakness in some other parts of the economy. Although mining (and mining construction) employment is growing strongly, the sector only employs a small part of the labour force and even strong growth in employment in this sector would not be enough to offset the weakness in the larger employing sectors such as manufacturing and retail.
It is the large employing service sectors that are helping to bolster employment growth in the patchwork economy: for example, over the past year the health care and social assistance sector has added nearly 45,000 jobs; public administration and safety has added nearly 34,000 jobs; administrative and support services have added over 23,000 jobs; and professional, technical and scientific services have added around 22,000 jobs. Together, the service sectors have added 195,000 jobs over the past year, more than 3 times the number of jobs created by the mining and construction sectors combined.
These divergent trends are set to continue through at least the next two years, and probably longer.
Growth in the resources and resources‑related parts of the economy — about 15 per cent of total GDP — is expected to exceed 10 per cent in both 2011‑12 and 2012‑13. In contrast, average growth in the remainder of the economy (outside of agriculture) is expected to remain very modest, with significant divergences in growth rates across sectors (Chart 2.2).
Chart 2.2: Growth in mining and non‑mining sectors
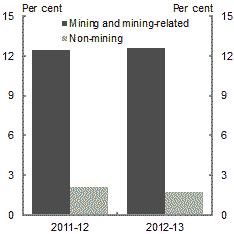
Source: ABS cat. no. 5204.0, 5625.0, 5302.0 and Treasury.
If www.budget.gov.au responds slowly or you are having trouble downloading a document, try one of the Budget Website Mirrors
Note: Where possible, Budget documents are available in HTML and for downloading in Portable Document Format(PDF). If you require further information on any of the tables or charts on this website, please contact The Treasury.