




Fiscal outlook (continued)
Fiscal balance estimates
The fiscal balance is expected to be in deficit by $32.4 billion in 2011‑12, $12.2 billion higher than forecast in the 2011‑12 Budget.
Table 3.10 provides a reconciliation of the fiscal balance estimates, including the impact of policy decisions and parameter and other variations on revenue, expenses and net capital investment.
Table 3.10: Reconciliation of general government sector fiscal balance
estimates
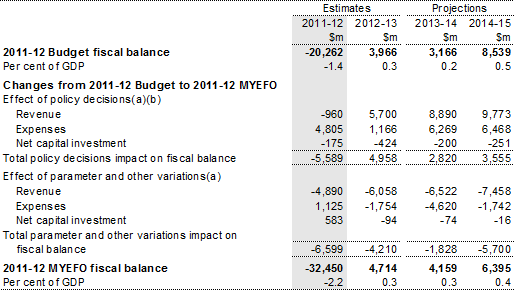
- A positive number for revenue indicates an increase in the fiscal balance, while a positive number for expenses and net capital investment indicates a decrease in the fiscal balance.
- Excludes secondary impacts on public debt interest of policy decisions and offsets from the Contingency Reserve for decisions taken.
Revenue estimates
Total revenue has been revised down by $5.9 billion in 2011‑12. While changes in revenue are generally driven by the same factors as receipts, there are differences, as not all revenue raised in a given year is actually paid in that year. For example, past tax assessments may be amended as a result of compliance activity or the settlement of legal disputes and taxpayers may accrue new tax debts. These differences exist for most revenue heads, and vary across years. In addition, the Clean Energy Future package has a significantly different impact on accrual revenue compared to cash receipts, largely due to differences in the treatment of the allocation of free carbon units under the Jobs and Competitiveness Program and the Energy Security Fund.
Detailed Australian Government general government sector revenue estimates for 2011‑12 and 2012‑13, compared with the estimates published in the 2011‑12 Budget, are provided in Tables 3.11 and 3.12 respectively.
Table 3.11: Australian Government general government sector accrual
revenue — 2011-12
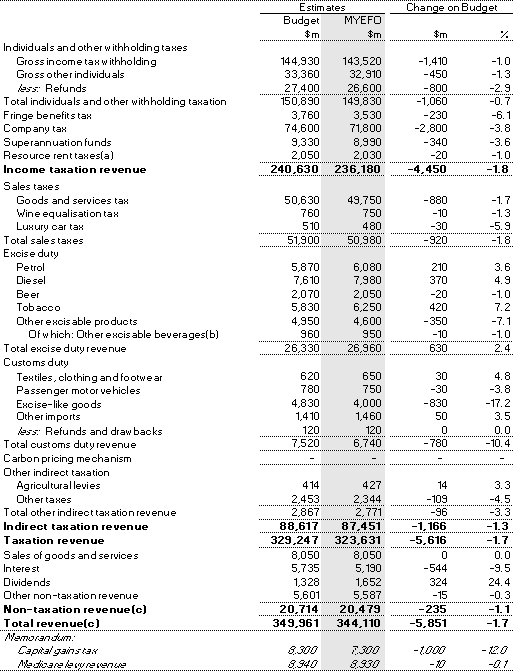
- Resource rent taxes in 2011‑12 only includes PRRT.
- Other excisable beverages are those not exceeding 10 per cent by volume of alcohol.
- Includes expected Future Fund earnings which are $524 million higher in 2011‑12 (and $980 million across the budget and forward estimates) than at the time of the 2011‑12 Budget. These earnings do not impact on the underlying cash balance.
Table 3.12: Australian Government general government sector accrual
revenue — 2012-13
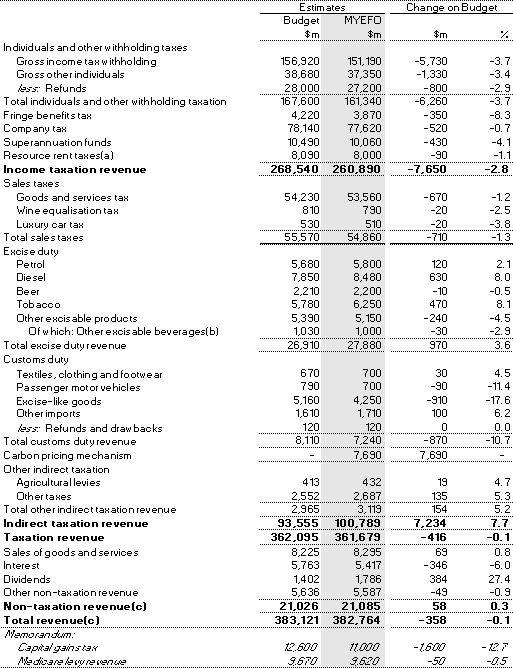
- Resource rent taxes include PRRT and gross revenue from the MRRT. The net revenue from the MRRT is $3.7 billion in 2012‑13, which represents the net impact on revenue across several different revenue heads. This includes the offsetting reductions in company tax (through deductibility) and interactions with other taxes.
- Other excisable beverages are those not exceeding 10 per cent by volume of alcohol.
- Includes expected Future Fund earnings which are $113 million higher in 2012‑13 (and $980 million across the budget and forward estimates) than at the time of the 2011‑12 Budget. These earnings do not impact on the underlying cash balance.
Expense and net capital investment
Movements in accrual expenses and net capital investments over the forward estimates are broadly similar to the movements in cash payments. The key exceptions include:
- support under the Clean Energy Future package, in the form of the provision of free carbon permits to the most emissions‑intensive activities in the economy and coal‑fired power stations, as this arrangement has a larger impact on accrual expenses compared to cash payments ($7.2 billion over four years);
- deferring the commencement of the new Research and Development Tax Incentive by 12 months where the effect on cash payments (a reduction of $720 million) occurs in 2011‑12 but the impact on expenses was reflected in 2010‑11 through lower refundable offset outlays;
- the provision of GST to the States and Territories, reflecting higher than estimated GST collections ($437 million) relating to the 2010‑11 financial year. This amount will be paid in 2011‑12 following a determination by the Treasurer but was accrued in 2010‑11; and
- the Natural Disaster Relief and Recovery Arrangements, where the expense is recorded in the year in which the disaster occurs rather than when the State or Territory lodges a claim for reimbursement following completion of the work.
Estimates of Australian Government general expenses by function can be found in Attachment C.
Table 3.13 provides a reconciliation of expense estimates.
Table 3.13: Reconciliation of general government sector expense estimates
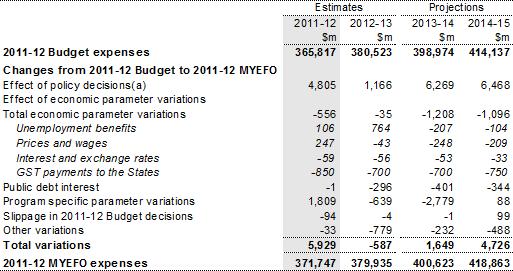
- Excludes secondary impacts on public debt interest of policy decisions and offsets from the Contingency Reserve for decisions taken.
Table 3.14 provides a reconciliation of the net capital investment estimates.
Table 3.14: Reconciliation of general government sector net capital
investment estimates
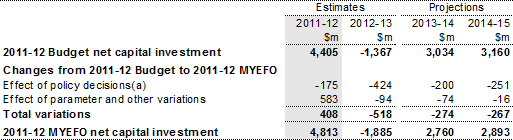
- Excludes secondary impacts on public debt interest of policy decisions and offsets from the Contingency Reserve for decisions taken.
Net debt, net financial worth and net worth
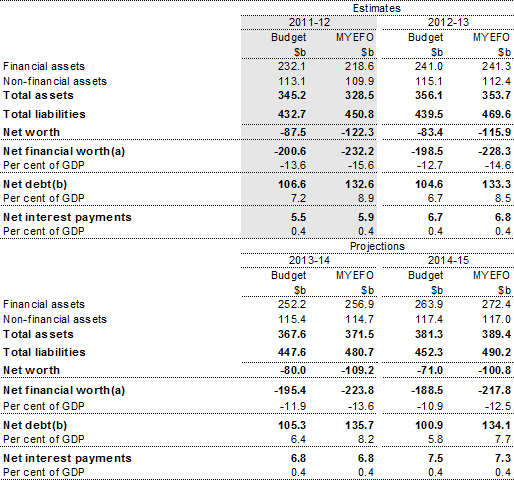
Net debt for the Australian Government general government sector is forecast to be $132.6 billion in 2011‑12, $25.9 billion higher compared to the forecast in the 2011‑12 Budget.
The increase in the level of net debt since the 2011‑12 Budget largely reflects both an increase in the market value of the stock of existing Commonwealth Government Securities (CGS) outstanding owing to lower interest rates and an increase in issuance of CGS on account of the weaker fiscal outlook in 2011‑12. CGS are reported in the general government sector's balance sheet in market value terms, consistent with external accounting standards, and the limit on issuance under the Commonwealth Inscribed Stock Act 1911 is based on the face value of CGS.
Net debt has also been affected by a decrease in the value of investments held by the Future Fund primarily as a result of revised earnings estimates based on actual performance year‑to‑date.
The Australian Government's net debt remains low by international standards. The average net debt position of the major advanced economies (G7) is projected to reach 92.9 per cent of GDP in 2016.
The changes to net debt described above also impact on net financial worth and net worth.
- Net financial worth is forecast to be ‑$232.2 billion in 2011‑12, compared to the Budget estimate of ‑$200.6 billion.
- Net worth is forecast to be ‑$122.3 billion in 2011‑12, compared to the Budget estimate of ‑$87.5 billion.
The change in net financial worth and net worth also reflect changes in the value of the Government's investment in the Reserve Bank of Australia, owing to revaluation losses associated with the appreciation in the exchange rate, and changes in the accounting treatment for disaster recovery payments made to the States and Territories through the Natural Disaster Relief and Recovery Arrangements program.
Table 3.15 provides a summary of Australian Government general government sector net debt, net financial worth, net worth and net interest payments.
Table 3.15: Australian Government general government sector net
financial worth, net debt, net interest payments and net worth
- Net financial worth equals total financial assets minus total liabilities.
- Net debt equals the sum of deposits held, advances received, government securities, loans and other borrowing, minus the sum of cash and deposits, advances paid and investments, loans and placements.
Medium term
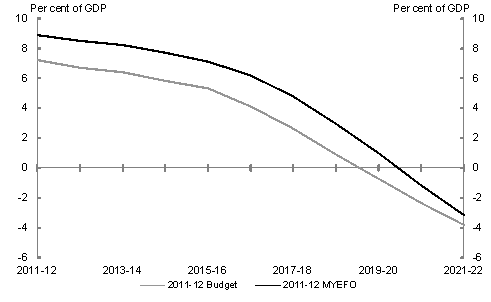
The budget position is projected to continue to strengthen over the medium term. The underlying cash balance is projected to reach a surplus of 1 per cent of GDP in 2017‑18 (Chart 3.2). Net debt is projected to return to zero in 2020‑21, after peaking at 8.9 per cent of GDP in 2011‑12 (Chart 3.3).
Chart 3.2: Underlying cash balances projected to 2021‑22
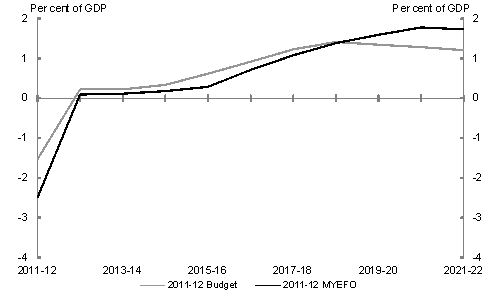
Chart 3.3: Government net debt projected to 2021‑22
If www.budget.gov.au responds slowly or you are having trouble downloading a document, try one of the Budget Website Mirrors
Note: Where possible, Budget documents are available in HTML and for downloading in Portable Document Format(PDF). If you require further information on any of the tables or charts on this website, please contact The Treasury.