




Statement 6: Expenses and Net Capital Investment (Continued)
Overview (Continued)
Housing and community amenities
The housing and community amenities function includes the Australian Government's contribution to the National Affordable Housing Specific Purpose Payments and related national partnerships, other Australian Government housing programs, the expenses of Defence Housing Australia (DHA), and various regional development and environmental protection programs.
Table 10: Summary of expenses — housing and community amenities
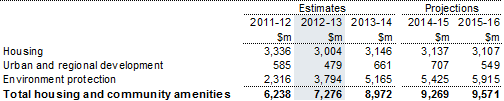
Total expenses under the housing and community amenities function are estimated to increase by 22.1 per cent in real terms from 2012‑13 over the forward estimates, or by 6.9 per cent per annum on average in real terms.
The housing sub‑function contains initiatives relating to the Australian Government's contribution to the National Affordable Housing Specific Purpose Payments and related National Partnerships, provision of housing for the general public and people with special needs, and the expenses of DHA.
Expenses for the sub‑function will decline slightly in 2012‑13 to reflect the scheduled conclusion of payments such as the Social Housing Initiative in 2011‑12 and cessation of the Housing Affordability Fund in 2012‑13. Otherwise, expenses are stable over the forward estimates.
The urban and regional development sub‑function comprises regional development programs and services to territories, including the Regional Development Australia Fund (RDAF). Expenses are expected to fluctuate over the forward estimates, consistent with the varying nature of the projects being undertaken, and the multiple rounds being held. The increase in forecast expenses in 2013‑14 and 2014‑15 and subsequent decrease from 2014‑15 to 2015‑16 is primarily due to the funding profile of the $573 million component of the RDAF which is funded by the Minerals Resource Rent Tax.
The environment protection sub‑function includes expenses for a variety of initiatives including the protection and conservation of the environment, water and waste management, pollution abatement and environmental research. The large increase in expenses from 2012‑13 is primarily due to the implementation of various programs under the Clean Energy Futures package announced on 10 July 2011. This package includes a number of programs designed to assist the most emissions‑intensive activities in the economy to transition to a carbon‑constrained future (for example, the Jobs and Competitiveness Program and Energy Security Fund) and programs which support land and natural resource management activities (for example, the Biodiversity Fund).
Recreation and culture
The recreation and culture function includes support for public broadcasting and cultural institutions, funding for the arts and the film industry, assistance to sport and recreation activities, as well as the management and protection of national parks and other world heritage areas. This function also includes expenses relating to the protection and preservation of historic sites and buildings, including war graves.
Table 11: Summary of expenses — recreation and culture
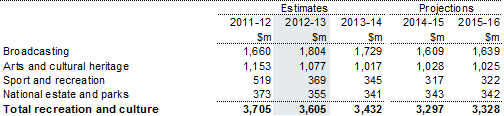
Total expenses under the recreation and culture function are estimated to decrease by 14.3 per cent in real terms from 2012‑13 over the forward years, or by 5.0 per cent per annum on average in real terms, largely due to the completion of programs under the broadcasting sub‑function.
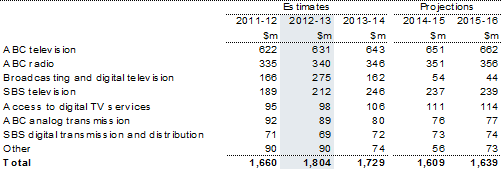
Expenses under the broadcasting sub‑function are expected to fall in real terms in 2013‑14 and 2014‑15, reflecting the roll‑out and completion of the Government's national digital television switchover program.
Table 11.1 provides further details of the major components of broadcasting sub‑function expenses.
Table 11.1: Trends in the major components of broadcasting sub‑function
expenses
Expenses under the arts and cultural heritage sub‑function are expected to decrease between 2012‑13 and 2013‑14 but remain largely stable between 2013‑14 and 2015‑16.
The sport and recreation sub‑function includes programs to improve participation in sport and recreational activities, and achieve excellence in high performing athletes. The forecast decrease in expenses from 2013‑14 largely reflects completion of the Active After‑school Communities program, which has been extended by one calendar year to December 2013. See Budget Paper No. 2, Budget Measures 2012‑13 for more details.
Expenses under the national estate and parks sub‑function are expected to decrease slightly over the forward estimates. The decrease largely reflects a reduction in funding for the Australian‑Antarctic Program from 2012‑13 and the Great Barrier Reef Marine Park Authority from 2013‑14.
Fuel and energy
The fuel and energy function includes expenses for the Fuel Tax Credits, Cleaner Fuels and Product Stewardship Waste (Oil) schemes, administered by the Australian Taxation Office. It also includes expenses related to improving Australia's energy efficiency, resource related initiatives, and programs to support the production or use of alternative fuels, including ethanol and biodiesel.
Table 12: Summary of expenses — fuel and energy

Fuel and energy expenses are estimated to increase by 16.5 per cent in real terms from 2012‑13 over the forward years, or by 5.2 per cent per annum on average.
The major program within this function is the Fuel Tax Credits Scheme which is expected to see an increase across the budget and forward estimates, reflecting increased claims by eligible businesses commensurate with higher diesel consumption, particularly in the mining industry.
Changes in the Fuel Tax Credit estimates also reflect, from 1 July 2012, the completion of the phasing in of fuel tax credits on fuel used in off‑road activities such as construction, manufacturing, wholesale, retail, property management and landscaping. This increase is offset by the introduction of the carbon pricing mechanism which from 1 July 2012 reduces fuel tax credit entitlements in place of incurring carbon pricing for off‑road fuel use.
In 2013‑14, opt‑in arrangements will allow large off‑road fuel users to opt into the carbon pricing mechanism which will restore their full fuel tax credit entitlements. Subject to enabling legislation, from 1 July 2014 eligible on‑road fuel users that choose not to opt into the carbon pricing scheme will also claim reduced fuel tax credits.
Table 12.1 provides further details of the fuel and energy sub‑function expenses.
Table 12.1: Trends in the major components of fuel and energy sub‑function
expenses
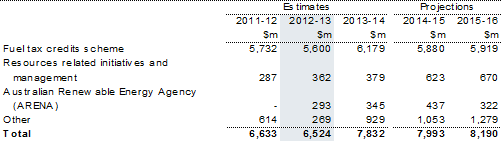
The increase in expenses under the Resources Related Initiatives and Management component from 2012‑13 mainly relates to the anticipated scale‑up of projects under the Carbon Capture and Storage Flagships program and a growth in expenses under the Ethanol Production Grants program.
The Australian Renewable Energy Agency (ARENA) component reflects the commencement of the agency on 1 July 2012. ARENA will administer a range of Government support programs for research and development, demonstration and commercialisation of renewable energy projects, including some programs previously administered by the Department of Resources, Energy and Tourism. The fluctuation in expenses after 2012‑13 is largely driven by the expected timing of projects.
The fluctuation in expenses under the Other component partly reflects the timing of the rollout of the Coal Sector Jobs package. The package assists the most emissions‑intensive coal mines to transition to a carbon price. The increase in expenses from 2013‑14 relates to the anticipated scale‑up of projects funded from the Low Emissions Technology Demonstration Fund.
Agriculture, forestry and fishing
The agriculture, forestry and fishing function expenses support assistance to primary producers, forestry, fishing, land and water resources management, quarantine services and contributions to research and development.
Table 13: Summary of expenses — agriculture, forestry and fishing
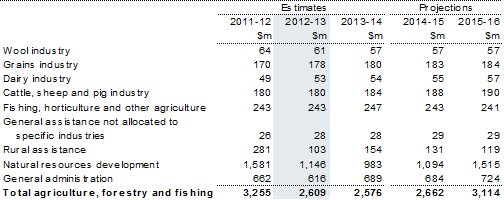
Total expenses under this function are estimated to increase by 10.8 per cent in real terms from 2012‑13 over the forward years, or by 3.5 per cent per annum on average.
Expenses for the rural assistance sub‑function are estimated to increase by 6.8 per cent in real terms over the forward estimates. The estimated reduction in expenditure between 2011‑12 and 2012‑13 reflects a general return to normal seasonal conditions across Australia and an anticipated reduction in spending on drought assistance assumed to be maintained over the forward estimates. The increase in estimated expenses in 2013‑14, and the subsequent reduction over 2014‑15 and 2015‑16, is driven by the introduction of the Carbon Farming Futures program (CFF) announced in the 2011‑12 MYEFO. CFF is a grants program that encourages the farming industry to reduce greenhouse gas emissions on the land. The majority of grants expenditure for the program is expected to be incurred in 2013‑14.
Expenses under the natural resources development sub‑function are driven by the Water for the Future package, which comprises urban and rural programs, including funding for water purchasing (included under net capital investment), irrigation modernisation, desalination, recycling and stormwater capture. The fluctuation in annual expenses largely reflects the progressive completion by 2015‑16 of projects under the National Urban Water and Desalination Plan and the National Water Security Plan for Cities and Towns, and a scaling up of projects under the Sustainable Rural Water Use and Infrastructure Program from 2014‑15.
The components in the natural resources development sub‑function, including major water initiatives, are set out in Table 13.1.
Table 13.1: Trends in the major components of natural resources development
sub‑function expenses
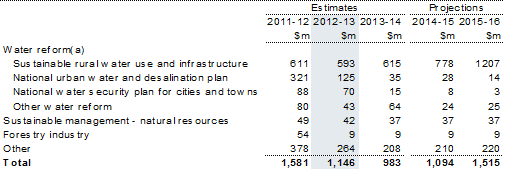
(a) Water Reform also includes the programs: National Partnership Payments — Water and Natural Resources; and Commonwealth Environmental Water.
Mining, manufacturing and construction
The mining, manufacturing and construction function includes expenses designed to assist the efficiency and competitiveness of Australian industries. The major components include the Research and Development Tax Incentive and programs specific to the automotive, textile, clothing and footwear industries.
Table 14: Summary of expenses — mining, manufacturing and construction

Total expenses under the mining, manufacturing and construction function are expected to increase by 6.8 per cent in real terms from 2012‑13 over the forward years.
The increase in expenses from 2012‑13 for the Research and Development Tax Incentive, administered by the Australian Taxation Office, drives much of the increase in expenses for this function and reflects an expected increase in claims. Expenses under the industry development and investment component of this function are also expected to increase from 2012‑13 due to the introduction of a number of industry assistance measures as part of the Clean Energy Futures package and the reprofiling of existing funding for industry assistance measures for the automotive industry. The forecast decrease in expenses in 2012‑13 from 2011‑12 for industry development and investment reflects the impact of bringing forward funding for the Steel Transformation Plan to encourage investment and innovation in the Australian steel manufacturing industry.
Table 14.1 provides further details of the major components of the mining, manufacturing and construction sub‑function expenses.
Table 14.1: Trends in major components of mining, manufacturing and
construction sub‑function expenses

Transport and communication
The transport and communication function supports the infrastructure and regulatory framework for Australia's transport and communication sectors.
Table 15: Summary of expenses — transport and communication
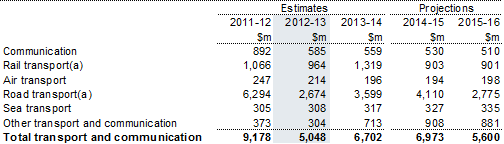
(a) Most road and rail funding in 2014‑15 and 2015‑16, which is currently classified under the road transport sub‑function, will be reclassified between the road and rail transport sub‑functions as programs of work are determined.
Total expenses under this function are estimated to decrease between 2011‑12 and 2012‑13 largely due to the bringing forward of $1.8 billion to 2011‑12, including for the early completion of some projects. There will also be a deferral of around $500 million from projects in 2012‑13 to 2013‑14 and later years. Total expenses are forecast to increase by 3.0 per cent in real terms from 2012‑13 over the forward years, or by 1.0 per cent per annum on average in real terms.
The expenses under the road transport sub‑function primarily consist of grants provided under the Nation Building program, including funding provided for projects under the Building Australia Fund (BAF). Expense estimates for this sub‑function fluctuate year on year as payments correspond to milestone and project timelines. The decline in estimated expenses from 2011‑12 is largely due to projects funded as a response to the global financial crisis nearing their completion and the acceleration of payments to various projects under the Nation Building program, the BAF and the Regional Infrastructure Fund (RIF) resulting in an increase in payments in 2011‑12 and a decrease in the forward years.
The next five year Nation Building program (Nation Building 2) begins in 2014‑15. Although the Government has not yet finalised the details of the program, a provision is recorded against the road transport sub‑function. Funds will be split between the road transport and the rail transport sub‑functions at a later date. The program will continue road infrastructure projects with funding for, among other things, the Government's election commitments for the Richmond Bridge in New South Wales, Princes Highway West in Victoria, Calliope Crossroads in Queensland, Great Eastern Highway in Western Australia and Tasman Highway in Tasmania. Funding includes an allocation for the continuation of the Roads to Recovery program, to improve safety at black spots, and the Heavy Vehicle Safety and Productivity program.
The increase in estimated expenses in the rail transport sub‑function between 2012‑13 and 2013‑14 is mainly due to metropolitan rail infrastructure funding provided as part of the Nation Building Plan for the Future package in the 2009‑10 Budget. This package includes projects funded from the BAF such as a $3.2 billion contribution over six years towards the Regional Rail Express project in Victoria. Nation Building 2 is also expected to continue rail infrastructure investment with funds for continued payments for the Moreton Bay Rail Link project in Queensland.
The estimated expenses for the air transport and sea transport sub‑functions predominantly relate to the activities of the safety regulators — the Civil Aviation Safety Authority, the Australian Maritime Safety Authority (AMSA) and the Australian Transport Safety Bureau (ATSB). The increase in the estimated expenses for the sea transport sub‑function is due to the National Transport Reforms which seek to establish national transport safety through expanding ATSB's safety investigation responsibilities and AMSA's maritime safety function. The decline in expenses in the air transport sub‑function over the forward estimates is primarily due to the winding down of the Regional Aviation Access program in mid‑2013.
The increase in estimated expenses in the other transport and communication sub‑function, commencing in 2013‑14 and rising in each year thereafter, reflects funding for the Regional Infrastructure Fund announced in the context of the Minerals Resource Rent Tax.
The decline in real terms of estimated expenses in the communication sub‑function from 2012‑13 reflects the completion of several digital productivity measures and the planned completion of activities related to the renewal, replanning and sale of radio frequency spectrum. This sub‑function does not reflect the Government's equity investment in the National Broadband Network.
Other economic affairs
The other economic affairs function includes expenses on tourism and area promotion, labour market assistance, immigration, industrial relations and other economic affairs not elsewhere classified (nec).
Table 16: Summary of expenses — other economic affairs
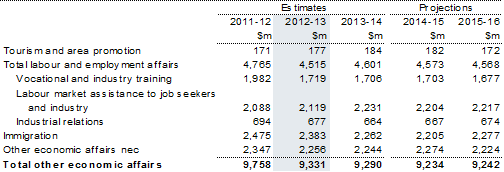
Total expenses under the other economic affairs function are projected to decrease by 8.1 per cent in real terms from 2012‑13 over the forward years, or by 2.8 per cent per annum on average in real terms.
Tourism and area promotion sub‑function expenses are expected to increase from 2012‑13 as a result of the introduction of the Asia Marketing Fund, which will support the promotion of Australia to growing markets in Asia. The subsequent projected decrease in expenses from 2014‑15 is the result of the winding down and cessation of several tourism related initiatives, including the TQUAL Grants program from the end of 2014‑15.
The reduction in expenses under the vocational and industry training sub‑function between 2011‑12 and 2012‑13 is attributable to the redirection of funding from the Productivity Places program to the Skills Reform National Partnership which will provide $1.75 billion in total over five years from 2012‑13. These expenses are included in the vocational and other education sub‑function within the education function.
The slight decrease in expenses over the forward estimates in the vocational and industry training sub‑function is largely due to the progressive termination of a number of short term programs announced in the 2011‑12 Budget as part of the Building Australia's Future Workforce package. These programs include: the Productivity Education and Training Fund; Investing in Experience — Skills Recognition and Training (previously called More Help for Mature Age Workers); and the Australian Apprenticeships Mentoring Program. The profile of expenses also reflects redirections in the Workforce Innovation, Vocational Education and Training National Support and Australian Apprenticeships Incentives Programs. See Budget Paper No. 2, Budget Measures 2012‑13 for more details.
The expenses under the labour market assistance to job seekers and industry sub‑function are estimated to decrease by an average of 1.0 per cent per annum in real terms from 2012‑13 over the forward estimates. This decrease reflects an estimated reduction in expenses of Job Services Australia, the completion of the National Green Jobs Corp program on 31 December 2011, and the completion of the Productive Ageing package on 30 June 2014. The increase in expenses for this sub‑function between 2012‑13 and 2013‑14 can be attributed to the redirection of the majority of CDEP resourcing, previously classified under the social security and welfare function, to partially fund the new Remote Jobs and Communities program commencing on 1 July 2013.
Industrial relations sub‑function expenses are expected to decline in real terms over the forward estimates. The estimated decrease in expenses in 2013‑14 compared to the previous years is mainly due to the cessation of the transitional education activities that support the implementation of the national workplace relations system for the private sector announced in the 2010‑11 Budget.
Estimated expenses in the immigration sub‑function are expected to fall slightly over the forward estimates. This fall is driven by costs associated with Irregular Maritime Arrivals (IMAs). While expenses associated with accommodating and processing IMAs have increased since the 2011‑12 MYEFO, these expenses will decline over the forward estimates as a result of the increasing use of lower cost detention options.
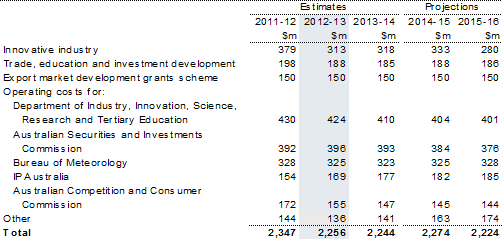
Under the other economic affairs nec sub‑function, the substantial decrease in expenses in 2012‑13 is primarily due to the closure of the Green Car Innovation Fund within the Innovative Industry program, which was closed to new applicants in the 2011‑12 Budget. Total expenses under this sub‑function are estimated to decrease by 8.5 per cent in real terms between 2012‑13 and 2015‑16.
Table 16.1 provides further details of trends in major components of the other economic affairs nec sub‑function expenses.
Table 16.1: Trends in major components of the other economic affairs nec
sub‑function expenses
Other purposes
The other purposes function includes expenses incurred in the servicing of public debt interest, and assistance to state, territory and local governments. This function also includes items classified to natural disaster relief, the Contingency Reserve (see Appendix B for a detailed description), and expenses related to the nominal interest on unfunded liabilities for government superannuation benefits.
Table 17: Summary of expenses — other purposes
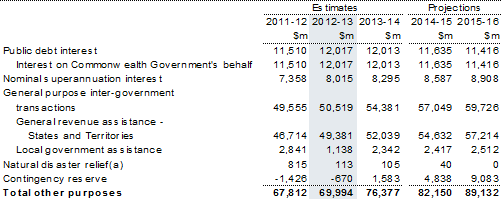
(a) Amounts for the Natural Disaster Relief and Recovery Arrangements (NDRRA) reflect expenses being recorded in the year in which the disaster occurs rather than when payments are made to State or Territory Governments in relation to Commonwealth financial obligations under the NDRRA.
Total expenses under the other purposes function are estimated to increase by 18.2 per cent in real terms from 2012‑13 over the forward years, or by 5.7 per cent per annum in real terms.
The increase in expenses over the forward estimates under the other purposes function is primarily driven by general revenue assistance paid to State and Territory governments, nearly all of which comprise payments of GST revenue grants which are provided on an 'untied' basis. The forecast growth in payments to the States and Territories for the GST has been revised down since the 2011‑12 MYEFO in line with forecast reductions in GST revenue. Payments to State and Territory governments tied to specific purposes are reported under the relevant sections in this statement. Further information on general revenue assistance to the States and Territories can be found in Budget Paper No. 3, Australia's Federal Relations 2012‑13.
The increase in expenses under the public debt interest sub‑function to 2012‑13 is due to the increased issuance of Commonwealth Government Securities. Expenses under the nominal superannuation interest sub‑function are projected to increase over time, reflecting the growth in the Commonwealth's superannuation liability. The Future Fund was established to assist in meeting the cost of this liability. Further information on the Future Fund can be found in Statement 7 of Budget Paper No. 1.
Expenses in the local government assistance sub‑function predominantly relate to financial assistance grants made to the States and Territories and consist of a general purpose component and an identified local road component, both of which are untied, allowing councils to direct the grants to local priorities. Expenses are higher in 2011‑12 but then reduce in 2012‑13 as a result of the Government's decision to pay the first two quarterly instalments of the expected 2012‑13 local government financial assistance grants of $1.1 billion to local councils in 2011‑12. This is to provide local governments with additional flexibility to respond to residual economic challenges arising from natural disasters in 2010‑11 and 2011‑12 and other pressures. Expenses are expected to increase from 2013‑14 across the forward estimates due to forecast population increases and changes in the Consumer Price Index (local government funding provided by the Commonwealth is linked to population and inflation). Also included in this sub‑function are expenses under the Regional and Local Community Infrastructure program which is scheduled to finish in 2011‑12. Further information on Commonwealth Government assistance to local governments can be found in Budget Paper No.3, Australia's Federal Relations 2012‑13.
The expenses under the natural disaster relief sub‑function from 2011‑12 to 2015‑16 relate mainly to the major natural disasters since 2009‑10, including the 2012 floods. Commonwealth payments provide financial support for the affected States and Territories under the Natural Disaster Relief and Recovery Arrangements.
The increase in expenses in the contingency reserve sub‑function from 2012‑13 is largely due to the conservative bias allowance (CBA). The CBA is a mechanism used to improve the accuracy of the forward estimates by anticipating the tendency for the estimates of existing policy to be revised upwards through time. The allowance is progressively unwound at each MYEFO and budget until it is completely removed for the budget year. This regular drawing down of the CBA reflects the fact that the tendency for underestimating payments diminishes as the forecast year gets closer. The Contingency Reserve is discussed in more detail at Appendix B.
If www.budget.gov.au responds slowly or you are having trouble downloading a document, try one of the Budget Website Mirrors
Note: Where possible, Budget documents are available in HTML and for downloading in Portable Document Format(PDF). If you require further information on any of the tables or charts on this website, please contact The Treasury.
