




Part 2:
Australian Government Financial Statements
The financial statements consist of an operating statement, including other economic flows, a balance sheet, and a cash flow statement for the Australian Government general government sector (GGS), the public non‑financial corporations (PNFC) sector, the total non‑financial public sector (NFPS) and the public financial corporations (PFC) sector. This part also contains notes showing disaggregated information for the GGS.
The Charter of Budget Honesty Act 1998 (the Charter) requires that the final budget outcome be based on external reporting standards and that departures from applicable external reporting standards be identified.
The Government has produced a single set of financial statements that comply with both the Australian Bureau of Statistics' (ABS) accrual Government Finance Statistics (GFS) and Australian Accounting Standards (AAS), meeting the requirement of the Charter, with departures disclosed. The financial statements for the Final Budget Outcome 2012‑13 have been prepared on a basis consistent with the 2013‑14 Budget. This enables comparison of the 2012‑13 revised estimates published at the 2013‑14 Budget and the outcome. The statements reflect the Government's accounting policy that ABS GFS remains the basis of budget accounting policy, except where the Government applies AAS because it provides a better conceptual basis for presenting information of relevance to users of public sector financial reports.
The Australian, State and Territory governments have an agreed framework — the Uniform Presentation Framework (UPF) — for the presentation of government financial information on a basis broadly consistent with the Australian Accounting Standards Board standard AASB 1049. The financial statements are consistent with the requirements of the UPF.
In accordance with the UPF requirements, this part also contains an update of the Australian Government's Loan Council Allocation.
Australian Government Financial Statements
| Note | 2012‑13 Estimate at 2013‑14 Budget $m |
Month of June 2013(d) $m |
2012‑13 Outcome $m |
Change on 2013‑14 Budget $m | |
|---|---|---|---|---|---|
| Revenue | |||||
| Taxation revenue | 3 | 338,727 | 20,278 | 337,323 | -1,403 |
| Sales of goods and services | 4 | 8,757 | 1,042 | 8,886 | 129 |
| Interest income | 5 | 3,764 | 458 | 3,646 | -119 |
| Dividend income | 5 | 2,429 | 733 | 3,079 | 650 |
| Other | 6 | 6,284 | 173 | 7,226 | 942 |
| Total revenue | 359,961 | 22,685 | 360,160 | 198 | |
| Expenses | |||||
| Gross operating expenses | |||||
| Wages and salaries(a) | 7 | 19,355 | 1,528 | 18,486 | -869 |
| Superannuation | 7 | 8,102 | 2,553 | 8,402 | 300 |
| Depreciation and amortisation | 8 | 6,022 | 507 | 6,398 | 376 |
| Supply of goods and services | 9 | 72,019 | 6,381 | 71,616 | -403 |
| Other operating expenses(a) | 7 | 5,411 | 830 | 5,705 | 293 |
| Total gross operating expenses | 110,910 | 11,799 | 110,607 | -302 | |
| Superannuation interest expense | 7 | 6,778 | 393 | 6,729 | -49 |
| Interest expenses | 10 | 13,281 | 1,778 | 13,768 | 488 |
| Current transfers | |||||
| Current grants | 11 | 109,950 | 13,894 | 110,535 | 585 |
| Subsidy expenses | 13,201 | 2,250 | 13,733 | 532 | |
| Personal benefits | 12 | 117,397 | 8,342 | 117,221 | -176 |
| Total current transfers | 240,548 | 24,485 | 241,489 | 941 | |
| Capital transfers | 11 | ||||
| Mutually agreed write-downs | 1,997 | 139 | 2,162 | 166 | |
| Other capital grants | 7,926 | 550 | 7,888 | -38 | |
| Total capital transfers | 9,923 | 689 | 10,051 | 128 | |
| Total expenses | 381,439 | 39,144 | 382,644 | 1,205 | |
| Net operating balance | -21,478 | -16,459 | -22,485 | -1,007 | |
| Other economic flows - included in operating result | |||||
| Net write-downs of assets (including bad and doubtful debts) | -7,092 | -334 | -8,006 | -914 | |
| Assets recognised for the first time | 535 | 40 | 344 | -191 | |
| Liabilities recognised for the first time | 0 | 0 | 0 | 0 | |
| Actuarial revaluations | -798 | -64 | -64 | 734 | |
| Net foreign exchange gains | 82 | 298 | -2,283 | -2,365 | |
| Net swap interest received | 256 | -175 | 15 | -241 | |
| Market valuation of debt | 3,467 | 5,087 | 11,498 | 8,032 | |
| Other gains/(losses) | 12,709 | -1,150 | 14,278 | 1,569 | |
| Total other economic flows - included in operating result | 9,159 | 3,703 | 15,782 | 6,623 | |
| Operating result(b) | -12,319 | -12,756 | -6,703 | 5,617 | |
| Non-owner movements in equity | |||||
| Revaluation of equity investments | -2,201 | 3,852 | 3,835 | 6,036 | |
| Actuarial revaluations | -745 | 50,122 | 50,122 | 50,867 | |
| Other economic revaluations | 661 | -2,882 | -2,697 | -3,358 | |
| Total other economic flows - included in equity | -2,284 | 51,093 | 51,261 | 53,545 | |
| Comprehensive result - Total change in net worth | -14,604 | 38,337 | 44,558 | 59,161 | |
| Net operating balance | -21,478 | -16,459 | -22,485 | -1,007 | |
| Net acquisition of non-financial assets | |||||
| Purchases of non-financial assets | 7,528 | 1,114 | 8,046 | 518 | |
| less Sales of non-financial assets | 3,661 | 1,507 | 1,729 | -1,932 | |
| less Depreciation | 6,022 | 507 | 6,398 | 376 | |
| plus Change in inventories | 371 | 348 | 1,007 | 636 | |
| plus Other movements in non-financial assets | 573 | -38 | 62 | -511 | |
| Total net acquisition of non-financial assets | -1,212 | -591 | 987 | 2,199 | |
| Fiscal balance (Net lending/borrowing)(c) | -20,266 | -15,868 | -23,472 | -3,205 |
(a) Consistent with ABS GFS classification, other employee related expenses are reported under other operating expenses. Total employee expenses equal wages and salaries plus other operating expenses.
(b) Operating result under AAS.
(c) The term fiscal balance is not used by the ABS.
(d) The month of June is derived by deducting May year‑to‑date published data from the annual outcome. Statistically, June movements in some series relate to earlier published months that are not reissued; this can result in negative movements.
| Note | 2012‑13 Estimate at 2013‑14 Budget $m |
2012‑13 Outcome $m |
Change on 2013‑14 Budget $m | |
|---|---|---|---|---|
| Assets | ||||
| Financial assets | ||||
| Cash and deposits | 19(a) | 2,470 | 2,094 | -376 |
| Advances paid | 13 | 35,409 | 34,472 | -937 |
| Investments, loans and placements | 14 | 103,278 | 111,098 | 7,820 |
| Other receivables | 13 | 44,464 | 44,080 | -384 |
| Equity investments | ||||
| Investments in other public sector entities | 22,803 | 25,072 | 2,269 | |
| Equity accounted investments | 330 | 300 | -31 | |
| Investments - shares | 33,431 | 33,661 | 231 | |
| Total financial assets | 242,184 | 250,777 | 8,592 | |
| Non-financial assets | 15 | |||
| Land | 8,680 | 8,918 | 237 | |
| Buildings | 23,433 | 23,500 | 67 | |
| Plant, equipment and infrastructure | 53,705 | 52,916 | -788 | |
| Inventories | 7,317 | 7,928 | 610 | |
| Intangibles | 5,602 | 5,635 | 34 | |
| Investment property | 182 | 195 | 14 | |
| Biological assets | 37 | 33 | -4 | |
| Heritage and cultural assets | 10,451 | 10,547 | 96 | |
| Assets held for sale | 83 | 110 | 28 | |
| Other non-financial assets | 795 | 292 | -503 | |
| Total non-financial assets | 110,284 | 110,074 | -210 | |
| Total assets | 352,469 | 360,851 | 8,382 | |
| Liabilities | ||||
| Interest bearing liabilities | ||||
| Deposits held | 192 | 182 | -10 | |
| Government securities | 292,845 | 285,748 | -7,097 | |
| Loans | 16 | 8,588 | 13,567 | 4,979 |
| Other borrowing | 1,134 | 1,149 | 15 | |
| Total interest bearing liabilities | 302,760 | 300,647 | -2,113 | |
| Provisions and payables | ||||
| Superannuation liability | 17 | 143,509 | 193,314 | 49,804 |
| Other employee liabilities | 17 | 14,600 | 14,798 | 198 |
| Suppliers payable | 18 | 4,264 | 6,409 | 2,145 |
| Personal benefits provisions and payable | 18 | 14,240 | 14,161 | -79 |
| Subsidies provisions and payable | 18 | 3,216 | 3,557 | 342 |
| Grants provisions and payable | 18 | 17,030 | 16,233 | -797 |
| Other provisions and payables | 18 | 13,961 | 14,383 | 422 |
| Total provisions and payables | 210,820 | 262,855 | 52,034 | |
| Total liabilities | 513,580 | 563,501 | 49,921 | |
| Net worth(a) | -161,112 | -202,650 | -41,539 | |
| Net financial worth(b) | -271,396 | -312,724 | -41,329 | |
| Net financial liabilities(c) | 294,198 | 337,796 | 43,598 | |
| Net debt(d) | 161,603 | 152,982 | -8,621 |
(a) Net worth is calculated as total assets minus total liabilities.
(b) Net financial worth equals total financial assets minus total liabilities.
(c) Net financial liabilities equals total liabilities less financial assets other than investments in other public sector entities.
(d) Net debt equals the sum of deposits held, government securities, loans and other borrowing, minus the sum of cash and deposits, advances paid and investments, loans and placements.
| 2012‑13 Estimate at 2013‑14 Budget $m |
Month of June 2013(d) $m |
2012‑13 Outcome $m |
Change on 2013‑14 Budget $m | |
|---|---|---|---|---|
| Cash receipts from operating activities | ||||
| Taxes received | 326,297 | 27,175 | 326,426 | 129 |
| Receipts from sales of goods and services | 9,043 | 1,041 | 9,071 | 28 |
| Interest receipts | 3,674 | 375 | 3,561 | -112 |
| Dividends and income tax equivalents | 3,186 | 296 | 3,420 | 234 |
| Other receipts | 6,574 | 193 | 6,846 | 272 |
| Total operating receipts | 348,773 | 29,079 | 349,323 | 550 |
| Cash payments for operating activities | ||||
| Payments for employees | -26,156 | -1,343 | -25,001 | 1,155 |
| Payments for goods and services | -72,855 | -7,618 | -72,114 | 742 |
| Grants and subsidies paid | -126,872 | -13,979 | -127,754 | -882 |
| Interest paid | -11,912 | -1,170 | -11,846 | 66 |
| Personal benefit payments | -116,257 | -7,823 | -116,629 | -373 |
| Other payments | -5,288 | -1,365 | -5,902 | -615 |
| Total operating payments | -359,339 | -33,297 | -359,247 | 92 |
| Net cash flows from operating activities | -10,566 | -4,218 | -9,924 | 643 |
| Cash flows from investments in non-financial assets | ||||
| Sales of non-financial assets | 1,637 | 1,507 | 1,729 | 92 |
| Purchases of non-financial assets | -7,542 | -1,025 | -7,644 | -101 |
| Net cash flows from investments in non-financial assets | -5,905 | 482 | -5,915 | -9 |
| Net cash flows from investments in financial assets for policy purposes | -5,288 | 62 | -4,802 | 486 |
| Cash flows from investments in financial assets for liquidity purposes | ||||
| Increase in investments | -3,733 | 943 | -6,197 | -2,463 |
| Net cash flows from investments in financial assets for liquidity purposes | -3,733 | 943 | -6,197 | -2,463 |
| Cash receipts from financing activities | ||||
| Borrowing | 27,022 | 1,797 | 27,985 | 963 |
| Other financing | 0 | -67 | -39 | -39 |
| Total cash receipts from financing activities | 27,022 | 1,731 | 27,946 | 924 |
| Cash payments for financing activities | ||||
| Borrowing | 0 | 0 | 0 | 0 |
| Other financing | -1,583 | 113 | -1,538 | 45 |
| Total cash payments for financing activities | -1,583 | 113 | -1,538 | 45 |
| Net cash flows from financing activities | 25,439 | 1,844 | 26,407 | 969 |
| Net increase/(decrease) in cash held | -54 | -885 | -429 | -376 |
| Net cash flows from operating activities and investments in non‑financial assets (Surplus(+)/deficit(-)) | -16,471 | -3,735 | -15,838 | 633 |
| Finance leases and similar arrangements(b) | -404 | -271 | -314 | 90 |
| GFS cash surplus(+)/deficit(-) | -16,876 | -4,006 | -16,152 | 724 |
| less Net Future Fund earnings | 2,501 | -118 | 2,682 | 181 |
| Equals underlying cash balance(c) | -19,377 | -3,888 | -18,834 | 543 |
| plus Net cash flows from investments in financial assets for policy purposes | -5,288 | 62 | -4,802 | 486 |
| plus Net Future Fund earnings | 2,501 | -118 | 2,682 | 181 |
| Equals headline cash balance | -22,163 | -3,944 | -20,954 | 1,209 |
(a) A positive number denotes a cash inflow; a negative number denotes a cash outflow.
(b) The acquisition of assets under finance leases decreases the underlying cash balance. The disposal of assets previously held under finance leases increases the underlying cash balance.
(c) The term underlying cash balance is not used by the ABS.
(d) The month of June is derived by deducting May year‑to‑date published data from the annual outcome. Statistically, June movements in some series relate to earlier published months that are not reissued; this can result in negative movements.
| 2012‑13 Estimate at 2013‑14 Budget $m |
2012‑13 Outcome $m |
Change on 2013‑14 Budget $m | |
|---|---|---|---|
| Revenue | |||
| Current grants and subsidies | 28 | 46 | 18 |
| Sales of goods and services | 8,951 | 8,692 | -259 |
| Interest income | 75 | 84 | 9 |
| Other | 1 | 41 | 40 |
| Total revenue | 9,055 | 8,863 | -192 |
| Expenses | |||
| Gross operating expenses | |||
| Wages and salaries(a) | 3,378 | 3,232 | -146 |
| Superannuation | 275 | 260 | -14 |
| Depreciation and amortisation | 714 | 635 | -79 |
| Supply of goods and services | 4,403 | 4,251 | -152 |
| Other operating expenses(a) | 472 | 545 | 73 |
| Total gross operating expenses | 9,241 | 8,923 | -319 |
| Interest expenses | 168 | 166 | -2 |
| Other property expenses | 284 | 289 | 6 |
| Current transfers | |||
| Tax expenses | 135 | 37 | -99 |
| Total current transfers | 135 | 37 | -99 |
| Total expenses | 9,828 | 9,415 | -414 |
| Net operating balance | -773 | -551 | 222 |
| Other economic flows | -540 | -205 | 335 |
| Comprehensive result - Total change in net worth excluding contribution from owners | -1,314 | -757 | 557 |
| Net acquisition of non-financial assets | |||
| Purchases of non-financial assets | 2,485 | 3,787 | 1,302 |
| less Sales of non-financial assets | 33 | 109 | 76 |
| less Depreciation | 714 | 635 | -79 |
| plus Change in inventories | 15 | 11 | -5 |
| plus Other movements in non-financial assets | 617 | 585 | -32 |
| Total net acquisition of non-financial assets | 2,370 | 3,638 | 1,269 |
| Fiscal balance (Net lending/borrowing)(b) | -3,143 | -4,189 | -1,047 |
(a) Consistent with ABS GFS classification, other employee related expenses are reported under other operating expenses. Total employee expenses equal wages and salaries plus other operating expenses.
(b) The term fiscal balance is not used by the ABS.
| 2012‑13 Estimate at 2013‑14 Budget $m |
2012‑13 Outcome $m |
Change on 2013‑14 Budget $m | |
|---|---|---|---|
| Assets | |||
| Financial assets | |||
| Cash and deposits | 1,409 | 891 | -518 |
| Investments, loans and placements | 98 | 100 | 2 |
| Other receivables | 1,869 | 2,411 | 542 |
| Equity investments | 11 | 11 | 0 |
| Total financial assets | 3,386 | 3,412 | 26 |
| Non-financial assets | |||
| Land and fixed assets | 12,553 | 12,538 | -15 |
| Other non-financial assets(a) | 1,629 | 1,634 | 5 |
| Total non-financial assets | 14,182 | 14,173 | -9 |
| Total assets | 17,568 | 17,585 | 17 |
| Liabilities | |||
| Interest bearing liabilities | |||
| Loans(b) | 0 | 2,508 | 2,508 |
| Other borrowing(b) | 3,694 | 1,341 | -2,353 |
| Total interest bearing liabilities | 3,694 | 3,849 | 155 |
| Provisions and payables | |||
| Superannuation liability | 0 | 59 | 59 |
| Other employee liabilities | 1,795 | 1,239 | -556 |
| Other provisions and payables(a) | 2,462 | 2,514 | 52 |
| Total provisions and payables | 4,257 | 3,812 | -445 |
| Total liabilities | 7,951 | 7,662 | -290 |
| Shares and other contributed capital | 9,617 | 9,923 | 307 |
| Net worth(c) | 9,617 | 9,923 | 307 |
| Net financial worth(d) | -4,565 | -4,249 | 316 |
| Net debt(e) | 2,187 | 2,858 | 671 |
(a) Excludes the impact of commercial taxation adjustments.
(b) From 2012‑13 FBO, loans are separated from other borrowing consistent with the General Government Sector.
(c) Under AASB 1049, net worth is calculated as total assets minus total liabilities. Under ABS GFS, net worth is calculated as total assets minus total liabilities minus shares and other contributed capital. The AASB 1049 method is used in this table.
(d) Under AASB 1049, net financial worth equals total financial assets minus total liabilities. Under ABS GFS, net financial worth equals total financial assets minus total liabilities minus shares and other contributed capital. The AASB 1049 method is used in this table.
(e) Net debt equals the sum of interest bearing liabilities (deposits held, advances received, loans and other borrowing), minus the sum of cash and deposits and investments, loans and placements.
| 2012‑13 Estimate at 2013‑14 Budget $m |
2012‑13 Outcome $m |
Change on 2013‑14 Budget $m | |
|---|---|---|---|
| Cash receipts from operating activities | |||
| Receipts from sales of goods and services | 9,901 | 9,556 | -346 |
| Grants and subsidies received | 0 | 4 | 4 |
| GST input credit receipts | 235 | 56 | -179 |
| Other receipts | 77 | 101 | 25 |
| Total operating receipts | 10,213 | 9,716 | -497 |
| Cash payments for operating activities | |||
| Payments to employees | -4,040 | -3,914 | 126 |
| Payments for goods and services | -5,053 | -5,323 | -270 |
| Interest paid | -60 | -72 | -12 |
| GST payments to taxation authority | -501 | -104 | 397 |
| Other payments | -93 | -71 | 22 |
| Total operating payments | -9,746 | -9,484 | 263 |
| Net cash flows from operating activities | 467 | 233 | -234 |
| Cash flows from investments in non-financial assets | |||
| Sales of non-financial assets | 34 | 50 | 15 |
| Purchases of non-financial assets | -3,099 | -3,284 | -184 |
| Net cash flows from investments in non-financial assets | -3,065 | -3,234 | -169 |
| Net cash flows from investments in financial assets for policy purposes | 138 | 0 | -138 |
| Cash flows from investments in financial assets for liquidity purposes | |||
| Increase in investments | -1,044 | -902 | 142 |
| Net cash flows from investments in financial assets for liquidity purposes | -1,044 | -902 | 142 |
| Net cash flows from financing activities | |||
| Borrowing (net) | 462 | 681 | 219 |
| Other financing (net) | 2,913 | 2,574 | -339 |
| Distributions paid (net) | -294 | -293 | 0 |
| Net cash flows from financing activities | 3,081 | 2,961 | -119 |
| Net increase/(decrease) in cash held | -424 | -941 | -518 |
| Cash at the beginning of the year | 1,832 | 1,832 | 0 |
| Cash at the end of the year | 1,409 | 891 | -518 |
| Net cash from operating activities and investments in non-financial assets | -2,599 | -3,001 | -402 |
| Distributions paid | -294 | -293 | 0 |
| Equals surplus(+)/deficit(-) | -2,892 | -3,294 | -402 |
| Finance leases and similar arrangements(b) | 0 | -1,074 | -1,074 |
| GFS cash surplus(+)/deficit(-) | -2,892 | -4,369 | -1,476 |
(a) A positive number denotes a cash inflow; a negative number denotes a cash outflow.
(b) The acquisition of assets under finance leases decreases the surplus or increases the deficit. The disposal of assets previously held under finance leases increases the surplus or decreases the deficit.
| 2012‑13 Estimate at 2013‑14 Budget $m |
2012‑13 Outcome $m |
Change on 2013‑14 Budget $m | |
|---|---|---|---|
| Revenue | |||
| Taxation revenue | 338,591 | 337,287 | -1,305 |
| Sales of goods and services | 16,391 | 16,252 | -139 |
| Interest income | 3,820 | 3,710 | -110 |
| Dividend income | 2,146 | 2,790 | 644 |
| Other | 6,285 | 7,267 | 982 |
| Total revenue | 367,233 | 367,306 | 73 |
| Expenses | |||
| Gross operating expenses | |||
| Wages and salaries(a) | 22,733 | 21,718 | -1,015 |
| Superannuation | 8,377 | 8,663 | 286 |
| Depreciation and amortisation | 6,736 | 7,033 | 297 |
| Supply of goods and services | 75,105 | 74,542 | -564 |
| Other operating expenses(a) | 5,883 | 6,250 | 367 |
| Total gross operating expenses | 118,834 | 118,205 | -630 |
| Superannuation interest expense | 6,778 | 6,729 | -49 |
| Interest expenses | 13,428 | 13,915 | 486 |
| Current transfers | |||
| Current grants | 109,950 | 110,535 | 585 |
| Subsidy expenses | 13,174 | 13,687 | 513 |
| Personal benefits | 117,397 | 117,221 | -176 |
| Total current transfers | 240,521 | 241,443 | 922 |
| Capital transfers | 9,923 | 10,051 | 128 |
| Total expenses | 389,484 | 390,342 | 858 |
| Net operating balance | -22,251 | -23,036 | -785 |
| Other economic flows | 7,485 | 69,281 | 61,796 |
| Comprehensive result - Total change in net worth | -14,766 | 46,245 | 61,011 |
| Net acquisition of non-financial assets | |||
| Purchases of non-financial assets | 10,013 | 11,832 | 1,820 |
| less Sales of non-financial assets | 3,694 | 1,838 | -1,856 |
| less Depreciation | 6,736 | 7,033 | 297 |
| plus Change in inventories | 386 | 1,017 | 631 |
| plus Other movements in non-financial assets | 1,190 | 647 | -543 |
| Total net acquisition of non-financial assets | 1,158 | 4,625 | 3,467 |
| Fiscal balance (Net lending/borrowing)(b) | -23,409 | -27,661 | -4,252 |
(a) Consistent with ABS GFS classification, other employee related expenses are reported under other operating expenses. Total employee expenses equal wages and salaries plus other operating expenses.
(b) The term fiscal balance is not used by the ABS.
| 2012‑13 Estimate at 2013‑14 Budget $m |
2012‑13 Outcome $m |
Change on 2013‑14 Budget $m | |
|---|---|---|---|
| Assets | |||
| Financial assets | |||
| Cash and deposits | 3,879 | 2,985 | -893 |
| Advances paid | 35,409 | 34,472 | -937 |
| Investments, loans and placements | 103,092 | 110,894 | 7,803 |
| Other receivables | 46,206 | 45,472 | -735 |
| Equity investments | 44,622 | 48,634 | 4,012 |
| Total financial assets | 233,207 | 242,458 | 9,250 |
| Non-financial assets | |||
| Land and fixed assets | 116,139 | 116,347 | 208 |
| Other non-financial assets | 8,327 | 7,900 | -427 |
| Total non-financial assets | 124,466 | 124,247 | -219 |
| Total assets | 357,673 | 366,704 | 9,031 |
| Liabilities | |||
| Interest bearing liabilities | |||
| Deposits held | 192 | 182 | -10 |
| Government securities | 292,845 | 285,748 | -7,097 |
| Loans | 8,304 | 15,772 | 7,468 |
| Other borrowing | 4,828 | 2,490 | -2,338 |
| Total interest bearing liabilities | 306,170 | 304,193 | -1,977 |
| Provisions and payables | |||
| Superannuation liability | 143,509 | 193,372 | 49,863 |
| Other employee liabilities | 16,395 | 16,037 | -358 |
| Other provisions and payables | 55,047 | 56,239 | 1,192 |
| Total provisions and payables | 214,951 | 265,648 | 50,697 |
| Total liabilities | 521,121 | 569,841 | 48,720 |
| Shares and other contributed capital | 9,617 | 9,923 | 307 |
| Net worth(a) | -163,448 | -203,136 | -39,689 |
| Net financial worth(b) | -287,913 | -327,383 | -39,470 |
| Net debt(c) | 163,790 | 155,841 | -7,950 |
(a) Under AASB 1049, net worth is calculated as total assets minus total liabilities. Under ABS GFS, net worth is calculated as total assets minus total liabilities minus shares and other contributed capital. The AASB 1049 method is used in this table.
(b) Under AASB 1049, net financial worth equals total financial assets minus total liabilities. Under ABS GFS, net financial worth equals total financial assets minus total liabilities minus shares and other contributed capital. The AASB 1049 method is used in this table.
(c) Net debt equals the sum of deposits held, government securities, loans and other borrowing, minus the sum of cash and deposits, advances paid and investments, loans and placements.
| 2012‑13 Estimate at 2013‑14 Budget $m |
2012‑13 Outcome $m |
Change on 2013‑14 Budget $m | |
|---|---|---|---|
| Cash receipts from operating activities | |||
| Taxes received | 326,206 | 326,195 | -11 |
| Receipts from sales of goods and services | 17,292 | 16,500 | -793 |
| Interest receipts | 3,729 | 3,627 | -102 |
| Dividends and income tax equivalents | 2,892 | 3,126 | 234 |
| Other receipts | 6,575 | 6,861 | 286 |
| Total operating receipts | 356,694 | 356,309 | -385 |
| Cash payments for operating activities | |||
| Payments to employees | -30,196 | -28,915 | 1,281 |
| Payments for goods and services | -76,522 | -75,198 | 1,324 |
| Grants and subsidies paid | -126,872 | -127,750 | -879 |
| Interest paid | -11,952 | -11,898 | 54 |
| Personal benefit payments | -116,257 | -116,629 | -373 |
| Other payments | -5,289 | -5,903 | -614 |
| Total operating payments | -367,087 | -366,293 | 794 |
| Net cash flows from operating activities | -10,393 | -9,984 | 409 |
| Cash flows from investments in non-financial assets | |||
| Sales of non-financial assets | 1,672 | 1,779 | 107 |
| Purchases of non-financial assets | -10,642 | -10,928 | -286 |
| Net cash flows from investments in non-financial assets | -8,970 | -9,149 | -178 |
| Net cash flows from investments in financial assets for policy purposes | -2,286 | -2,189 | 97 |
| Cash flows from investments in financial assets for liquidity purposes | |||
| Increase in investments | -4,777 | -7,099 | -2,321 |
| Net cash flows from investments in financial assets for liquidity purposes | -4,777 | -7,099 | -2,321 |
| Net cash flows from financing activities | |||
| Borrowing (net) | 27,483 | 28,666 | 1,182 |
| Other financing (net) | -1,534 | -1,617 | -83 |
| Net cash flows from financing activities | 25,949 | 27,049 | 1,100 |
| Net increase/(decrease) in cash held | -477 | -1,371 | -893 |
| Cash at the beginning of the year | 4,356 | 4,356 | 0 |
| Cash at the end of the year | 3,879 | 2,985 | -893 |
| Net cash from operating activities and investments in non-financial assets | -19,363 | -19,132 | 231 |
| Distributions paid | 0 | 0 | 0 |
| Equals surplus(+)/deficit(-) | -19,363 | -19,132 | 231 |
| Finance leases and similar arrangements(b) | -404 | -1,388 | -984 |
| GFS cash surplus(+)/deficit(-) | -19,768 | -20,521 | -753 |
(a) A positive number denotes a cash inflow; a negative number denotes a cash outflow.
(b) The acquisition of assets under finance leases decreases the surplus or increases the deficit. The disposal of assets previously held under finance leases increases the surplus or decreases the deficit.
| 2012‑13 Outcome $m | |
|---|---|
| Revenue | |
| Current grants and subsidies | 170 |
| Sales of goods and services | 6,140 |
| Interest income | 1,842 |
| Other | 90 |
| Total revenue | 8,242 |
| Expenses | |
| Gross operating expenses | |
| Wages and salaries(a) | 874 |
| Superannuation | 129 |
| Depreciation and amortisation | 66 |
| Other operating expenses(a) | 5,438 |
| Total gross operating expenses | 6,507 |
| Interest expenses | 782 |
| Other property expenses | 677 |
| Current transfers | |
| Tax expenses | 73 |
| Total current transfers | 73 |
| Total expenses | 8,039 |
| Net operating balance | 202 |
| Other economic flows | 3,162 |
| Comprehensive result - Total change in net worth excluding contribution from owners | 3,364 |
| Net acquisition of non-financial assets | |
| Purchases of non-financial assets | 25 |
| less Sales of non-financial assets | 1 |
| less Depreciation | 66 |
| plus Change in inventories | -12 |
| plus Other movements in non-financial assets | 3 |
| Total net acquisition of non-financial assets | -51 |
| Fiscal balance (Net lending/borrowing)(b) | 253 |
(a) Consistent with ABS GFS classification, other employee related expenses are reported under other operating expenses. Total employee expenses equal wages and salaries plus other operating expenses.
(b) The term fiscal balance is not used by the ABS.
| 2012‑13 Outcome $m | |
|---|---|
| Assets | |
| Financial assets | |
| Cash and deposits | 1,095 |
| Investments, loans and placements | 102,796 |
| Other receivables | 571 |
| Equity investments | 740 |
| Total financial assets | 105,201 |
| Non-financial assets | |
| Land and other fixed assets | 999 |
| Other non-financial assets(a) | 54 |
| Total non-financial assets | 1,053 |
| Total assets | 106,255 |
| Liabilities | |
| Interest bearing liabilities | |
| Deposits held | 83,126 |
| Borrowing | 7,596 |
| Total interest bearing liabilities | 90,723 |
| Provisions and payables | |
| Superannuation liability | 30 |
| Other employee liabilities | 1,311 |
| Other provisions and payables(a) | 2,059 |
| Total provisions and payables | 3,400 |
| Total liabilities | 94,122 |
| Shares and other contributed capital | 12,132 |
| Net worth(b) | 12,132 |
| Net financial worth(c) | 11,079 |
| Net debt(d) | -13,168 |
(a) Excludes the impact of commercial taxation adjustments.
(b) Under AASB 1049, net worth is calculated as total assets minus total liabilities. Under ABS GFS, net worth is calculated as total assets minus total liabilities minus shares and other contributed capital. The AASB 1049 method is used in this table.
(c) Under AASB 1049, net financial worth equals total financial assets minus total liabilities. Under ABS GFS, net financial worth equals total financial assets minus total liabilities minus shares and other contributed capital. The AASB 1049 method is used in this table.
(d) Net debt equals the sum of deposits held, advances received and borrowing, minus the sum of cash and deposits, advances paid and investments, loans and placements.
| 2012‑13 Outcome $m | |
|---|---|
| Cash receipts from operating activities | |
| Receipts from sales of goods and services | 5,893 |
| Grants and subsidies received | 170 |
| GST input credit receipts | 18 |
| Interest receipts | 1,898 |
| Other receipts | 76 |
| Total operating receipts | 8,055 |
| Cash payments for operating activities | |
| Payments to employees | -669 |
| Payments for goods and services | -4,796 |
| Interest paid | -838 |
| GST payments to taxation authority | 0 |
| Other payments | -1,002 |
| Total operating payments | -7,305 |
| Net cash flows from operating activities | 749 |
| Cash flows from investments in non-financial assets | |
| Sales of non-financial assets | 1 |
| Purchases of non-financial assets | -26 |
| Net cash flows from investments in non-financial assets | -24 |
| Net cash flows from investments in financial assets for policy purposes | 0 |
| Cash flows from investments in financial assets for liquidity purposes | |
| Increase in investments | -10,757 |
| Net cash flows from investments in financial assets for liquidity purposes | -10,757 |
| Net cash flows from financing activities | |
| Advances received (net) | 0 |
| Borrowing (net) | 7,966 |
| Deposits received (net) | 0 |
| Other financing (net) | 3,341 |
| Distributions paid (net) | -1,082 |
| Net cash flows from financing activities | 10,224 |
| Net increase/(decrease) in cash held | 192 |
| Cash at the beginning of the year | 903 |
| Cash at the end of the year | 1,095 |
| Net cash from operating activities and investments in non-financial assets | 725 |
| Distributions paid | -1,082 |
| Equals surplus(+)/deficit(-) | -357 |
| Finance leases and similar arrangements(b) | 0 |
| GFS cash surplus(+)/deficit(-) | -357 |
(a) A positive number denotes a cash inflow; a negative number denotes a cash outflow.
(b) The acquisition of assets under finance leases decreases the surplus or increases the deficit. The disposal of assets previously held under finance leases increases the surplus or decreases the deficit.
| 2012‑13 Estimate at 2013‑14 Budget $m |
2012‑13 Outcome $m |
Change on 2013‑14 Budget $m | |
|---|---|---|---|
| General public services | 445 | 969 | 524 |
| Defence | 4,920 | 5,068 | 148 |
| Public order and safety | 439 | 377 | -62 |
| Education | 38 | 40 | 2 |
| Health | 103 | 62 | -41 |
| Social security and welfare | 277 | 369 | 93 |
| Housing and community amenities | 160 | 56 | -103 |
| Recreation and culture | 326 | 261 | -65 |
| Fuel and energy | -4 | 6 | 10 |
| Agriculture, forestry and fishing | 150 | 310 | 161 |
| Mining, manufacturing and construction | 29 | 8 | -21 |
| Transport and communication | 77 | 64 | -13 |
| Other economic affairs | 574 | 455 | -119 |
| Other purposes | -6 | 0 | 6 |
| Total Government purchases of non-financial assets | 7,528 | 8,046 | 518 |
Notes to the general government sector financial statements
Note 1: External reporting standards and accounting policies
The Charter of Budget Honesty Act 1998 (the Charter) requires that the final budget outcome be based on external reporting standards and that departures from applicable external reporting standards be identified.
The external standards used for final budget outcome reporting purposes are:
- the Australian Bureau of Statistics' (ABS) accrual Government Finance Statistics (GFS) publication, Australian System of Government Finance Statistics: Concepts, Sources and Methods, (cat. no. 5514.0), which in turn is based on the International Monetary Fund (IMF) accrual GFS framework; and
- the Australian Accounting Standards (AAS) issued by the Australian Accounting Standards Board (AASB), which includes International Financial Reporting Standards (IFRS) as adopted in Australia and the public sector specific standard AASB 1049 Whole of Government and General Government Sector Financial Reporting.
The financial statements have been prepared on an accrual basis that complies with both ABS GFS and AAS, except for departures disclosed at Note 2.
A more detailed description of the AAS and ABS GFS frameworks, in addition to definitions of key terms used in these frameworks, can be found in Attachment A. Table 22 in Attachment A explains the key differences between the two frameworks. Detailed accounting policies, as required by AAS, are disclosed in the annual consolidated financial statements.
Fiscal reporting focuses on the general government sector (GGS). The GGS provides public services that are mainly non‑market in nature and for the collective consumption of the community, or involve the transfer or redistribution of income. These services are largely financed through taxes and other compulsory levies, user charging and external funding. This sector comprises all government departments, offices and some other bodies. In preparing financial statements for the GGS, all material transactions and balances between entities within the GGS have been eliminated. A list of entities within the GGS, as well as entities within and a description of the public non‑financial corporations (PNFC) sector and the public financial corporations (PFC) sector, are disclosed in Table 21 of Attachment A.
The statements for the GGS are based on audit‑cleared financial statements for the material agencies, with the exception of the Department of Defence and the Department of Veterans' Affairs.
The Government's key fiscal aggregates are based on ABS GFS concepts and definitions, including the ABS GFS cash surplus/deficit and the derivation of the underlying cash balance and net financial worth. AASB 1049 requires the disclosure of other ABS GFS fiscal aggregates, including net operating balance, net lending/borrowing (fiscal balance) and net worth. In addition to these ABS GFS aggregates, the Uniform Presentation Framework (UPF) requires disclosure of net debt, net financial worth and net financial liabilities.
Note 2: Departures from external reporting standards
The Charter requires that departures from applicable external reporting standards be identified. The financial statements depart from the external reporting standards as follows.
General government sector
Departures from ABS GFS
ABS GFS requires that provisions for bad and doubtful debts be excluded from the balance sheet. This treatment has not been adopted in the financial statements because excluding such provisions would overstate the value of Australian Government assets in the balance sheet. The financial statements currently adopt AAS treatment for provisions for bad and doubtful debts.
ABS GFS treats coins on issue as a liability and no revenue is recognised. The ABS GFS treatment of circulating coins as a liability has not been adopted in the financial statements. Instead, the financial statements adopt AAS treatment for circulating coins (seigniorage). Under this treatment, seigniorage revenue is recognised upon the issue of coins and no liability is recorded.
ABS GFS records defence weapons platforms (DWP) as a non‑financial asset on a market value basis (fair value), rather than expensing at time of acquisition. The value used by the ABS is consistent with the National Accounts statistical methodology, and represents an early adoption of changes to the System of National Accounts 2008. ABS GFS treatment of DWP is consistent with AAS, as non‑financial assets can be valued at fair value as long as they can be reliably measured, otherwise cost is permissible. DWP will be valued at cost in the financial statements, as they have in previous budgets, while the Australian Government ascertains if a relevant and reliable fair value can be sourced.
Under ABS GFS, concessional loans are recognised at their nominal value, that is, they are not discounted to fair (market) value as there is not considered to be a secondary market. This treatment has not been adopted for the financial statements. Consistent with AAS, loans issued at below market interest rates or with long repayment periods are recorded at fair value (by discounting them by market interest rates). The difference between the nominal value and the fair value of the loan is recorded as an expense that is written back over the life of the loan.
ABS GFS requires investments in unlisted public sector entities to be valued based on their net assets. Under AAS, investments in public sector entities can be valued at fair value as long as a fair value can be reliably measured, otherwise net assets is permissible. The AAS treatment has been adopted in the financial statements.
Movements in the provision for restoration, decommissioning and make‑good of assets have been included in the calculation of the fiscal balance capital adjustment because in many cases they involve legal obligations to expend resources. ABS GFS does not recognise adjustments for such provisions because they are considered a constructive obligation that may not materialise for many years.
ABS GFS treats the issuance and registration of Renewable Energy Certificates (RECs) under the Renewable Energy Target and Australian Carbon Credit Units (ACCUs) under the Carbon Farming Initiative as government financial transactions resulting in the recognition of assets, liabilities, tax revenue and expenses.
Under the interpretation of the AAS, issuance and registration of such certificates is considered to be an administrative function and does not result in the recognition of an asset or liability and therefore no tax revenue or expense is recognised. The AAS treatment has been adopted in the financial statements.
Departures from AAS
AAS requires the advances paid to the International Development Association, African Development Fund and Asian Development Fund to be recognised at fair value. Under ABS GFS these advances are recorded at nominal value. The ABS GFS treatment is adopted in the financial statements.
Under AAS, prepayments are classified as non‑financial assets. In accordance with ABS GFS, prepayments have been classified as financial assets in the financial statements. This treatment is consistent with the exclusion of prepayments from net acquisition of non‑financial assets in the calculation of the fiscal balance.
In 2012‑13, during the first year of the fixed price period, the price of carbon units was set under the Clean Energy Act 2011. A preliminary interpretation based on the AASB issued staff paper recognises transactions under the carbon pricing mechanism in the financial statements where they are expected to result in a receipt or payment of cash by the government at the amount of the expected cash settlement. The issuance and surrender of free carbon units and ACCUs used in the settlement of emissions liabilities do not qualify for recognition by the government as assets, liabilities, revenues or expenses. The audited accounts of the Clean Energy Regulator apply the AAS treatment.
The published outcome for carbon pricing mechanism revenue adopts the ABS GFS treatment as used in the 2013‑14 Budget. Under ABS GFS, the issuance of free carbon units that are expected to be used to settle an emitter's obligation are treated as an expense on issue and revenue when emissions occur. The ABS GFS outcome was derived by adjusting the AAS revenue and expense from the audited accounts of the Clean Energy Regulator, which includes AAS revenue of $5,047 million, for free carbon units. This adjustment had no net impact on the fiscal balance.
AASB 1049 requires disaggregated information, by ABS GFS function, for expenses and total assets to be disclosed where they are reliably attributable. ABS GFS does not require total assets to be attributed to functions. In accordance with ABS GFS, disaggregated information for expenses and net acquisition of non‑financial assets by function is disclosed in Part 1. In accordance with the UPF, purchases of non‑financial assets by function are also disclosed.
AASB 1049 requires AAS measurement of items to be disclosed on the face of the financial statements with reconciliation to ABS GFS measurement of items, where different, in notes to the financial statements. Differences from the AAS measurement of items outlined above and reconciliation have not been included as they would effectively create different measures of the same aggregate.
AASB 1049 requires major variances between original budget estimates and outcomes to be explained in the financial statements. Explanations of major variances for the 2012‑13 year from the 2012‑13 Budget to the 2012‑13 Mid‑Year Economic and Fiscal Outlook (MYEFO) are discussed in Part 3 of the 2012‑13 MYEFO. Explanations of variances for the 2012‑13 year from MYEFO to the 2013‑14 Budget are disclosed in Statement 3 of 2013‑14 Budget Paper No. 1, Budget Strategy and Outlook. Explanations of variances from the 2013‑14 Budget to the Final Budget Outcome 2012‑13 are disclosed in Part 1.
All decisions taken between the original budget and MYEFO are disclosed in Appendix A of the Mid‑Year Economic and Fiscal Outlook 2012‑13. Decisions taken from MYEFO to the 2013‑14 Budget are disclosed in 2013‑14 Budget Paper No. 2, Budget Measures. In addition, 2013‑14 Budget Paper No. 1, Budget Strategy and Outlook contains detailed discussion on the estimates of revenue (Statement 5), expenses (Statement 6) and assets and liabilities (Statement 7).
AASB 1049 also requires the Final Budget Outcome (FBO) and Consolidated Financial Statements (CFS) to be released at the same time. The Charter requires the FBO to be released before the end of three months after the end of the financial year, whereas the CFS is not released until it is audit‑cleared, generally around November each year.
In addition to above adjustments, there are specific adjustments made to the corporations sectors as outlined below.
Public non‑financial corporations (PNFC) sector, public financial corporations (PFC) sector and total non‑financial public sector (NFPS)
Departures from ABS GFS
AASB 1049 defines net worth for the PNFC sector, PFC sector and NFPS as total assets less total liabilities; however, ABS GFS defines net worth as total assets less total liabilities less shares and contributed capital (which is equal to zero for the PNFC and PFC sectors). Similarly, AASB 1049 defines net financial worth for these sectors as financial assets less total liabilities, whereas under ABS GFS it is equal to financial assets less total liabilities less shares and contributed capital. The AASB 1049 treatment has been adopted in the PNFC sector, PFC sector and NFPS financial statements.
Departures from AAS
The financial statements for the PNFC sector, PFC sector and NFPS comply with the UPF but do not include all the line item disclosures required by AASB 1049. Disaggregated outcome notes for the PFC and PNFC sectors will be disclosed in the consolidated financial statements.
AAS requires dividends paid to be classified as a distribution of equity. Under ABS GFS, dividends paid are classified as an expense. The ABS GFS treatment has been adopted for use in the financial statements.
Australian Government public corporations use commercial tax effect accounting to determine their net tax liability while the ATO determines their tax liability on a due and payable basis. To ensure symmetry in treatment between Australian Government sectors, the ABS removes tax effect adjustments. The ABS GFS treatment has been adopted in the financial statements.
| 2012‑13 Estimate at 2013‑14 Budget $m |
2012‑13 Outcome $m |
Change on 2013‑14 Budget $m | |
|---|---|---|---|
| Individuals' and other withholding taxes | |||
| Gross income tax withholding | 151,660 | 151,069 | -591 |
| Gross other individuals | 35,940 | 36,283 | 343 |
| less: Refunds | 26,750 | 26,801 | 51 |
| Total individuals' and other withholding taxation | 160,850 | 160,551 | -299 |
| Fringe benefits tax | 3,890 | 3,971 | 81 |
| Company tax | 68,132 | 68,208 | 75 |
| Superannuation funds | 7,800 | 7,581 | -219 |
| Resource rent taxes(a) | 1,740 | 1,927 | 187 |
| Income taxation revenue | 242,412 | 242,238 | -174 |
| Sales taxes | |||
| Goods and services tax | 50,220 | 50,313 | 93 |
| Wine equalisation tax | 730 | 716 | -14 |
| Luxury car tax | 430 | 432 | 2 |
| Total sales taxes | 51,380 | 51,462 | 82 |
| Excise duty | |||
| Petrol | 6,000 | 6,079 | 79 |
| Diesel | 8,610 | 8,640 | 30 |
| Beer | 1,950 | 1,958 | 8 |
| Other excisable products(b) | 9,030 | 9,033 | 3 |
| Of which: Other excisable beverages(c) | 900 | 914 | 14 |
| Total excise duty revenue | 25,590 | 25,710 | 120 |
| Customs duty | |||
| Textiles, clothing and footwear | 680 | 676 | -4 |
| Passenger motor vehicles | 920 | 892 | -28 |
| Excise-like goods | 5,660 | 5,458 | -202 |
| Other imports | 1,540 | 1,500 | -40 |
| less: Refunds and drawbacks | 330 | 354 | 24 |
| Total customs duty revenue | 8,470 | 8,172 | -298 |
| Carbon pricing mechanism(d) | 7,540 | 6,535 | -1,005 |
| Other indirect taxation | |||
| Agricultural levies | 463 | 476 | 12 |
| Other taxes | 2,871 | 2,730 | -141 |
| Total other indirect taxation revenue | 3,335 | 3,206 | -129 |
| Mirror taxes | 485 | 484 | 0 |
| less Transfers to States in relation to mirror tax revenue | 485 | 484 | 0 |
| Mirror tax revenue | 0 | 0 | 0 |
| Indirect taxation revenue | 96,315 | 95,085 | -1,229 |
| Taxation revenue | 338,727 | 337,323 | -1,403 |
| Memorandum: | |||
| Medicare levy revenue | 9,720 | 9,788 | 68 |
(a) Comprises gross revenue from the PRRT and MRRT. Net revenue from the MRRT was $0.2 billion in 2012‑13 which represents the net impact across different revenue heads. These include offsetting reductions in company tax (through deductibility) and interactions with other taxes.
(b) Tobacco figures are not separately reported because of taxpayer confidentiality. Since the 2013‑14 Budget was published, legislation has been passed that allows for separate reporting of tobacco figures. As the legislation was not retrospective, this does not apply to the 2012‑13 outcome.
(c) Other excisable beverages are those not exceeding 10 per cent by volume of alcohol (excluding beer, brandy and wine).
(d) Tax revenue includes carbon accrual revenue measured at the legislated price, with details of the accounting treatment of carbon revenue set out in Note 2 to the General Government Sector Financial Statements.
| 2012‑13 Estimate at 2013‑14 Budget $m |
2012‑13 Outcome $m |
Change on 2013‑14 Budget $m | |
|---|---|---|---|
| Taxes on income, profits and capital gains | |||
| Income and capital gains levied on individuals | 164,740 | 164,529 | -211 |
| Income and capital gains levied on enterprises | 77,672 | 77,709 | 37 |
| Total taxes on income, profits and capital gains | 242,412 | 242,238 | -174 |
| Taxes on employers' payroll and labour force | 529 | 646 | 117 |
| Taxes on the provision of goods and services | |||
| Sales/goods and services tax | 51,380 | 51,462 | 82 |
| Excises and levies | 26,053 | 26,186 | 133 |
| Taxes on international trade | 8,470 | 8,172 | -298 |
| Total taxes on the provision of goods and services | 85,903 | 85,820 | -83 |
| Other sale of goods and services | 9,882 | 8,618 | -1,264 |
| Total taxation revenue | 338,727 | 337,323 | -1,403 |
| Memorandum: | |||
| Medicare levy revenue | 9,720 | 9,788 | 68 |
| 2012‑13 Estimate at 2013‑14 Budget $m |
2012‑13 Outcome $m |
Change on 2013‑14 Budget $m | |
|---|---|---|---|
| Sales of goods | 1,492 | 1,283 | -209 |
| Rendering of services | 4,031 | 3,878 | -153 |
| Operating lease rental | 53 | 46 | -6 |
| Fees from regulatory services | 3,182 | 3,679 | 497 |
| Total sales of goods and services revenue | 8,757 | 8,886 | 129 |
| 2012‑13 Estimate at 2013‑14 Budget $m |
2012‑13 Outcome $m |
Change on 2013‑14 Budget $m | |
|---|---|---|---|
| Interest from other governments | |||
| State and Territory debt | 10 | 10 | 1 |
| Local Government | 0 | 1 | 1 |
| Housing agreements | 160 | 139 | -21 |
| Total interest from other governments | 170 | 150 | -20 |
| Interest from other sources | |||
| Advances | 44 | 42 | -2 |
| Deposits | 100 | 131 | 31 |
| Bank deposits | 157 | 181 | 24 |
| Indexation of HELP receivable and other student loans | 503 | 377 | -126 |
| Other | 2,790 | 2,763 | -27 |
| Total interest from other sources | 3,594 | 3,495 | -99 |
| Total interest | 3,764 | 3,646 | -119 |
| Dividends | |||
| Dividends from other public sector entities | 691 | 972 | 281 |
| Other dividends | 1,739 | 2,107 | 369 |
| Total dividends | 2,429 | 3,079 | 650 |
| Total interest and dividend revenue | 6,194 | 6,725 | 531 |
| 2012‑13 Estimate at 2013‑14 Budget $m |
2012‑13 Outcome $m |
Change on 2013‑14 Budget $m | |
|---|---|---|---|
| Industry contributions | 39 | 56 | 17 |
| Royalties | 1,785 | 1,798 | 13 |
| Seigniorage | 136 | 134 | -2 |
| Other | 4,324 | 5,238 | 914 |
| Total other sources of non-taxation revenue | 6,284 | 7,226 | 942 |
| 2012‑13 Estimate at 2013‑14 Budget $m |
2012‑13 Outcome $m |
Change on 2013‑14 Budget $m | |
|---|---|---|---|
| Wages and salaries expenses | 19,355 | 18,486 | -869 |
| Other operating expenses | |||
| Leave and other entitlements | 2,514 | 2,624 | 109 |
| Separations and redundancies | 126 | 261 | 135 |
| Workers compensation premiums and claims | 700 | 843 | 143 |
| Other | 2,072 | 1,977 | -95 |
| Total other operating expenses | 5,411 | 5,705 | 293 |
| Superannuation expenses | |||
| Superannuation | 8,102 | 8,402 | 300 |
| Superannuation interest cost | 6,778 | 6,729 | -49 |
| Total superannuation expenses | 14,880 | 15,131 | 251 |
| Total employee and superannuation expense | 39,646 | 39,322 | -324 |
| 2012‑13 Estimate at 2013‑14 Budget $m |
2012‑13 Outcome $m |
Change on 2013‑14 Budget $m | |
|---|---|---|---|
| Depreciation | |||
| Specialist military equipment | 2,579 | 2,688 | 109 |
| Buildings | 1,273 | 1,351 | 78 |
| Other infrastructure, plant and equipment | 1,320 | 1,430 | 111 |
| Heritage and cultural assets | 36 | 50 | 14 |
| Total depreciation | 5,208 | 5,520 | 312 |
| Total amortisation | 815 | 879 | 64 |
| Total depreciation and amortisation expense | 6,022 | 6,398 | 376 |
| 2012‑13 Estimate at 2013‑14 Budget $m |
2012‑13 Outcome $m |
Change on 2013‑14 Budget $m | |
|---|---|---|---|
| Supply of goods and services | 22,931 | 22,277 | -654 |
| Operating lease rental expenses | 2,518 | 2,626 | 108 |
| Personal benefits - indirect | 39,671 | 39,283 | -388 |
| Health care payments | 5,391 | 5,214 | -177 |
| Other | 1,509 | 2,216 | 707 |
| Total supply of goods and services expense | 72,019 | 71,616 | -403 |
| 2012‑13 Estimate at 2013‑14 Budget $m |
2012‑13 Outcome $m |
Change on 2013‑14 Budget $m | |
|---|---|---|---|
| Interest on debt | |||
| Government securities | 12,200 | 12,225 | 25 |
| Loans | 9 | 10 | 1 |
| Other | 550 | 533 | -17 |
| Total interest on debt | 12,759 | 12,769 | 9 |
| Other financing costs | 521 | 1,000 | 478 |
| Total interest expense | 13,281 | 13,768 | 488 |
| 2012‑13 Estimate at 2013‑14 Budget $m |
2012‑13 Outcome $m |
Change on 2013‑14 Budget $m | |
|---|---|---|---|
| Current grants expense | |||
| State and Territory governments | 84,585 | 84,869 | 284 |
| Local governments | 34 | 16 | -18 |
| Private sector | 1,752 | 1,799 | 46 |
| Overseas | 4,115 | 4,086 | -30 |
| Non-profit organisations(a)(b) | 1,740 | 3,132 | 1,392 |
| Multi-jurisdictional sector(a) | 9,408 | 9,108 | -299 |
| Other(b) | 8,316 | 7,524 | -791 |
| Total current grants expense | 109,950 | 110,535 | 585 |
| Capital grants expense | |||
| Mutually agreed write-downs | 1,997 | 2,162 | 166 |
| Other capital grants | |||
| State and Territory governments | 6,931 | 7,032 | 101 |
| Local governments | 407 | 406 | -1 |
| Private sector | 150 | 48 | -102 |
| Multi-jurisdictional sector | 95 | 92 | -3 |
| Other | 344 | 311 | -33 |
| Total capital grants expense | 9,923 | 10,051 | 128 |
| Total grants expense | 119,873 | 120,586 | 713 |
(a) Includes reallocation of some programs between grants to non‑profit organisations and grants to the multi‑jurisdictional sector since the 2013‑14 Budget.
(b) Includes reallocation of some programs between grants to non‑profit organisations and grants to other since the 2013‑14 Budget.
| 2012‑13 Estimate at 2013‑14 Budget $m |
2012‑13 Outcome $m |
Change on 2013‑14 Budget $m | |
|---|---|---|---|
| Social welfare - assistance to the aged | 37,282 | 37,164 | -118 |
| Assistance to veterans and dependants | 6,202 | 6,085 | -116 |
| Assistance to people with disabilities | 21,204 | 21,386 | 182 |
| Assistance to families with children | 34,328 | 34,176 | -152 |
| Assistance to the unemployed | 8,559 | 8,518 | -42 |
| Student assistance | 3,349 | 3,460 | 111 |
| Other welfare programs | 1,396 | 1,311 | -85 |
| Financial and fiscal affairs | 359 | 352 | -7 |
| Vocational and industry training | 274 | 277 | 3 |
| Other | 4,444 | 4,492 | 49 |
| Total personal benefits expense | 117,397 | 117,221 | -176 |
| 2012‑13 Estimate at 2013‑14 Budget $m |
2012‑13 Outcome $m |
Change on 2013‑14 Budget $m | |
|---|---|---|---|
| Advances paid | |||
| Loans to State and Territory governments | 2,805 | 2,486 | -319 |
| Higher Education Loan Program | 22,349 | 21,575 | -774 |
| Student Financial Supplement Scheme | 653 | 677 | 24 |
| Other | 9,628 | 9,759 | 130 |
| less Provision for doubtful debts | 26 | 24 | -2 |
| Total advances paid | 35,409 | 34,472 | -937 |
| Other receivables | |||
| Goods and services receivable | 976 | 782 | -194 |
| Recoveries of benefit payments | 2,940 | 3,242 | 302 |
| Taxes receivable | 22,344 | 20,491 | -1,852 |
| Prepayments | 2,439 | 2,463 | 24 |
| Other | 19,131 | 20,291 | 1,160 |
| less Provision for doubtful debts | 3,366 | 3,189 | -177 |
| Total other receivables | 44,464 | 44,080 | -384 |
| 2012‑13 Estimate at 2013‑14 Budget $m |
2012‑13 Outcome $m |
Change on 2013‑14 Budget $m | |
|---|---|---|---|
| Investments - deposits | 30,103 | 32,455 | 2,352 |
| IMF quota | 4,830 | 5,247 | 417 |
| Other | 68,345 | 73,395 | 5,051 |
| Total investments, loans and placements | 103,278 | 111,098 | 7,820 |
| 2012‑13 Estimate at 2013‑14 Budget $m |
2012‑13 Outcome $m |
Change on 2013‑14 Budget $m | |
|---|---|---|---|
| Land and buildings | |||
| Land | 8,680 | 8,918 | 237 |
| Buildings | 23,433 | 23,500 | 67 |
| Total land and buildings | 32,113 | 32,418 | 305 |
| Plant, equipment and infrastructure | |||
| Specialist military equipment | 40,794 | 40,306 | -488 |
| Other | 12,911 | 12,610 | -301 |
| Total plant, equipment and infrastructure | 53,705 | 52,916 | -788 |
| Inventories | |||
| Inventories held for sale | 1,144 | 1,183 | 39 |
| Inventories not held for sale | 6,173 | 6,745 | 571 |
| Total inventories | 7,318 | 7,928 | 610 |
| Intangibles | |||
| Computer software | 3,402 | 3,579 | 176 |
| Other | 2,199 | 2,056 | -143 |
| Total intangibles | 5,602 | 5,635 | 34 |
| Total investment properties | 182 | 195 | 14 |
| Total biological assets | 37 | 33 | -4 |
| Total heritage and cultural assets | 10,451 | 10,547 | 96 |
| Total assets held for sale | 83 | 110 | 28 |
| Total other non-financial assets | 795 | 292 | -503 |
| Total non-financial assets | 110,284 | 110,074 | -210 |
| 2012‑13 Estimate at 2013‑14 Budget $m |
2012‑13 Outcome $m |
Change on 2013‑14 Budget $m | |
|---|---|---|---|
| Promissory notes | 3,176 | 3,167 | -9 |
| Special drawing rights | 4,586 | 4,999 | 413 |
| Other | 827 | 5,401 | 4,574 |
| Total loans | 8,588 | 13,567 | 4,979 |
| 2012‑13 Estimate at 2013‑14 Budget $m |
2012‑13 Outcome $m |
Change on 2013‑14 Budget $m | |
|---|---|---|---|
| Total superannuation liability(a) | 143,509 | 193,314 | 49,804 |
| Other employee liabilities | |||
| Leave and other entitlements | 7,378 | 7,397 | 19 |
| Accrued salaries and wages | 628 | 654 | 27 |
| Workers compensation claims | 2,594 | 3,087 | 493 |
| Separations and redundancies | 63 | 100 | 37 |
| Other | 3,936 | 3,558 | -378 |
| Total other employee liabilities | 14,600 | 14,798 | 198 |
| Total employee and superannuation liabilities | 158,109 | 208,111 | 50,002 |
(a) For budget reporting purposes, a discount rate applied by actuaries in preparing Long‑Term Cost Reports is used to value the superannuation liability. This reduces the volatility in reported liabilities that would occur from year to year if the long‑term government bond rate were used. Consistent with AAS, the long‑term government bond rate as at 30 June is used to calculate the superannuation liability for the purpose of actuals reporting.
| 2012‑13 Estimate at 2013‑14 Budget $m |
2012‑13 Outcome $m |
Change on 2013‑14 Budget $m | |
|---|---|---|---|
| Suppliers payable | |||
| Trade creditors | 3,744 | 4,009 | 265 |
| Operating lease rental payable | 202 | 209 | 8 |
| Other creditors | 318 | 2,191 | 1,873 |
| Total suppliers payable | 4,264 | 6,409 | 2,145 |
| Total personal benefits provisions and payable | 14,240 | 14,161 | -79 |
| Total subsidies provisions and payable | 3,216 | 3,557 | 342 |
| Grants provisions and payable | |||
| State and Territory governments | 339 | 807 | 468 |
| Non-profit organisations | 218 | 112 | -106 |
| Private sector | 488 | 393 | -96 |
| Overseas | 1,502 | 1,390 | -112 |
| Local governments | 7 | 12 | 5 |
| Other | 14,476 | 13,519 | -957 |
| Total grants provisions and payable | 17,030 | 16,233 | -797 |
| Other provisions and payables | |||
| Provisions for tax refunds | 2,970 | 3,391 | 420 |
| Other | 10,991 | 10,992 | 2 |
| Total other provisions and payables | 13,961 | 14,383 | 422 |
| 2012‑13 Estimate at 2013‑14 Budget $m |
2012‑13 Outcome $m |
Change on 2013‑14 Budget $m | |
|---|---|---|---|
| Operating balance (revenues less expenses) | -21,478 | -22,485 | -1,007 |
| less Revenues not providing cash | |||
| Other | 735 | 559 | -176 |
| Total revenues not providing cash | 735 | 559 | -176 |
| plus Expenses not requiring cash | |||
| Increase / (decrease) in employee entitlements | 8,184 | 7,882 | -302 |
| Depreciation / amortisation expense | 6,046 | 6,429 | 383 |
| Mutually agreed write-downs | 1,997 | 2,162 | 166 |
| Other | 90 | 361 | 271 |
| Total expenses not requiring cash | 16,317 | 16,834 | 517 |
| plus Cash provided / (used) by working capital items | |||
| Decrease / (increase) in inventories | -260 | -797 | -537 |
| Decrease / (increase) in receivables | -8,501 | -8,317 | 185 |
| Decrease / (increase) in other financial assets | 1,280 | 921 | -358 |
| Decrease / (increase) in other non-financial assets | 64 | 32 | -31 |
| Increase / (decrease) in benefits, subsidies and grants payable | 4,212 | 4,786 | 574 |
| Increase / (decrease) in suppliers' liabilities | -757 | 107 | 865 |
| Increase / (decrease) in other provisions and payables | -706 | -447 | 259 |
| Net cash provided / (used) by working capital | -4,670 | -3,714 | 956 |
| equals (Net cash from / (to) operating activities) | -10,566 | -9,924 | 643 |
| plus (Net cash from / (to) investing activities) | -14,926 | -16,913 | -1,987 |
| Net cash from operating activities and investment | -25,492 | -26,837 | -1,344 |
| plus (Net cash from / (to) financing activities) | 25,439 | 26,407 | 969 |
| equals Net increase / (decrease) in cash | -54 | -429 | -376 |
| Cash at the beginning of the year | 2,523 | 2,523 | 0 |
| Net increase / (decrease) in cash | -54 | -429 | -376 |
| Cash at the end of the year | 2,470 | 2,094 | -376 |
| 2012‑13 Estimate at 2013‑14 Budget $m |
2012‑13 Outcome $m |
Change on 2013‑14 Budget $m | |
|---|---|---|---|
| Total general government sector cash | 2,470 | 2,094 | -376 |
| less CAC Agency cash balances | 1,800 | 1,952 | 152 |
| plus Special public monies | 382 | 311 | -71 |
| Balance of Consolidated Revenue Fund at 30 June | 1,052 | 453 | -599 |
The cash balances reflected in the balance sheet for the Australian Government GGS (Table 9) include the reported cash balances controlled and administered by Australian Government agencies subject to the Financial Management and Accountability Act 1997, and the reported cash balances controlled and administered by entities subject to the Commonwealth Authorities and Companies Act 1997 (CAC Act), that implement public policy through the provision of primarily non‑market services.
Revenues or monies raised by the Executive Government automatically form part of the Consolidated Revenue Fund by force of section 81 of the Australian Constitution. For practical purposes, total Australian Government GGS cash, less cash controlled and administered by CAC Act entities, plus special public monies, represents the Consolidated Revenue Fund referred to in section 81 of the Australian Constitution. On this basis, the balance of the Consolidated Revenue Fund is shown above.
Financial reporting standards and budget concepts
The Charter of Budget Honesty Act 1998 (the Charter) requires the Final Budget Outcome (FBO) to be based on external reporting standards.
The Government has produced a single set of financial statements that comply with both ABS GFS and AAS, meeting the requirement of the Charter, with departures disclosed. The financial statements for the Final Budget Outcome 2012‑13 have been prepared on a basis consistent with the 2013‑14 Budget. This enables comparison of the 2012‑13 revised estimates published at the 2013‑14 Budget and the outcome. The statements reflect the Government's accounting policy that ABS GFS remains the basis of budget accounting policy, except where the Government applies AAS because it provides a better conceptual basis for presenting information of relevance to users of public sector financial reports.
AASB 1049 and the Uniform Presentation Framework (UPF) also provide a basis for reporting of the public non‑financial corporations (PNFC) and public financial corporations (PFC) sectors and the total non‑financial public sector (NFPS).
General Government Sector Financial Reporting (AASB 1049)
The FBO primarily focuses on the financial performance and position of the general government sector (GGS). The ABS defines the GGS as providing public services which are mainly non‑market in nature, mainly for the collective consumption of the community, involving the transfer or redistribution of income and financed mainly through taxes and other compulsory levies. AASB 1049 recognises the GGS as a reporting entity.
AASB 1049 history and conceptual framework
The Australian Accounting Standards Board (AASB) released AASB 1049 for application from the 2008‑09 financial year. AASB 1049 seeks to 'harmonise' ABS GFS and AAS.
The reporting framework for AASB 1049 requires the preparation of accrual‑based general purpose financial reports, showing government assets, liabilities, revenue, expenses and cash flows. GGS reporting under AASB 1049 aims to provide users with information about the stewardship of each government in relation to its GGS and accountability for the resources entrusted to it; information about the financial position, performance and cash flows of each government's GGS; and information that facilitates assessments of the macroeconomic impact. While AASB 1049 provides a basis for whole‑of‑government and GGS outcome reporting (including the PNFC and PFC sectors), budget reporting and budget outcome reporting focuses on the GGS.
There are three main general purpose statements that must be prepared in accordance with ABS GFS and AASB 1049. These are:
- an operating statement, including other economic flows, which shows net operating balance and net lending/borrowing (fiscal balance);
- to allow the presentation of a single set of financial statements in accordance with AASB 1049, the ABS GFS statement of other economic flows has been incorporated into the operating statement;
- a balance sheet, which also shows net worth, net financial worth, net financial liabilities and net debt; and
- a cash flow statement, which includes the calculation of the underlying cash balance.
In addition to these general purpose statements, notes to the financial statements are required. These notes include a summary of accounting policies, disaggregated information and other disclosures required by AAS. A full set of notes and other disclosures required by AAS are included in the annual consolidated financial statements.
All financial data presented in the financial statements are recorded as either stocks (assets and liabilities) or flows (classified as either transactions or other economic flows). Transactions result from a mutually agreed interaction between economic entities. Despite their compulsory nature, taxes are transactions deemed to occur by mutual agreement between the government and the taxpayer. Transactions that increase or decrease net worth (assets less liabilities) are reported as revenues and expenses respectively in the operating statement.1
A change to the value or volume of an asset or liability that does not result from a transaction is an 'other economic flow'. This can include changes in values from market prices, most actuarial valuations and exchange rates, and changes in volumes from discoveries, depletion and destruction. All other economic flows are reported in the operating statement.
Consistent with the ABS GFS framework, and in general AAS, the financial statements record flows in the period in which they occur. As a result, prior period outcomes may be revised for classification changes relating to information that could reasonably have been expected to be known in the past, is material in at least one of the affected periods and can be reliably assigned to the relevant period(s).
Operating statement
The operating statement presents details of transactions in revenues, expenses, the net acquisition of non‑financial assets (net capital investment) and other economic flows for an accounting period.
Revenues arise from transactions that increase net worth and expenses arise from transactions that decrease net worth. Revenues less expenses gives the net operating balance. The net operating balance is similar to the National Accounts concept of government saving plus capital transfers.
The net acquisition of non‑financial assets (net capital investment) measures the change in the Australian Government's stock of non‑financial assets owing to transactions. As such, it measures the net effect of purchases, sales and consumption (for example, depreciation of fixed assets and use of inventory) of non‑financial assets during an accounting period.
Net acquisition of non‑financial assets equals gross fixed capital formation, less depreciation, plus changes (investment) in inventories, plus other transactions in non‑financial assets.
Other economic flows are presented in the operating statement and outline changes in net worth that are driven by economic flows other than revenues and expenses. Revenues, expenses and other economic flows sum to the total change in net worth during a period. The majority of other economic flows for the Australian Government GGS arise from price movements in its assets and liabilities.
Fiscal balance
The fiscal balance (or net lending/borrowing) is the net operating balance less net capital investment. Thus, the fiscal balance includes the impact of net expenditure (effectively purchases less sales) on non‑financial assets rather than consumption (depreciation) of non‑financial assets.2
The fiscal balance measures the Australian Government's investment‑saving balance. It measures in accrual terms the gap between government savings plus net capital transfers, and investment in non‑financial assets. As such, it approximates the contribution of the Australian Government GGS to the balance on the current account in the balance of payments.
Balance sheet
The balance sheet shows stocks of assets, liabilities and net worth. In accordance with the UPF, net debt, net financial worth and net financial liabilities are also reported in the balance sheet.
Net worth
The net worth of the GGS, PNFC and PFC sectors is defined as assets less liabilities. This differs from the ABS GFS definition for the PNFC and PFC sectors, where net worth is defined as assets less liabilities less shares and other contributed capital. Net worth is an economic measure of wealth, reflecting the Australian Government's contribution to the wealth of Australia.
Net financial worth
Net financial worth measures a government's net holdings of financial assets. It is calculated from the balance sheet as financial assets minus liabilities. This differs from the ABS GFS definition of net financial worth for the PNFC and PFC sectors, defined as financial assets, less liabilities, less shares less other contributed capital. Net financial worth is a broader measure than net debt, in that it incorporates provisions made (such as superannuation) as well as holdings of equity. Net financial worth includes all classes of financial assets and all liabilities, only some of which are included in net debt. As non‑financial assets are excluded from net financial worth, this is a narrower measure than net worth. However, it avoids the concerns inherent with the net worth measure relating to the valuation of non‑financial assets and their availability to offset liabilities.
Net financial liabilities
Net financial liabilities comprises total liabilities less financial assets but excludes equity investments in the other sectors of the jurisdiction. Net financial liabilities is a more accurate indicator than net debt of a jurisdiction's fiscal position as it includes substantial non‑debt liabilities such as accrued superannuation and long service leave entitlements. Excluding the net worth of other sectors of government results in a purer measure of financial worth than net financial worth, as, in general, the net worth of other sectors of government, in particular the PNFC sector, is backed up by physical assets.
Net debt
Net debt is the sum of selected financial liabilities (deposits held, advances received, government securities, loans and other borrowing) less the sum of selected financial assets3 (cash and deposits, advances paid, and investments, loans and placements). This includes financial assets held by the Future Fund which are invested in these asset classes, including term deposits and investments in collective investment vehicles. Net debt does not include superannuation related liabilities. Net debt is a common measure of the strength of a government's financial position. High levels of net debt impose a call on future revenue flows to service that debt.
Cash flow statement
The cash flow statement identifies how cash is generated and applied in a single accounting period. The cash flow statement reflects a cash basis of recording (rather than an accrual basis) where information is derived indirectly from underlying accrual transactions and movements in balances. This, in effect, means that transactions are captured when cash is received or when cash payments are made. Cash transactions are specifically identified because cash management is considered an integral function of accrual budgeting.
Underlying cash balance
The underlying cash balance plus net Future Fund earnings (ABS GFS cash surplus/deficit) is the cash counterpart of the fiscal balance, reflecting the Australian Government's cash investment-saving balance. For the GGS, the underlying cash balance is calculated as shown below.
Net cash flows from operating activities
plus
Net cash flows from investments in non‑financial assets
less
Net acquisitions of assets acquired under finance leases and similar arrangements4
equals
ABS GFS cash surplus/deficit
less
Net Future Fund earnings
equals
Underlying cash balance
The Government has excluded net Future Fund earnings from the calculations of the underlying cash balance. Previously, the underlying cash balance only excluded the gross earnings of the Future Fund. Under the Future Fund Act 2006, earnings are required to be reinvested to meet the Government's future public sector superannuation liabilities. The Future Fund becomes available to meet the Government's superannuation liabilities from 2020.
In contrast, net Future Fund earnings are included in the fiscal balance because superannuation expenses relating to future cash payments are recorded in the fiscal balance.
Net Future Fund earnings are separately identified in the Australian Government GGS cash flow statement in Table 10 of this statement and the historical tables in Appendix B.
Headline cash balance
The headline cash balance is calculated by adding net cash flows from investments in financial assets for policy purposes and Future Fund earnings to the underlying cash balance.
Cash flows from investments in financial assets for policy purposes include equity transactions and net advances.5 Equity transactions include equity injections into controlled businesses and privatisations of government businesses. Net advances include net loans to the States, net loans to students under the Higher Education Loan Program (HELP), and contributions to international organisations that increase the Australian Government's financial assets.
Sectoral classifications
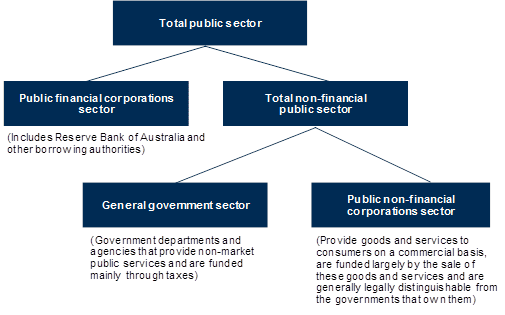
To assist in analysing the public sector, data is presented by institutional sector as shown in Figure 1. ABS GFS defines the GGS and the PNFC and PFC sectors. AASB 1049 has also adopted this sectoral reporting.
Figure 1: Institutional structure of the public sector
| General government sector entities |
|---|
| Agriculture, Fisheries and Forestry Portfolio |
|
Australian Fisheries Management Authority, Australian Pesticides and Veterinary Medicines Authority, Cotton Research and Development Corporation, Department of Agriculture, Fisheries and Forestry, Fisheries Research and Development Corporation, Grains Research and Development Corporation, Grape and Wine Research and Development Corporation, Rural Industries Research and Development Corporation, Sugar Research and Development Corporation, Wine Australia Corporation |
| Attorney‑General's Portfolio |
|
Administrative Appeals Tribunal, Attorney‑General's Department, Australian Commission for Law Enforcement Integrity, Australian Crime Commission, Australian Customs and Border Protection Service, Australian Federal Police, Australian Human Rights Commission, Australian Institute of Criminology, Australian Law Reform Commission, Australian Security Intelligence Organisation, Australian Transaction Reports and Analysis Centre, CrimTrac Agency, Family Court and Federal Circuit Court, Federal Court of Australia, High Court of Australia, Insolvency and Trustee Service Australia, National Native Title Tribunal, Office of the Australian Information Commissioner, Office of the Director of Public Prosecutions, Office of Parliamentary Counsel |
| Broadband, Communications and the Digital Economy Portfolio |
Australian Broadcasting Corporation, Australian Communications and Media Authority, Department of Broadband, Communications and the Digital Economy, Special Broadcasting Service Corporation, Telecommunications Universal Service Management Agency |
| Defence Portfolio |
|
AAF Company, Army and Air Force Canteen Service, Australian Military Forces Relief Trust Fund, Australian Strategic Policy Institute Limited, Australian War Memorial, Defence Housing Australia, Defence Materiel Organisation, Department of Defence, Department of Veterans' Affairs, RAAF Welfare Recreational Company, Royal Australian Air Force Veterans' Residences Trust Fund, Royal Australian Air Force Welfare Trust Fund, Royal Australian Navy Central Canteens Board, Royal Australian Navy Relief Trust Fund |
| Education, Employment and Workplace Relations Portfolio |
|
Australian Curriculum, Assessment and Reporting Authority, Australian Institute for Teaching and School Leadership Limited, Comcare, Department of Education, Employment and Workplace Relations, Fair Work Commission, Office of the Fair Work Building Industry Inspectorate (Fair Work Building and Construction), Office of the Fair Work Ombudsman, Safe Work Australia, Seafarers Safety, Rehabilitation and Compensation Authority (Seacare Authority) |
| Families, Housing, Community Services and Indigenous Affairs Portfolio |
|
Aboriginal Hostels Limited, Anindilyakwa Land Council, Australian Institute of Family Studies, Central Land Council, Department of Families, Housing, Community Services and Indigenous Affairs, DisabilityCare Australia (National Disability Insurance Scheme Launch Transition Agency), Indigenous Business Australia, Indigenous Land Corporation, Northern Land Council, Outback Stores Pty Ltd, Tiwi Land Council, Torres Strait Regional Authority, Workplace Gender Equality Agency, Wreck Bay Aboriginal Community Council |
| Finance and Deregulation Portfolio |
|
Australian Electoral Commission, Commonwealth Superannuation Corporation, ComSuper, Department of Finance and Deregulation, Future Fund Management Agency |
| Foreign Affairs and Trade Portfolio |
|
AusAID, Australian Centre for International Agricultural Research, Australian Secret Intelligence Service, Australian Trade Commission, Department of Foreign Affairs and Trade, Export Finance and Insurance Corporation National Interest Account |
| Health and Ageing Portfolio |
|
Aged Care Standards and Accreditation Agency Ltd, Australian Commission on Safety and Quality in Health Care, Australian Institute of Health and Welfare, Australian National Preventative Health Agency, Australian Organ and Tissue Donation and Transplantation Authority, Australian Radiation Protection and Nuclear Safety Agency, Cancer Australia, Department of Health and Ageing, Food Standards Australia New Zealand, General Practice Education and Training Limited, Health Workforce Australia, Independent Hospital Pricing Authority, National Blood Authority, National Health Funding Body, National Health and Medical Research Council, National Health Performance Authority, Private Health Insurance Administration Council, Private Health Insurance Ombudsman, Professional Services Review |
| Human Services Portfolio |
|
Department of Human Services |
| Immigration and Citizenship Portfolio |
|
Department of Immigration and Citizenship, Migration Review Tribunal and Refugee Review Tribunal |
| Industry, Innovation, Climate Change, Science, Research and Tertiary Education Portfolio |
|
Australian Institute of Aboriginal and Torres Strait Islander Studies, Australian Institute of Marine Science, Australian Nuclear Science and Technology Organisation, Australian Research Council, Australian Skills Quality Authority (National Vocational Education and Training Regulator), Clean Energy Regulator, Climate Change Authority, Commonwealth Scientific and Industrial Research Organisation, Department of Industry, Innovation, Climate Change, Science Research and Tertiary Education, IIF Investments Pty Limited, IP Australia, Low Carbon Australia Limited, Tertiary Education Quality and Standards Agency |
| Infrastructure and Transport Portfolio |
|
Australian Maritime Safety Authority, Australian Transport Safety Bureau, Civil Aviation Safety Authority, Department of Infrastructure and Transport, National Transport Commission |
| Prime Minister and Cabinet Portfolio |
|
Australian National Audit Office, Australian Public Service Commission, Department of the Prime Minister and Cabinet, National Australia Day Council Limited, National Mental Health Commission, Office of the Commonwealth Ombudsman, Office of the Inspector‑General of Intelligence and Security, Office of National Assessments, Office of the Official Secretary to the Governor‑General |
| Regional Australia, Local Government, Arts and Sport Portfolio |
|
Australia Business Arts Foundation Ltd, Australia Council, Australian Film, Television and Radio School, Australian National Maritime Museum, Australian Sports Anti‑Doping Authority, Australian Sports Commission, Australian Sports Foundation Limited, Bundanon Trust, Department of Regional Australia, Local Government, Arts and Sport, National Archives of Australia, National Capital Authority, National Film and Sound Archive, National Gallery of Australia, National Library of Australia, National Museum of Australia, National Portrait Gallery of Australia, Old Parliament House, Screen Australia |
| Resources, Energy and Tourism Portfolio |
|
Australian Renewable Energy Agency, Department of Resources, Energy and Tourism, Geoscience Australia, National Offshore Petroleum Safety and Environmental Management Authority, Tourism Australia |
| Sustainability, Environment, Water, Population and Communities Portfolio |
|
Bureau of Meteorology, Department of Sustainability, Environment, Water, Population and Communities, Director of National Parks, Great Barrier Reef Marine Park Authority, Murray‑Darling Basin Authority, National Water Commission, Sydney Harbour Federation Trust |
| Treasury Portfolio |
|
Australian Bureau of Statistics, Australian Competition and Consumer Commission, Australian Office of Financial Management, Australian Prudential Regulation Authority, Australian Securities and Investments Commission, Australian Taxation Office, Clean Energy Finance Corporation, Commonwealth Grants Commission, Corporations and Markets Advisory Committee, Department of the Treasury, Inspector‑General of Taxation, National Competition Council, Office of the Auditing and Assurance Standards Board, Office of the Australian Accounting Standards Board, Productivity Commission, Royal Australian Mint |
| Parliamentary Departments |
|
Department of Parliamentary Services, Department of the House of Representatives, Department of the Senate, Parliamentary Budget Office |
| Public financial corporations |
| Education, Employment and Workplace Relations Portfolio |
|
Coal Mining Industry (Long Service Leave Funding) Corporation |
| Finance and Deregulation Portfolio |
|
Medibank Private Ltd |
| Foreign Affairs and Trade Portfolio |
|
Export Finance and Insurance Corporation |
| Treasury Portfolio |
|
Australian Reinsurance Pool Corporation, Reserve Bank of Australia |
| Public non‑financial corporations |
| Attorney General's Portfolio |
|
Australian Government Solicitor |
| Broadband, Communications and the Digital Economy Portfolio |
|
Australian Postal Corporation, NBN Co Ltd |
| Families, Housing, Community Services and Indigenous Affairs Portfolio |
|
Voyages Indigenous Tourism Australia Pty Ltd |
| Finance and Deregulation Portfolio |
|
Albury‑Wodonga Development Corporation, Australian River Co. Ltd, ASC Pty Ltd |
| Human Services Portfolio |
|
Australian Hearing Services |
| Infrastructure and Transport Portfolio |
|
Airservices Australia, Australian Rail Track Corporation Ltd, Moorebank Intermodal Company Ltd |
Differences between ABS GFS and AAS framework (including AASB 1049)
AASB 1049 has adopted the AAS conceptual framework and principles for the recognition of assets, liabilities, revenues, expenses and their presentation, measurement and disclosure. In addition, AASB 1049 has broadly adopted the ABS GFS conceptual framework for presenting government financial statements. In particular, AASB 1049 requires the GGS to prepare a separate set of financial statements, over‑riding AASB 127 Consolidated and Separate Financial Statements. AASB 1049 also follows ABS GFS by requiring changes in net worth to be split into either transactions or 'other economic flows' and for this to be presented in a single operating statement. AASB 1049 is therefore broadly consistent with international statistical standards and the International Monetary Fund's (IMF) Government Finance Statistics Manual 2001.6
Some of the major differences between AAS and the ABS GFS treatments of transactions are outlined in Table 22. Further information on the differences between the two systems is provided in the ABS publication Australian System of Government Finance Statistics: Concepts, Sources and Methods, 2005 (cat. no. 5514.0).
| Issue | AAS treatment | ABS GFS treatment | Treatment adopted |
|---|---|---|---|
| Acquisition of defence weapons platforms
(DWP) |
Treated as capital expenditure. DWP appear as a non‑financial asset on the balance sheet. Depreciation expense on assets is recorded in the operating statement. AASB 1049 requires cost to be used where fair value of assets cannot be reliably measured. | ABS has updated its treatment in its GFS reports to record DWP as a non‑financial asset on a market value basis. This represents an early adoption of changes to the System of National accounts. | AAS |
| Circulating coins — seigniorage | The profit between the cost and sale of circulating coins (seigniorage) is treated as revenue. | Circulating coins are treated as a liability, and the cost of producing the coins is treated as an expense. | AAS |
| Provisions for bad and doubtful debts | Reported in the balance sheet as an offset to assets. Under AASB 1049, it is included in the operating statement as other economic flows. | Creating provisions for bad and doubtful debts is not considered an economic event and therefore not considered to be an expense or reflected in the balance sheet. | AAS |
| Advances to the International Development Association, and Asian Development Fund | Recorded at fair value in the balance sheet. | Recorded at nominal value in balance sheet. | ABS GFS |
| Concessional loans | Discounts concessional loans by a market rate of a similar instrument. | Does not discount concessional loans as no secondary market is considered to exist. | AAS |
| Investment in Other Public Sector Entities | Valued at fair value in the balance sheet as long as it can be reliably measured, otherwise net assets is permissible. | Unlisted entities valued based on their net assets in the balance sheet. | AAS |
| Provision for restoration, decommission‑ing and make‑good | Included in the Fiscal Balance capital adjustment. | Excluded from the calculation of net lending capital adjustment. | AAS |
| Renewable Energy Certificates (RECs) and Australian Carbon Credit Units (ACCUs) | The issuance and registration of such certificates are considered to be an administrative function and does not result in the recognition of an asset or liability and therefore no tax revenue or expense is recognised. | The issuance and registration of such certificates are considered to be government financial transactions resulting in the recognition of assets, liabilities, tax revenue and expenses. | AAS |
| Carbon pricing mechanism | The interpretation of the AAS framework indicates that the transactions are recognised in the financial statements where they are expected to result in a receipt or payment of cash by the government at the amount of the expected cash settlement. The issuance and surrender of free carbon units and ACCUs used in the settlement of emissions liabilities do not qualify for recognition by the government as assets, liabilities, revenues or expenses. | Transactions are recognised at the expected market value at the time of the transaction. In the fixed price period from 1 July 2012 to 30 June 2014, the price of carbon units that the government will pay under the buy‑back arrangements and sell to liable emitters to settle their obligations is set by the government at the prevailing fixed price and is regarded as the market value. | ABS GFS |
| Dividends paid by public corporations | Treated as an equity distribution. Equity distributions are treated as a distribution of profits, as opposed to an expense. | Dividends are treated as an expense. | ABS GFS |
| Commercial tax effect accounting assets and liabilities | Corporations in the PNFC and PFC sectors record tax expenses on a commercial basis. | Deferred tax assets and liabilities are reversed so that corporations record tax expenses on a consistent basis to the Australian Taxation Office. | ABS GFS |
| Fiscal aggregates differences | |||
| Finance leases | Does not deduct finance leases in the derivation of the cash surplus/deficit. | Deducts finance leases in the derivation of the cash surplus/deficit. | Both are disclosed |
| Net worth of PNFC and PFC sectors | Calculated as assets less liabilities. | Calculated as assets less liabilities less shares and other contributed capital. | AAS |
| Classification difference | |||
| Prepayments | Treated as a non‑financial asset. | Treated as a financial asset. | ABS GFS |
Australian Loan Council Allocation
Under Loan Council arrangements, every year the Commonwealth and each State and Territory government nominate a Loan Council Allocation (LCA). A jurisdiction's LCA incorporates:
- the estimated non‑financial public sector ABS GFS cash surplus/deficit (made up from the balances of the general government and public non‑financial corporations sectors and total non‑financial public sector acquisitions under finance leases and similar arrangements);
- net cash flows from investments in financial assets for policy purposes; and
- memorandum items, which involve transactions that are not formally borrowings but nevertheless have many of the characteristics of borrowings.
LCA nominations are considered by the Loan Council, having regard to each jurisdiction's fiscal position and infrastructure requirements, as well as the macroeconomic implications of the aggregate figure.
As set out in Table 23, the Commonwealth's 2012‑13 LCA final budget outcome is a $25.4 billion deficit. This compares with the Australian Government's 2012‑13 LCA Budget estimate of a $13.6 billion deficit.
A tolerance limit of 2 per cent of non‑financial public sector receipts applies between the LCA Budget estimate and the outcome. Tolerance limits recognise that LCAs are nominated at an early stage of the Budget process and may change as a result of policy and parameter changes. The Australian Government's 2012‑13 LCA final budget outcome exceeds the 2 per cent tolerance limit. This primarily reflects weaker than expected cash receipts.
| 2012‑13 Estimate $m |
2012‑13 Outcome $m | ||
|---|---|---|---|
| GGS cash surplus(-)/deficit(+) | -4,971 | 15,838 | |
| PNFC sector cash surplus(-)/deficit(+) | 5,137 | 3,294 | |
| NFPS cash surplus(-)/deficit(+)(a) | 394 | 19,132 | |
| plus | Acquisitions under finance leases and similar arrangements | 412 | 1,388 |
| equals | ABS GFS cash surplus(-)/deficit(+) | 805 | 20,521 |
| minus | Net cash flows from investments in financial assets for policy purposes(b) | -13,281 | -4,802 |
| plus | Memorandum items(c) | -440 | 70 |
| Loan Council Allocation | 13,646 | 25,393 |
(a) May not directly equate to the sum of the GGS and the PNFC sector due to intersectoral transfers which are netted out.
(b) Net cash flows from investments in financial assets for policy purposes are displayed with the same sign as they are reported in cash flow statements. Such transactions involve the transfer or exchange of a financial asset and are not included within the cash surplus/deficit. However, the cash flow from investments in financial assets for policy purposes has implications for a government's call on financial markets.
(c) For the Commonwealth's LCA outcome, memorandum items include the change in net present value (NPV) of operating leases (with NPV greater than $5 million), the over‑funding of superannuation and the net financing requirement of the Australian National University.
1 Not all transactions impact on net worth. For example, transactions in financial assets and liabilities do not impact on net worth as they represent the swapping of assets and liabilities on the balance sheet.
2 The net operating balance includes consumption of non-financial assets because depreciation is an expense. Depreciation also forms part of net capital investment, which (in the calculation of fiscal balance) offsets the inclusion of depreciation in the net operating balance.
3 Financial assets are defined as cash, an equity instrument of another entity, a contractual right to receive cash or financial asset, and a contract that will or may be settled in the entity's own equity instruments.
4 The underlying cash balance treats the acquisition and disposal of non-financial assets in the same manner regardless of whether they occur by purchase/sale or finance lease — acquisitions reduce the underlying cash balance and disposals increase the underlying cash balance. However, finance leases do not generate cash flows at the time of acquisition or disposal equivalent to the value of the asset. As such, net acquisitions of assets under finance leases are not shown in the body of the cash flow statement but are reported as a supplementary item for the calculation of the underlying cash balance.
5 Cash flows from investments in financial assets for policy purposes were called net advances under the cash budgeting framework.
6 Additional information on the Australian accrual GFS framework is available in the ABS publication Australian System of Government Finance Statistics: Concepts, Sources and Methods 2005 (cat. no. 5514.0).
Where possible, Budget documents are available in HTML and for downloading in Portable Document Format(PDF). If you require further information on any of the tables or charts on this website, please contact The Treasury.
