




Part 2: Economic Outlook (Continued)
Detailed domestic forecasts
Australia's real GDP is forecast to grow 3 per cent in both 2012‑13 and 2013‑14. Compared with Budget, the growth forecast has been downgraded by ¼ of a percentage point in 2012‑13, but is unchanged in 2013‑14. The downgrade to growth in 2012‑13 mainly reflects stronger‑than‑expected resources‑related investment activity in 2011‑12, along with recent announcements to defer or cancel resources projects. Australia's favourable real GDP growth outlook is underpinned by a surge in business investment, strong growth in non‑rural commodity exports and solid growth in household consumption.
Household consumption is forecast to grow 3 per cent in both 2012‑13 and 2013‑14, unchanged from Budget. While solid, growth in household consumption is expected to ease from the strong growth recorded in 2011‑12, consistent with the outlook for moderate employment and wages growth, continued subdued growth in household wealth and the impact of continued global volatility on consumer confidence. Consistent with this, the household saving ratio is expected to remain elevated over the forecast period, as households continue to rely on saving rather than capital gains to strengthen their balance sheets.
Dwelling investment is forecast to be flat in 2012‑13, before growing 4 per cent in 2013‑14. Dwelling investment declined 3.3 per cent in 2011‑12 on the back of continued weakness in the detached housing market. Conditions across the sector are expected to improve gradually over the remainder of 2012, consistent with the solid growth in dwelling approvals and commencements seen in the June quarter. The recovery is expected to gather momentum into 2013‑14, driven by a pickup in homebuyer demand, improved affordability following declines in house prices over the past two years and the assumption that interest rates will remain below average across the forecast period.
New business investment is expected to grow 11 per cent in 2012‑13 and 6½ per cent in 2013‑14, reflecting strong forecast growth in resources investment and modest growth in investment in other sectors of the economy. New engineering construction is expected to grow 19 per cent in 2012‑13 and 7 per cent in 2013‑14, underpinned by LNG and iron ore projects. The resources sector is also expected to drive higher levels of investment in new machinery and equipment, with growth forecast to be 9 per cent in 2012‑13 and 7½ per cent in 2013‑14. Weakness in the retail sector and the expectation of below‑trend employment growth, and therefore subdued demand for new office space, is expected to be reflected in weak growth in new non‑residential building activity, with growth of just 1 per cent forecast in 2012‑13 and 1½ per cent in 2013‑14.
Public final demand is forecast to fall ½ of a per cent in 2012‑13 and ¼ of a per cent in 2013‑14, consistent with the planned fiscal consolidations of the Commonwealth and state governments.
Exports are forecast to grow 4½ per cent in 2012‑13 and 4 per cent in 2013‑14. While the growth outlook remains strong, weaker‑than‑expected outcomes in 2011‑12, coupled with recent coal mine closures and announcements to not proceed with planned expansions, mean that the expected volume of non‑rural commodities exports is lower over the forecast period than anticipated at Budget. Manufactured exports are expected to rise only modestly over the next two years and services exports are expected to fall slightly, reflecting the high Australian dollar and forecasts for continued weak external demand. Farm production and rural exports surged to record levels in 2011‑12, reflecting favourable weather conditions. In 2012‑13, rural output and exports are expected to decline moderately, in line with an assumed return to average weather conditions.
Import growth forecasts have been downgraded slightly for 2012‑13 and 2013‑14, consistent with lower forecast growth in business investment. Import volumes are forecast to grow 7 per cent in 2012‑13 and 5 per cent in 2013‑14. Net exports are expected to detract ¾ of a percentage point from real GDP growth in 2012‑13 and ¼ of a percentage point in 2013‑14.
The terms of trade have declined more sharply than anticipated at Budget, reflecting recent sharp falls in the global prices of Australia's key non‑rural commodity exports. Following growth of 90 per cent over the past decade, the terms of trade are now expected to decrease 8 per cent in 2012‑13 and 2¾ per cent in 2013‑14, remaining high by historical standards.
The current account deficit is forecast to widen over the next two years. This reflects an expected turnaround in the trade balance from a surplus to a deficit, driven by the decline in the terms of trade. The current account deficit is expected to be 5 per cent of GDP in 2012‑13 and 5¾ per cent of GDP in 2013‑14. This compares with a long‑run average for the current account deficit of 4 per cent of GDP. Considered from a net lending perspective, the key driver of the rising current account deficit is the inflow of capital needed to finance the resources investment boom, with the household sector and Australian Government expected to be net lenders over the forecast period.
Following solid growth in the first half of 2012, employment growth has moderated in recent months, with weak global conditions, the high Australian dollar, uneven patterns of demand and continued deleveraging by the household and corporate sectors weighing on employment conditions in many industries. Employment is expected to increase 1 per cent through the year to the June quarter 2013 and 1¼ per cent through the year to the June quarter 2014. The unemployment rate is forecast to increase slightly from 5¼ per cent in the September quarter 2012 to 5½ per cent by the June quarter 2013, and remain around that level throughout 2013‑14.
Wages growth is expected to slow, consistent with moderate employment growth. Aggregate wages have grown solidly over the past year, with the low unemployment rate supporting solid growth in private sector wages. This has been balanced by weakness in public sector wages growth, which has eased in line with ongoing fiscal consolidation at the state and federal levels of government. Looking ahead, the Wage Price Index is forecast to grow 3½ per cent through the year to the June quarters of both 2013 and 2014, slightly weaker than forecast at Budget.
Inflation is expected to increase in 2012‑13 due to the one‑off effect of introducing the carbon price, but remain within the Reserve Bank's target band. While the high exchange rate is expected to exert less downward pressure on domestic prices over the forecast period than in the recent past, it is expected that solid productivity growth and subdued wages growth will continue to hold down domestic price pressures. Headline inflation (including the carbon price impact) is expected to be 3 per cent through the year to the June quarter of 2013 and 2¼ per cent through the year to the June quarter of 2014. Underlying inflation (including the carbon price impact) is expected to be 2½ per cent through the year to the June quarter of 2013, and 2¼ per cent through the year to the June quarter of 2014.
Nominal GDP is forecast to grow 4 per cent in 2012‑13 and 5½ per cent in 2013‑14. Compared with Budget, the growth forecast for nominal GDP in 2012‑13 has been downgraded by 1 percentage point. The lower forecast for 2012‑13 reflects the ¼ of a percentage point downward revision to real GDP growth, softer expected growth in domestic prices and a sharper forecast decline in the terms of trade.
Box 2.3: Resources investment
Over the past two decades, rapid urbanisation and industrialisation in China has driven strong growth in demand for Australia's key non‑rural commodity exports. This strong demand, and expectations that it will continue, have driven commodity prices to high levels and underpinned record investment intentions in Australia's resources sector.
The outlook for resources investment remains strong despite recent falls in commodity prices. Resources investment decisions are taken over a longer‑term horizon where the outlook for the resources and energy needs of Australia's key export markets remains very positive.
Around $260 billion of resources projects are at an advanced stage (either under construction or scheduled to commence) and are unlikely to be affected by recent falls in commodity prices (Chart A).
Chart A: Investment pipline
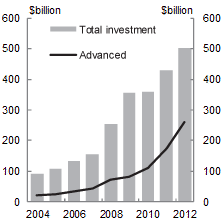
Source: Bureau of Resource and Energy Economics (BREE).
Of the advanced pipeline, around 70 per cent of the projected capital spending is on petroleum and LNG projects, with seven major LNG projects currently under construction across Western Australia, Queensland and the Northern Territory (Table A).
These projects are underpinned by long‑term supply contracts with Asian customers. The completion of these projects will see LNG production in Australia quadruple by 2017, with Australia becoming the world's largest LNG exporter.
| Project | CAPEX | ($bil) |
|---|---|---|
| Gorgon | A | 43.0 |
| Ichthys | US | 34.0 |
| Wheatstone | US | 29.0 |
| Australia Pacific LNG | A | 23.0 |
| Queensland Curtis Island LNG | US | 20.4 |
| Gladstone LNG | US | 18.5 |
| Prelude | A | 12.0 |
Source: Company statements, Deloitte Access Economics and BREE.
Note: Capital expenditure (CAPEX) estimates reflect amounts and denominations at the time of announcement.
In addition to LNG investment, iron ore investment is expected to continue to increase over the next two years, building on previous robust growth.
While resources investment as a share of GDP is expected to peak over the forecast period, resources investment is expected to remain at a high level through to the middle of this decade. As investment projects are completed, there will be a significant contribution to economic growth from the ramp‑up in resources production and export volumes.
If www.budget.gov.au responds slowly or you are having trouble downloading a document, try one of the Budget Website Mirrors
Note: Where possible, Budget documents are available in HTML and for downloading in Portable Document Format(PDF). If you require further information on any of the tables or charts on this website, please contact The Treasury.
