




Statement 1: Budget Overview (Continued)
Economic outlook
The Australian economy continues to outperform most of the developed world and prospects remain favourable, with an outlook of solid growth, low unemployment and contained inflation.
The economy is expected to undergo two large and important transitions over the forecast period. Following the largest investment boom in Australia's history, the resources sector will transition away from the investment phase towards exceptional growth in production and exports. More broadly, the Australian economy will transition to non‑resource drivers of growth. As this transition unfolds, economic growth is forecast to be close to trend at 2¾ per cent in 2013‑14 and 3 per cent in 2014‑15.
| Forecasts | Projections | ||||||
|---|---|---|---|---|---|---|---|
| 2012‑13 | 2013‑14 | 2014‑15 | 2015‑16 | 2016‑17 | |||
| Real GDP | 3 | 2 3/4 | 3 | 3 | 3 | ||
| Employment | 1 1/4 | 1 1/4 | 1 1/2 | 1 1/2 | 1 1/2 | ||
| Unemployment rate | 5 1/2 | 5 3/4 | 5 3/4 | 5 | 5 | ||
| Consumer Price Index | 2 1/2 | 2 1/4 | 2 1/4 | 2 1/2 | 2 1/2 | ||
| Nominal GDP | 3 1/4 | 5 | 5 | 5 1/4 | 5 1/4 | ||
(a) Real and nominal GDP are year‑average growth. Employment and CPI are through‑the‑year growth to the June quarter. The unemployment rate is the rate for the June quarter.
Source: Treasury.
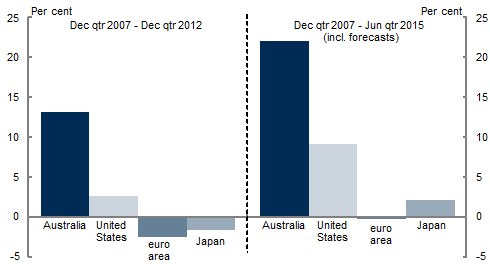
Australia is starting the transition from a position of strength, having one of the strongest economies in the developed world. The Australian economy is more than 13 per cent larger than it was in late 2007, with growth significantly outpacing major advanced economies. Around half of all advanced economies have not recovered lost output over this period. Australia's economy is also expected to continue to grow faster than most of the developed world over the forecast period, building on Australia's impressive record of economic growth and job creation over the past five years (Chart 1).
Global financial market sentiment has improved noticeably since late 2012, though global economic conditions remain challenging, particularly in the major advanced economies. Global growth continues to be driven by emerging market economies, with the weight of global economic activity increasingly shifting towards Asia.
The Australian economy continues to benefit from the opportunities created by this shift in global growth towards Asia. In recent times, Australia's economic growth has been supported by strong demand from Asia, particularly for our commodities, which has driven an unprecedented surge in resources investment. Resources investment is expected to reach a record level of over 8 per cent of GDP in 2013‑14, driving new business investment as a share of GDP to the highest level on record.
Chart 1: Real GDP growth
Source: ABS cat no. 5206.0, national statistical agencies, Thomson Reuters and Treasury.
Resources investment is expected to remain elevated through to at least the middle of the decade. The pipeline of resources investment remains substantial, with over $260 billion of investment either committed or under construction. While resources investment will begin to detract from growth after it passes its peak, the resources sector will continue to make an important contribution to growth as the investment phase transitions into the production phase, with record levels of resources investment expected to fuel exceptional growth in resources production and exports. Non‑rural commodity export volumes are expected to grow over 30 per cent over the next three years, and a substantial pick up in liquefied natural gas exports in the second half of the decade will support growth for years to come.
Outside of the resources sector, strong growth in emerging Asia will provide opportunities for Australia's services sector and other parts of the economy to increase exports. Reductions in official interest rates are helping to support the transition underway in the economy towards non‑resource sources of growth. The official cash rate is now 200 basis points lower than it was in late 2011, and parts of the economy are starting to respond to this. Dwelling investment is already showing signs of a recovery and consumer sentiment has increased since the start of the year and is now above historic‑average levels. The near‑term outlook for business investment outside the resources sector remains subdued with low capacity utilisation in some sectors, although this too is expected to pick up over time.
While prospects remain favourable, the transition underway in the economy may not be seamless. The resources sector is transitioning to the less labour intensive production phase, and the high Australian dollar, difficult global economic conditions, and household caution around debt accumulation are still weighing on many sectors of the economy. Consistent with this outlook, employment is expected to grow 1¼ per cent through the year to the June quarter 2014, and the unemployment rate is expected to drift slightly higher to 5¾ per cent by the June quarter 2014. In 2014‑15, the unemployment rate is expected to stabilise at this level, as employment growth picks up to 1½ per cent through the year to the June quarter 2015 in line with a strengthening economy. The forecast unemployment rate remains low by historical standards and is in stark contrast to the high rates in the major advanced economies.
In contrast to the resilience in real GDP and the labour market, nominal GDP — or the dollar value of goods and services produced in the economy — has been profoundly affected by the sustained high dollar and falling global commodity prices. This unusual combination is having an acute and enduring impact on prices and profitability across the board, despite continued solid growth in the real economy. While real GDP grew 3.1 per cent through the year to December 2012, nominal GDP rose by an unexpectedly weak 2.0 per cent. Through‑the‑year nominal GDP growth has fallen short of real GDP growth in only three other episodes (the global financial crisis (GFC), the Asian financial crisis, and the 1960s credit squeeze) and has now grown slower than real GDP for a record three consecutive quarters, the first time this has occurred since quarterly records began.
Consistent with the unusual weakness in nominal GDP, the National Accounts measure of company profits has fallen for a record five consecutive quarters. The weakness in profit growth is indicative of the widespread and significant effect of the high Australian dollar and falling commodity prices on profitability in both the resource and non‑resource sectors.
While commodity export volumes have been growing strongly, the average price that Australian producers received for those exports fell 24 per cent from their recent peak in September 2011 to December 2012. This fall in commodity prices has led to sharp declines in resource profits. Commodity prices have since recovered some of their lost ground. While there may be short‑term volatility, commodity prices are expected to continue to ease in trend terms, in line with growing world supply, placing downward pressure on profits and nominal GDP growth over the forecast period.
Although commodity prices and the terms of trade have fallen significantly from their peaks, the dollar has remained stubbornly high — a highly unusual combination. The trade weighted index of the Australian dollar has risen to around 30‑year highs, driven by a 20 per cent appreciation against the Japanese Yen over the past six months. The strength of the Australian dollar reflects the fundamental strength of the Australian economy. With low unemployment, stable inflation and low levels of public debt, Australia is one of only eight countries with a AAA credit rating with a stable outlook from all three rating agencies. These strong fundamentals and the relative attractiveness of yields on offer have increased the demand for Australian dollar denominated assets.
The high dollar in the face of declining terms of trade has contributed to broader weakness in prices and profit. Notwithstanding business investment reaching record highs as a share of GDP, growth in producer prices remains contained. More broadly, there are persistent competitive pressures from the sustained high dollar in trade‑exposed sectors. Consumer caution and changing spending patterns have added further competitive pressure on retailers. In response to these pressures, firms have been absorbing costs rather than passing them on as higher prices, which has reduced profit margins. Non‑mining profit rose 0.9 per cent in 2012, well below the annual average increase of 14.1 per cent in the ten years prior to the GFC. Some firms are responding to these pressures by improving productivity and adapting their business models. Still, ongoing competitive pressures from the sustained high dollar are expected to continue to constrain price and profit growth over the forecast period.
Consistent with strong competitive pressures, consumer price inflation is expected to be well contained. Headline inflation is forecast to be 2½ per cent through the year to the June quarter 2013, including a one‑off ¾ of a percentage point increase due to the introduction of the carbon price, before declining to 2¼ per cent through the year to the June quarter of both 2014 and 2015.
The main risks to the outlook continue to stem from the external environment. The key international risk is the potential for a re‑escalation of the euro area crisis. A failure to raise the debt ceiling in the United States in a timely manner is the other key near‑term risk, while the threat of a global oil price shock also lingers. The transmission of volatility abroad to commodity prices presents a considerable risk to the forecast for nominal GDP. Additionally, there is a risk that the transition to non‑resource drivers of growth may be less seamless than forecast. That said, the Australian economy faces these challenges from a position of strength, and the structural changes in the global economy provide Australia with significant and lasting opportunities.
Note: Where possible, Budget documents are available in HTML and for downloading in Portable Document Format(PDF). If you require further information on any of the tables or charts on this website, please contact The Treasury.
