




Statement 3: Fiscal Strategy and Outlook (Continued)
Overview of fiscal position
This Budget strikes the right balance between maintaining a strong fiscal position, supporting economic growth and jobs, and investing in the future.
Responsible saving decisions make room for historic investment in Australian schooling, productivity enhancing nationally significant infrastructure, and ensuring a fairer go for Australians with disability.
The Government has maintained its commitment to its medium‑term fiscal strategy with a clear plan to return the budget to balance in 2015‑16 and to surplus in 2016‑17.
Consistent with this fiscal strategy, the Government continues to deliver fiscal outcomes that have supported Australia's solid growth and low unemployment. A well‑designed stimulus package kept the Australian economy out of recession during the global financial crisis. The Government has since delivered a sensible consolidation to ensure Australia's public finances remain strong and that solid growth and low unemployment are maintained.
The Australian economy is expected to undergo two large and important transitions over the forecast period. Following the largest investment boom in Australia's history, the resources sector will transition from the investment phase toward exceptional growth in production and exports. More broadly, the Australian economy will transition to non‑resource drivers of growth.
While Australia's economic fundamentals remain strong, the current unusual and persistent combination of a sustained high dollar and falling commodity prices is having a significant and widespread impact on corporate profitability, with the National Accounts measure of company profits falling for a record five consecutive quarters.
Tax receipts have been significantly affected by weaker than expected nominal GDP growth. Weaker commodity prices and the persistently high Australian dollar have hit company profits across most of the economy, including the resources sector. This has had a large impact on the level of company tax receipts expected in 2012‑13 and over the forward estimates. Lower than expected capital gains tax and resource rent taxes have compounded the fall in company tax receipts. Since the 2012‑13 Budget, tax receipts have been revised down by around $17 billion in 2012‑13, bringing the total write‑downs in tax receipts over the five years since the 2008‑09 Budget to around $170 billion. Since the 2012‑13 MYEFO, tax receipts have been revised down by around $60 billion over the four years to 2015‑16.
Responding to changing economic and fiscal circumstances is a central element of the Government's fiscal strategy. The Government has chosen to recalibrate the pace of fiscal consolidation to ensure that it does not weaken economic growth in the near term. A more gradual return to surplus is appropriate given the significant downgrades to revenue and the transition underway in the economy. The consolidation is responsibly paced, amounting to around half of a percentage point of GDP a year, on average, from 2013‑14 to the end of the forward estimates.
The Government's approach is to let the automatic stabilisers on the revenue side of the budget operate in the near term. This means not offsetting substantial near term revenue downgrades by making large spending cuts, which would come at a significant cost to jobs and growth.
The Government continues to exercise spending restraint, in a way that does not put Australia's solid growth and low unemployment at risk by making drastic cuts in the near term to offset lower than expected tax receipts. The expected overall impact of the Government's policy decisions on economic growth and employment in 2012‑13 and 2013‑14 is largely unchanged since MYEFO.
Without the net impact of policy decisions in this Budget, there would have been underlying cash deficits of $17.8 billion in 2013‑14, $17.4 billion in 2014‑15, $11.6 billion in 2015‑16 and $5.6 billion in 2016‑17.
This Government is taking a measured pathway back to surplus within the forward estimates. Decisions taken this Budget will result in $43 billion of total savings. The net budget impact of policy decisions is a $28.4 billion improvement to the underlying cash balance over forward estimates, including an improvement of $12.2 billion in 2016‑17, bringing the budget back to balance by 2015‑16 and into surplus in 2016‑17, well ahead of most advanced economies.
| Actual | Estimates | Projections | ||||||
|---|---|---|---|---|---|---|---|---|
| 2011‑12 | 2012‑13 | 2013‑14 | 2014‑15 | 2015‑16 | 2016‑17 | |||
| Underlying cash balance ($b)(a) | -43.4 | -19.4 | -18.0 | -10.9 | 0.8 | 6.6 | ||
| Per cent of GDP | -2.9 | -1.3 | -1.1 | -0.6 | 0.0 | 0.4 | ||
| Fiscal balance ($b) | -44.5 | -20.3 | -13.5 | -6.3 | 6.0 | 10.8 | ||
| Per cent of GDP | -3.0 | -1.3 | -0.8 | -0.4 | 0.3 | 0.6 | ||
(a) Excludes net Future Fund earnings.
While the return to surplus is more gradual, the Government's fiscal consolidation provides ongoing scope for monetary policy to respond to economic developments as needed. Just as the Government's fiscal settings are consistent with solid growth and low unemployment, they are also consistent with contained inflation. The Government's fiscal consolidation has already given the RBA scope to ease monetary policy, with policy interest rates reduced by 200 basis points since late 2011. Lower interest rates are already providing support to many sectors, assisting the transition towards non‑resource drivers of growth over the forecast period.
Fiscal sustainability is also being improved by implementing policies that increase long‑term growth in the economy, and boost Australia's productivity through investment in education, skills and critical infrastructure.
The Government's commitment to fiscal restraint will ensure that Australia's fiscal position remains one of the strongest in the developed world.
By the time Australia is expected to return the budget to balance in 2015‑16, the IMF estimates that 24 out of 35 advanced economies will still be in deficit.
Net debt is expected to peak at 11.4 per cent of GDP in 2014‑15, reducing to zero by 2021‑22. While average net debt for the major advanced economies is expected to peak at 92.6 per cent of GDP in 2014, Australia's net debt as a share of GDP is expected to peak at less than one‑eighth of that level.
The Government's fiscal strategy
Within the framework of the Government's medium‑term fiscal strategy, Australia's fiscal policy settings have helped the Australian economy remain resilient through the global financial crisis and severe global economic turbulence in recent years.
The fiscal strategy is designed to ensure fiscal sustainability over the medium term, but it also provides the necessary flexibility for the budget to vary in line with economic conditions in the short term to support macroeconomic stability.
Adhering to the fiscal strategy will allow the economy to continue to remain responsive to global challenges and the effect they have on our economy, while reducing net debt over time and keeping government borrowing costs low.
The medium‑term fiscal strategy has remained unchanged since 2008‑09, the Government's first budget (see Box 1 below).
Box 1: The medium‑term fiscal strategy
The Government's medium‑term fiscal strategy is to:
- achieve budget surpluses, on average, over the medium term;
- keep taxation as a share of GDP, on average, below the level for 2007‑08 (23.7 per cent); and
- improve the Government's net financial worth over the medium term.
To ensure a timely return to surplus and recovery in the fiscal position, since the beginning of the global financial crisis the Government has further committed to:
- allow the level of tax receipts to recover naturally as the economy improves, while maintaining the Government's commitment to keep taxation as a share of GDP below the 2007‑08 level on average; and
- build growing surpluses by holding real growth in spending to 2 per cent a year, on average, until the budget surplus is at least 1 per cent of GDP, and while the economy is growing at or above trend.
This Budget provides a pathway to budget balance in 2015‑16 and increasing surpluses from 2016‑17, which will improve the Government's net financial worth over the medium term. Real growth in spending has remained low, at an average rate of 1.3 per cent from 2012‑13 to 2016‑17, the lowest five‑year average growth rate for 25 years.
Taxation as a share of GDP over the forward estimates is expected to average 22.5 per cent, which is 1.5 percentage points lower than during the last four years of the previous government.
Estimates of taxation receipts have declined significantly
The Australian economy continues to outperform most of the developed world. Australia's level of real GDP is significantly above its pre‑global financial crisis level, in stark contrast to the major advanced economies. Australia's real GDP is also expected to continue to grow faster than most of the developed world over the forecast period, building on Australia's impressive record of economic growth and job creation over the past five years.
Nevertheless, it is nominal as opposed to real GDP that ultimately determines government revenue and the Government's fiscal position, and over the year to December, nominal GDP grew by only 2.0 per cent, well below real GDP growth of 3.1 per cent. Nominal GDP reflects both production and prices for Australian output.
The unusual combination of a persistently high dollar and falling commodity prices is having an acute and persistent impact on prices and profitability across the economy, including in the resources sector. Consumer caution and changing spending patterns have added further competitive pressure on retailers. Firms have been absorbing costs rather than passing them on as higher prices, which has reduced profit margins.
Tax receipts have been significantly affected by these changes. Lower company profits across most of the economy have had a significant impact on the level of company tax receipts expected in 2012‑13 and over the forward estimates. Lower than expected capital gains tax (CGT) and resource rent taxes have compounded the fall in company tax receipts. Income tax withholding and consumption taxes have been revised down to a lesser extent, as wages are expected to grow modestly and consumption is expected to remain solid over the forward estimates.
Since MYEFO, tax receipts have been revised down by $12.9 billion in 2012‑13 and $16.6 billion in 2013‑14. Company tax receipts have been revised down by around $5.2 billion in 2012‑13 and $7.2 billion in 2013‑14. CGT, an important component of individuals, companies and superannuation funds tax, is also contributing to the weaker revenue outlook. Since the 2012‑13 MYEFO, total CGT receipts have been revised down by $1.8 billion in 2012‑13 and $2.9 billion in 2013‑14. Resource rent taxes have been revised down by $3.6 billion in 2012‑13 and $3.2 billion in 2013‑14.
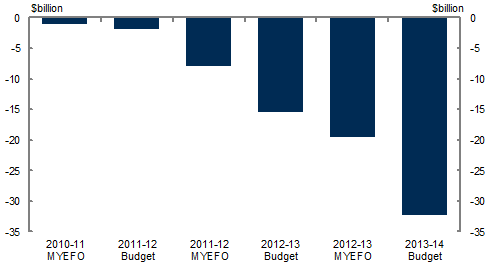
Tax receipts have been revised down by around $170 billion over the five years to 2012‑13. For 2012‑13 alone, tax receipts (excluding policy decisions) have been revised down by around $32 billion since the 2010‑11 Budget (see Chart 1 below).
Chart 1: Cumulative tax receipts write‑down in 2012‑13 since the 2010‑11 Budget
Source: Treasury.
Across the forward estimates, tax receipts as a share of GDP are expected to remain well below pre‑global financial crisis levels. The tax‑to‑GDP ratio in 2013‑14 is estimated to be 22.2 per cent, 1.8 percentage points lower than the average of the five years prior to the global financial crisis of 24.0 per cent.
These revenue write‑downs have made fiscal consolidation more challenging, with larger policy adjustments needed to achieve the same budget outcome. The Government continues to exercise spending restraint, but will not put Australia's solid growth and low unemployment at risk by offsetting substantial revenue write‑downs in the near term.
Maintaining fiscal discipline has kept the budget on a pathway to surplus
It is important that the pace of fiscal consolidation is calibrated to economic circumstances to avoid a detrimental impact on growth and jobs.
A measured pathway back to surplus is in line with principles of sound economic policy, striking the right balance between protecting Australia's solid growth and low unemployment, maintaining a strong fiscal position and improving fiscal sustainability in the medium term.
The IMF has said in its April 2013 World Economic Outlook that 'in advanced economies, the right macroeconomic approach continues to be gradual but sustained fiscal adjustment, built on measures that limit damage to activity'.
In Australia, revenue write‑downs have considerably increased the fiscal adjustment needed to return to surplus, relative to expectations at the time of the 2010‑11 Budget when a surplus in 2012‑13 was initially forecast. Budget Statement 4, Fiscal Policy in the Current Economic Environment, shows that at the time of the 2010‑11 Budget, returning to surplus in 2012‑13 required a fiscal adjustment, over and above the automatic impacts of the economic cycle and unwinding of the temporary stimulus, of around 1.6 per cent of GDP.
Cumulative parameter variations since the 2010‑11 Budget have increased the required fiscal adjustment to 3.4 per cent of GDP; more than double the originally anticipated adjustment.
Offsetting the significant revenue write‑downs since MYEFO in such a short timeframe would have come at a significant cost to jobs and growth. This would lead, in turn, to even lower revenue and increased spending on unemployment benefits.
Given this, the timing of the consolidation has been recalibrated to manage its impact on growth and jobs. Since the global financial crisis, the temporary stimulus measures have been withdrawn and spending discipline imposed, with the fiscal consolidation between 2011‑12 and 2012‑13 alone equivalent to 1.6 per cent of GDP.
The change in the pace of consolidation over the forward estimates is largely owing to the significant write‑down in tax receipts.
From 2014‑15, policy decisions are expected to have a more significant role in the fiscal consolidation than in 2013‑14. All new payment decisions within the forward estimates have been more than offset by payments savings measures.
Savings
Fiscal discipline involves ensuring that any expansions in one area are matched by responsible savings in other areas, in addition to any savings needed to continue fiscal consolidation in support of the Government's medium‑term fiscal strategy.
All new decisions taken in this Budget have been more than fully offset, contributing to the return to surplus.
Table 2 shows the effect of spending and savings decisions since MYEFO. The net budget impact of policy decisions takes into account amounts that were previously provisioned for in the Contingency Reserve (and as a result have no net impact on the budget position). These principally relate to the continuation of the Early Childhood Education National Partnership, and Official Development Assistance.
| Estimates | Projections | ||||||
|---|---|---|---|---|---|---|---|
| 2012‑13 $m |
2013‑14 $m |
2014‑15 $m |
2015‑16 $m |
2016‑17 $m |
Total $m | ||
| Effect of policy decisions since MYEFO | |||||||
| Spends | -2,604 | -2,470 | -3,212 | -2,853 | -4,465 | -15,604 | |
| Payments | -2,474 | -2,386 | -3,172 | -2,857 | -4,437 | -15,325 | |
| Receipts | -130 | -83 | -41 | 4 | -28 | -278 | |
| Saves | 246 | 1,750 | 9,400 | 15,176 | 16,471 | 43,043 | |
| Payments | 172 | 1,411 | 3,756 | 5,660 | 6,295 | 17,294 | |
| Receipts | 75 | 338 | 5,644 | 9,517 | 10,175 | 25,749 | |
| Total effect of policy decisions since MYEFO | -2,358 | -720 | 6,188 | 12,324 | 12,005 | 27,439 | |
| Add Contingency Reserve offsets to policy decisions | 4 | 433 | 289 | 77 | 195 | 998 | |
| Net budget impact of policy decisions | -2,354 | -286 | 6,476 | 12,401 | 12,200 | 28,437 | |
(a) On an underlying cash basis.
The net budget impact of policy decisions is a $28.4 billion improvement to the underlying cash balance over the forward estimates.
The Government has made $43.0 billion in savings in this Budget to pay for new spending of $15.6 billion (of which $1.0 billion had been provisioned for in the Contingency Reserve).
The savings in this Budget build on the $16.4 billion of savings in the 2012‑13 MYEFO and more than $130 billion of savings identified in the five budgets since 2008‑09. Policy decisions made in this Budget will deliver the largest improvement to the forward estimates position in nearly two decades.
The revenue position has been enhanced by a range of measures, including increasing the Medicare levy to help fund DisabilityCare Australia, a package of measures to protect the corporate tax base, and measures to improve the sustainability of the superannuation system. Collectively, policy measures add $25.5 billion to receipts over the five years to 2016‑17.
The sustainability of Government finances has also been improved over the medium term as many of the budget savings identified will deliver continuing benefits to the bottom line beyond the forward estimates.
Long‑term savings
Since its first Budget in 2008‑09, the Government has consistently made savings decisions that continue to benefit the budget position beyond the forward estimates.
Significant long‑term savings in this Budget include reforms to superannuation and business taxation, the increase in the Medicare levy and reforms to family payments.
These savings build on earlier long‑term savings such as means testing the private health insurance rebate, reforming a number of fringe benefits tax concessions and reducing superannuation concessions for very high income earners.
These measures have allowed the Government to fund new priorities such as establishing DisabilityCare Australia and the National Plan for School Improvement (Chart 2 below). The enduring savings have also helped improve the budget bottom line, helping to achieve the goals of the Government's medium‑term fiscal strategy.
Chart 2: Making room for the National Plan for School Improvement
and DisabilityCare Australia
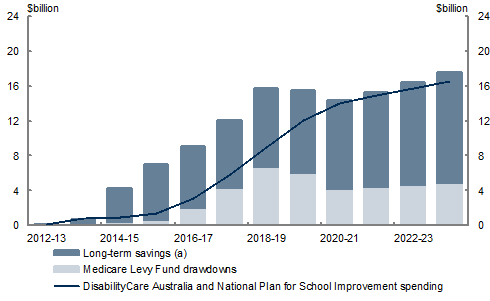
(a) Long‑term savings from 2013‑14 Budget and 2012‑13 MYEFO, excluding Medicare Levy and net of Dental Care Reform expenditure.
Without the long‑term savings made since the 2008‑09 Budget, the outlook would be much poorer (see Box 3 in Statement 4, Fiscal Policy in the Current Economic Environment). The long‑term savings the Government has made in this Budget and previously mean that the budget is cumulatively better off by over $300 billion by 2020‑21. These savings also help to deal with the longer‑term budget pressures that were identified in the Intergenerational Report 2010. This report showed that without changes to future policy the expenditure pressures from ageing and other factors would create a significant fiscal gap by 2050. Changes to health expenditure, including measures to improve sustainability in this Budget, have helped to reduce one of the most significant contributors to the projected fiscal gap.
Payments
A continuing focus on restraining growth in payments remains an important element of the Government's fiscal strategy. Given the range of factors that can affect payments in any one year, looking at payments over a number of years is a better indicator of spending patterns.
The discipline imposed on real spending growth has kept payments as a share of GDP at or below 24.5 per cent across the forward estimates, dropping to 24 per cent or below by 2015‑16. This discipline has also meant that the average payment to GDP ratio over the five years from 2012‑13 is lower than the average payment to GDP ratio over the previous thirty years.
Assessing payments over a number of years to judge spending restraint is reflected in the Government's commitment to holding real growth in spending to 2 per cent a year, on average, until the budget surplus is at least 1 per cent of GDP, and while the economy is growing at or above trend.
| 2012‑13 | 2013‑14 | 2014‑15 | 2015‑16 | 2016‑17 | |
|---|---|---|---|---|---|
| Real payment growth | -3.2 | 4.3 | 2.2 | 1.4 | 1.9 |
| Average real growth in payments | 1.3 | ||||
Table 3 shows that real growth in payments is estimated to be ‑3.2 per cent in 2012‑13, rising to 4.3 per cent in 2013‑14 and averaging 1.3 per cent over the five years to 2016‑17.
The proportion of payments to GDP decreases over the forward estimates; with all new payments more than offset by reductions in lower priority existing payments.
Note: Where possible, Budget documents are available in HTML and for downloading in Portable Document Format(PDF). If you require further information on any of the tables or charts on this website, please contact The Treasury.
