




Statement 3: Fiscal Strategy and Outlook (Continued)
Fiscal outlook
Table 4 shows that an underlying cash deficit of $18.0 billion (1.1 per cent of GDP) is expected in 2013‑14; moving to balance in 2015‑16 and a surplus of $6.6 billion (0.4 per cent of GDP) in 2016‑17.
In accrual terms, a fiscal deficit of $13.5 billion (0.8 per cent of GDP) is expected for 2013‑14, moving to a surplus of $6 billion (0.3 per cent of GDP) in 2015‑16 and a surplus of $10.8 billion (0.6 per cent of GDP) in 2016‑17.
| Actual | Estimates | Projections | ||||||
|---|---|---|---|---|---|---|---|---|
| 2011‑12 $b |
2012‑13 $b |
2013‑14 $b |
2014‑15 $b |
2015‑16 $b |
2016‑17 $b | |||
| Receipts | 329.9 | 350.4 | 376.0 | 401.2 | 428.9 | 453.6 | ||
| Per cent of GDP | 22.4 | 23.0 | 23.5 | 23.9 | 24.3 | 24.4 | ||
| Payments(a) | 371.0 | 367.3 | 391.2 | 409.1 | 425.0 | 443.7 | ||
| Per cent of GDP | 25.2 | 24.2 | 24.5 | 24.4 | 24.0 | 23.8 | ||
| Net Future Fund earnings | 2.2 | 2.5 | 2.8 | 2.9 | 3.1 | 3.3 | ||
| Underlying cash balance(b) | -43.4 | -19.4 | -18.0 | -10.9 | 0.8 | 6.6 | ||
| Per cent of GDP | -2.9 | -1.3 | -1.1 | -0.6 | 0.0 | 0.4 | ||
| Revenue | 338.1 | 360.0 | 387.7 | 411.6 | 438.1 | 468.6 | ||
| Per cent of GDP | 22.9 | 23.7 | 24.3 | 24.5 | 24.8 | 25.2 | ||
| Expenses | 377.7 | 381.4 | 398.3 | 415.7 | 431.0 | 454.7 | ||
| Per cent of GDP | 25.6 | 25.1 | 24.9 | 24.8 | 24.4 | 24.4 | ||
| Net operating balance | -39.6 | -21.5 | -10.6 | -4.1 | 7.1 | 13.8 | ||
| Net capital investment | 4.9 | -1.2 | 2.9 | 2.2 | 1.1 | 3.0 | ||
| Fiscal balance | -44.5 | -20.3 | -13.5 | -6.3 | 6.0 | 10.8 | ||
| Per cent of GDP | -3.0 | -1.3 | -0.8 | -0.4 | 0.3 | 0.6 | ||
| Memorandum item: | ||||||||
| Headline cash balance | -47.0 | -22.2 | -25.3 | -21.0 | -8.6 | -3.3 | ||
(a) Equivalent to cash payments for operating activities, purchases of non‑financial assets and net acquisition of assets under finance leases.
(b) Excludes net Future Fund earnings.
Cash flows
In 2013‑14, an underlying cash deficit of $18.0 billion is expected, and a headline cash deficit of $25.3 billion. Table 5 provides a summary of Australian Government general government sector cash flows.
| Estimates | Projections | |||||
|---|---|---|---|---|---|---|
| 2012‑13 $b |
2013‑14 $b |
2014‑15 $b |
2015‑16 $b |
2016‑17 $b | ||
| Cash receipts | ||||||
| Operating cash receipts | 348.8 | 375.6 | 398.1 | 427.2 | 453.4 | |
| Capital cash receipts(a) | 1.6 | 0.4 | 3.1 | 1.7 | 0.2 | |
| Total cash receipts | 350.4 | 376.0 | 401.2 | 428.9 | 453.6 | |
| Cash payments | ||||||
| Operating cash payments | 359.3 | 382.4 | 400.0 | 416.2 | 434.5 | |
| Capital cash payments(b) | 7.5 | 8.3 | 9.1 | 8.7 | 9.3 | |
| Total cash payments | 366.9 | 390.7 | 409.1 | 425.0 | 443.7 | |
| Finance leases and similar arrangements(c) | 0.4 | 0.5 | 0.0 | 0.0 | 0.0 | |
| GFS cash surplus(+)/deficit(-) | -16.9 | -15.2 | -8.0 | 4.0 | 9.9 | |
| Per cent of GDP | -1.1 | -1.0 | -0.5 | 0.2 | 0.5 | |
| less Net Future Fund earnings | 2.5 | 2.8 | 2.9 | 3.1 | 3.3 | |
| Underlying cash balance(d) | -19.4 | -18.0 | -10.9 | 0.8 | 6.6 | |
| Per cent of GDP | -1.3 | -1.1 | -0.6 | 0.0 | 0.4 | |
| Memorandum items: | ||||||
| Net cash flows from investments in financial assets for policy purposes | -5.3 | -10.1 | -13.1 | -12.6 | -13.2 | |
| plus Net Future Fund earnings | 2.5 | 2.8 | 2.9 | 3.1 | 3.3 | |
| Headline cash balance | -22.2 | -25.3 | -21.0 | -8.6 | -3.3 | |
(a) Equivalent to cash receipts from the sale of non‑financial assets in the cash flow statement.
(b) Equivalent to cash payments for purchases of non‑financial assets in the cash flow statement.
(c) The acquisition of assets under finance leases decreases the underlying cash balance. The disposal of assets previously held under finance leases increases the underlying cash balance.
(d) Excludes expected net Future Fund earnings.
Variations to the underlying cash balance estimates
Table 6 provides a reconciliation of the variations in the underlying cash balance since the 2012‑13 Budget.
The change in estimated underlying cash balance since MYEFO is largely a result of write‑downs in taxation receipts, offset in part by the effect of policy decisions which improve the underlying cash balance by $15.4 billion over the four years from 2012‑13.
| Estimates | Projections | ||||
|---|---|---|---|---|---|
| 2012‑13 $m |
2013‑14 $m |
2014‑15 $m |
2015‑16 $m | ||
| 2012‑13 Budget underlying cash balance(a) | 1,536 | 2,044 | 5,318 | 7,469 | |
| Per cent of GDP | 0.1 | 0.1 | 0.3 | 0.4 | |
| Changes from 2012‑13 Budget to 2012‑13 MYEFO | |||||
| Effect of policy decisions(b) | 1,411 | 5,121 | 1,917 | 1,897 | |
| Effect of parameter and other variations | -1,869 | -5,000 | -3,910 | -2,958 | |
| Total variations | -458 | 121 | -1,993 | -1,061 | |
| 2012‑13 MYEFO underlying cash balance(a) | 1,077 | 2,165 | 3,325 | 6,408 | |
| Per cent of GDP | 0.1 | 0.1 | 0.2 | 0.4 | |
| Changes from 2012‑13 MYEFO to 2013‑14 Budget | |||||
| Effect of policy decisions(b)(c) | |||||
| Receipts | -56 | 255 | 5,603 | 9,521 | |
| Payments | 2,302 | 975 | -584 | -2,803 | |
| Total policy decisions impact on underlying cash balance | -2,358 | -720 | 6,188 | 12,324 | |
| Effect of parameter and other variations(c) | |||||
| Receipts(d) | -16,358 | -17,024 | -14,557 | -15,306 | |
| Payments | 1,738 | 2,464 | 5,843 | 2,576 | |
| Total parameter and other variations impact on underlying cash balance | -18,096 | -19,488 | -20,400 | -17,882 | |
| 2013‑14 Budget underlying cash balance(a) | -19,377 | -18,043 | -10,888 | 849 | |
| Per cent of GDP | -1.3 | -1.1 | -0.6 | 0.0 | |
(a) 2012‑13 MYEFO and 2013‑14 Budget figures exclude expected net Future Fund earnings, whereas 2012‑13 Budget figures exclude expected gross Future Fund earnings.
(b) Excludes secondary impacts on public debt interest of policy decisions and offsets from the Contingency Reserve for decisions taken.
(c) A positive number for revenue indicates an increase in the fiscal balance, while a positive number for expenses and net capital investment indicates a decrease in the fiscal balance.
(d) Receipts will differ from the cash receipts reconciliation published in Budget Statement 5 as the table above excludes Future Fund earnings while Statement 5 includes Future Fund earnings.
Changes to receipt estimates since MYEFO
Since the 2012‑13 MYEFO, tax receipts have been revised down by $12.9 billion in 2012‑13, $16.6 billion in 2013‑14 and $61.0 billion over the four years to 2015‑16.
Company tax is the single largest contributor to the write‑downs in tax receipts. Lower than expected CGT and resource rent taxes have compounded the fall in company tax receipts.
- Of this, company tax receipts account for $5.2 billion in 2012‑13, $7.2 billion in 2013‑14 and $24.3 billion over the four years to 2015‑16. This reflects lower than expected company profitability across most sectors of the economy. Lags in the company tax system mean that lower profitability in 2012‑13 will be felt across a number of years.
- Gross resource rent taxes, comprised of minerals resource rent taxes (MRRT) and petroleum resource rent taxes (PRRT), have been written‑down significantly compared to the 2012‑13 MYEFO. Resource rent taxes are expected to be $3.6 billion lower in 2012‑13 and $3.2 billion in 2013‑14. These taxes are highly sensitive to the assumptions regarding production volumes, capital deductions, commodity prices and the exchange rate.
- While MRRT receipts have been much lower than expected in 2012‑13, they are expected to grow over the forward estimates. MRRT receipts will be supported by very strong increases in production volumes as the economy transitions from the investment phase of the mining boom towards a record expansion in resources production and exports (iron ore exports are expected to grow by around 40 per cent from 2012‑13 to 2016‑17). In addition, capital expenditure — which can be immediately written off for MRRT purposes — is expected to be lower in the out years than projected at the 2012‑13 MYEFO (see Budget Statement 2, Box 8).
- Net MRRT receipts are expected to be around $1.8 billion lower in 2012‑13 and $1.7 billion lower in 2013‑14.
- PRRT receipts are expected to be weaker across the entire forward estimates, reflecting, in part, a softening in petroleum prices and lower assumed production levels across a number of relevant fields.
- CGT, which is an important component of individuals, companies and superannuation funds tax, is expected to be lower by $1.8 billion in 2012‑13 and $2.9 billion in 2013‑14, reflecting the continuing utilisation of a large amount of capital losses.
Compared to the 2012‑13 MYEFO, carbon pricing mechanism (CPM) receipts are expected to be $140 million higher in 2012‑13, largely owing to lower free permit allocations offsetting reduced carbon emissions. Receipts are expected to be $530 million lower in 2013‑14; largely reflecting downward revisions to forecast emissions, and the lower international carbon price associated with the advance auctions of permits.
Indirect taxes excluding CPM have been revised down by $760 million in 2012‑13, largely reflecting a $515 million write‑down of GST and a $900 million downgrade in excise receipts, partly offset by higher customs duties. Indirect taxes, excluding CPM, have been revised down by around $1.4 billion in 2013‑14 and $5.2 billion over the four years to 2015‑16.
Since the 2012‑13 MYEFO, non‑tax receipts have declined by $3.7 billion in 2012‑13, largely reflecting the deferral of receipts relating to the auction of the digital dividend spectrum, previously anticipated to be received in 2012‑13. The timing of final digital dividend receipts was changed in response to industry concern about paying for both the reissue of expiring spectrum licences and spectrum licences won at the digital dividend auction within a short period of time.
Policy decisions since the 2012‑13 MYEFO are expected to increase receipts by $255 million in 2013‑14, $5.6 billion in 2014‑15, $9.5 billion in 2015‑16 and $10.1 billion in 2016‑17. These decisions include: increasing the Medicare levy to help fund DisabilityCare Australia, protecting the integrity of the income tax base, improving the sustainability of the superannuation system and better targeting tax expenditures.
The Medicare levy will be increased by half a percentage point from 1 July 2014 to provide strong and stable funding for DisabilityCare Australia. This is expected to increase tax receipts by $11.4 billion over the forward estimates period. All of the monies raised by the additional levy will go directly to the DisabilityCare Australia Fund. This fund is expected to generate $467 million in non‑tax receipts over the forward estimates period. To assist with establishing DisabilityCare Australia, the Government will make a share of the DisabilityCare Australia Fund available to States and Territories.
The Budget also contains measures to protect the integrity of the income tax base and promote better tax compliance, including the following:
- the Protecting the corporate tax base from erosion and loopholes package contains a series of measures to address abuses that take advantage of design flaws, vulnerabilities and unexpected interactions in the corporate tax law from changes made in the early 2000s. This package is expected to increase tax receipts by $4.1 billion over the forward estimates period;
- providing additional resources to the Australian Taxation Office (ATO) to expand data matching with third party information. This is expected to increase tax receipts by $432 million over the forward estimates period; and
- providing additional resources to the ATO to address risks to the tax system from exploitation of trust structures. This is expected to increase tax receipts by $217 million over the forward estimates period.
Other key revenue measures include the following:
- deferring the Clean Energy Future personal income tax cuts that were scheduled to commence on 1 July 2015. These tax cuts were designed to assist households with the effects of an increase in the carbon price from $25.40 in 2014‑15 to $29 in 2015‑16. The carbon price in 2015‑16 is now projected to be lower ($12.10) than the fixed price in 2014‑15. As a result, households will not experience the impact of an additional rise in the carbon price and the 2015‑16 tax cuts will be deferred until the carbon price in the Budget is estimated to rise above $25.40. This is currently projected to occur in 2018‑19. Households will receive more assistance than was anticipated to be necessary to assist them with the cost of living impact of the carbon price in 2015‑16. This measure is expected to increase tax receipts by $1.5 billion over the forward estimates period;
- better targeting support for research and development (R&D) by limiting access to the R&D tax incentive so that it only applies to companies with annual aggregate Australian turnover of less than $20 billion from 1 July 2013. This is estimated to increase tax receipts by $1.1 billion over the forward estimates period;
- extending the requirement to make monthly pay‑as‑you‑go (PAYG) income tax instalments to include all large entities in the PAYG instalment system, including trusts, superannuation funds, sole traders and large investors. This measure is expected to have a gain to tax receipts of $1.4 billion over the forward estimates period;
- phasing out the Net Medical Expenses Tax Offset as reforms to aged care are implemented and DisabilityCare Australia is introduced. All existing claimants will be grandfathered for two years, and claims for aged care, disability aids and attendant care will be allowed through until 30 June 2019. This is estimated to increase tax receipts by $968 million over the forward estimates period;
- restructuring the Import Processing Charge to recover the costs of all import related cargo and trade functions undertaken by the Australian Customs and Border Protection Service. This is expected to increase tax receipts by $674 million over the forward estimates period;
- simplifying the design and administration of the proposed higher superannuation concessional contributions cap by providing a $35,000 concessional cap to anyone who meets certain age requirements. This is estimated to increase tax receipts by $365 million over the forward estimates period, as the overall receipts cost of providing the higher cap will fall from $1.5 billion to $1.2 billion;
- better targeting the tax exemption for earnings on superannuation assets supporting retirement income streams, by limiting it to the first $100,000 of annual earnings for each individual, and taxing earnings above that threshold at the concessional rate of 15 per cent. This is expected to increase tax receipts by $356 million over the forward estimates period; and
- indexing tobacco excise to average weekly ordinary time earnings (AWOTE), instead of the CPI. Due to taxpayer confidentiality, this measure has been incorporated into the Budget estimates as a parameter and other variation.
There are also a small number of policy measures since the 2012‑13 MYEFO which reduce tax receipts. These include:
- providing petroleum resource rent taxpayers with certainty regarding the scope of deductible expenditure, following recent litigation. This is expected to reduce receipts by $120 million over the forward estimates period; and
- making the superannuation excess contributions tax system fairer by taxing excess concessional contributions at an individual's marginal tax rate plus an interest charge, rather than always taxing them at the top marginal tax rate. This is expected to reduce tax receipts by $55 million over the forward estimates period.
The broader effect on the budget of revisions to the carbon price is outlined in Box 2.
Box 2: Changes to Clean Energy Future Plan
The Government's Clean Energy Future (CEF) Plan is designed to reduce Australia's emissions through a carbon price while supporting households and industry transition to a low‑carbon economy.
Starting at $23 in 2012‑13, the carbon price is fixed for the first three years until 1 July 2015 when the scheme will transition to a flexible price linked to the European Union (EU) emissions trading scheme. The price in Europe has fallen due in large part to ongoing economic weakness. The flexible carbon price underpinning the 2013‑14 Budget has been revised down (see Box 9 in Statement 2).
The carbon price is designed to reduce emissions at a low cost as part of global efforts to improve environmental outcomes. It was not designed to bolster the budget. While the price varies with market movements under an emissions trading scheme, there is a hard cap on the amount of net carbon emissions across the economy. A lower carbon price implies a lower cost to businesses and a lower impact on consumer prices.
Taking into account updated emissions estimates, the revised permit price is estimated to reduce carbon price revenue by around $6 billion over the four years to 2015‑16, offset by automatic adjustments and other related policy changes. The overall impact on the fiscal balance is broadly budget neutral over the four years to 2015‑16. On the same basis, carbon price receipts are estimated to be $3.7 billion lower over the four years to 2015‑16. Taking into account the related changes in this Budget, the net negative impact on the underlying cash balance is around $1 billion over the four years to 2015‑16.
Significant elements of industry assistance in the CEF Plan will move in line with changes in the carbon price. These elements include permit based assistance to emissions‑intensive, trade‑exposed entities under the Jobs and Competitiveness Program, support for electricity generators under the Energy Security Fund and assistance provided through the Coal Sector Jobs Package. The value of assistance under these programs is estimated to be reduced by around $3.9 billion over the four years to 2015‑16, in line with the lower carbon‑related costs they face.
The CEF Plan included a range of household assistance measures, including tax cuts and increases in pensions, allowances, family payments and other benefits. The household assistance remains in place and the value of payments will be maintained by the normal indexation arrangements. To the extent the carbon price in 2015‑16 falls below what had previously been projected, households will receive more assistance than was anticipated to be necessary to assist with the cost of living impact of carbon pricing.
The Government has decided, however, to defer the CEF personal income tax cuts scheduled to commence on 1 July 2015. There will be no change to the tax cuts applied from the 2012‑13 income year.
The additional tax cuts from 1 July 2015 were intended to provide assistance for low and middle income households for a projected increase in the carbon price to $29 in 2015‑16, from the fixed price of $25.40 in 2014‑15. As the carbon price in 2015‑16 is now projected to be lower than $25.40 these tax cuts will be deferred until the carbon price estimated in the Budget is above $25.40. Based on current projections, the carbon price is estimated to be above $25.40 in 2018‑19. The Government will continue to monitor the carbon price to ensure the adequacy of household assistance is consistent with its commitments and will bring forward the additional tax cuts should the carbon pricing outlook change earlier than projected.
The Government has also made some decisions to refine particular CEF programs. The Australian Renewable Energy Agency, the Clean Technology Program and the Biodiversity Fund will all have funding adjusted, including to extend the life of the programs over a longer period. The overall level of funding for the clean technology programs has not changed and ARENA funding will remain at over $3 billion over the life of the program.
With the lower projected carbon price, the level of funding for some programs, such as the Carbon Capture and Storage Flagships and the National Low Emissions Coal Initiative, has been reduced. Calls for support from the Regional Structural Adjustment Assistance program have been negligible and this program will not continue.
As part of the second commitment period under the Kyoto Protocol, the Government has elected to include abatement from additional land based activities to count towards Australia's international targets. Farmers and landholders will now be able to sell a wider range of carbon credits to liable entities under the carbon pricing mechanism.
Payment policy decisions since MYEFO
Since MYEFO, total cash payments for 2013‑14 have increased by $3.4 billion, comprised of new policy decisions which have increased payments by $975 million and parameter and other variations which have increased payments by $2.5 billion.
Major policy decisions since MYEFO that have increased cash payments in 2013‑14 and over the five years to 2016‑17 include:
- the Better Schools: A National Plan for School Improvement package. These measures will deliver a new school funding system to ensure that every Australian school has the necessary funds to give students the support they need. The cost of these measures assumes the acceptance by all states and territories and non‑government school education authorities of the proposed school funding reforms. These measures are expected to increase payments to schools by $473 million in 2013‑14 ($9.8 billion over six years from 2014‑15);
- implementing DisabilityCare Australia, the national disability insurance scheme, to be jointly funded by Commonwealth, State and Territory governments, which will mean that, for the first time, Australians with significant and permanent disability will get the support they need, when they need it. DisabilityCare Australia will provide eligible participants with reasonable and necessary support tailored to their individual circumstances in South Australia (for young children), Tasmania (for young adults), the Hunter in New South Wales, and the Barwon area of Victoria from 1 July 2013, and in the Australian Capital Territory and the Barkly region of the Northern Territory from 1 July 2014. DisabilityCare Australia will provide state‑wide coverage in New South Wales, South Australia and the Australian Capital Territory by 1 July 2018 and in Victoria, Queensland, Tasmania and the Northern Territory from 1 July 2019. This measure is expected to increase Commonwealth payments by $27 million in 2013‑14 ($14.3 billion over the seven years from 2012‑13 until full implementation, including funding in the 2012‑13 budget);
- a number of new and amended listings on the Pharmaceutical Benefits Scheme and the Repatriation Pharmaceutical Benefits Scheme, which are expected to increase payments by $139 million in 2013‑14 ($682 million over the five years to 2016‑17);
- continuing, in 2013‑14, Australia's contribution to international stabilisation and counter‑terrorism in Afghanistan and the Middle East Area of Operations. This measure is expected to increase payments by $534 million in 2013‑14 ($586 million over the five years to 2016‑17); and
- the Royal Commission into Institutional Reponses to Child Sexual Abuse. This measure is expected to increase payments by $130 million in 2013‑14 ($434 million over the five years to 2016‑17).
The impact of these policy decisions on payments has been more than offset over the five years to 2016‑17 by a number of decisions that have reduced cash payments, including:
- a range of changes to Family Tax Benefit (FTB) payments, including not proceeding with the 2012‑13 Budget measure Spreading the Benefits of the Boom; changing the financial support arrangements for families following the birth or adoption of a child; and continuing the current indexation pauses on upper income thresholds and supplements. Changes to family payments are expected to decrease overall payments by $349 million in 2013‑14 ($4.3 billion over the five years to 2016‑17);
- offering Student Start‑up Scholarships as income contingent loans, rather than as grants, to all new full‑time higher education students in receipt of Youth Allowance, Austudy or ABSTUDY from 1 January 2014. This measure is expected to decrease payments by $35 million in 2013‑14 ($1.2 billion over the five years to 2016‑17);
- applying an efficiency dividend of 2.0 per cent in 2014 and 1.25 per cent in 2015 to most grants provided under the Higher Education Support Act 2003. This measure is expected to decrease payments by $85 million in 2013‑14 ($903 million over the five years to 2016‑17, although funding is still projected to grow by $1.1 billion over this period);
- removing the discounts applying to up‑front payments and voluntary repayments under the Higher Education Loan Program from 1 January 2014. This measure is expected to decrease payments by $34 million in 2013‑14 ($267 million over the five years to 2016‑17);
- realigning indexation of the Medicare Benefits Schedule to the financial year. This measure is expected to decrease payments by $151 million in 2013‑14 ($653 million over the five years to 2016‑17); and
- deferring the commitment to 0.5 per cent of Gross National Income on Official Development Assistance by one year to 2017‑18. This measure is expected to decrease payments by $1.9 billion over the five years to 2016‑17. Under this new profile, ODA spending is forecast to grow by 42.4 per cent from 2013‑14 across the forward estimates.
Further details of Government policy decisions are provided in Budget Paper No. 2, Budget Measures 2013‑14. The expense estimates provided in Budget Paper No. 2 are in accrual terms and may not align exactly with the underlying cash payment figures provided in this Statement.
Payment estimates variations since MYEFO
This Budget also incorporates some major changes in expected payments in 2013‑14 as a result of parameter and other variations since MYEFO.
Major increases in expected payments in 2013‑14 as a result of parameter and other variations since MYEFO include:
- payments under the Natural Disaster Relief and Recovery Arrangements, which are expected to be $219 million higher in 2013‑14 ($1.9 billion over the four years to 2015‑16), primarily relating to relief and recovery payments for the floods in early 2013 in Queensland and northern New South Wales;
- Research and Development Tax Incentive payments, which are expected to be $135 million higher in 2013‑14 ($574 million over the four years to 2015‑16), largely reflecting higher than expected large claims in the first year of operation of the 2009‑10 Budget measure An Innovation and Higher Education System for the 21st Century — Research and Development Tax Credit. It is expected that a higher level of claims will continue across the forward estimates;
- offshore asylum seeker management costs, which are expected to be $1.3 billion higher in 2013‑14 ($3.2 billion over the four years to 2015‑16), reflecting updated projections of irregular maritime arrivals and the cost of regional processing centres;
- Private Health Insurance payments, which are expected to increase by $474 million in 2013‑14 ($2.2 billion over the four years to 2015‑16), largely reflecting stronger than expected growth in the number of people with subsidised private health cover and more people upgrading their level of health insurance. Around 55 per cent of Australians now have some form of private health cover, the largest proportion in over 20 years;
- Medicare Benefits Schedule (MBS) payments, which are expected to be $454 million higher in 2013‑14 ($2.1 billion over the four years to 2015‑16), reflecting growth in the use of medical services owing in part to increases in the primary care workforce and in the use of high value items on the MBS;
- official development assistance eligible expenses associated with irregular maritime arrivals, which are expected to be $431 million higher in 2013‑14 ($943 million over the four years to 2015‑16), reflecting updated projections of irregular maritime arrivals. The Government will cap the amount of expenditure in the ODA budget that can be reprioritised for ODA eligible IMA expenses at $375 million per year;
- payments of Family Tax Benefit (FTB), which are expected to be $276 million higher in 2013‑14 ($1.0 billion over the four years to 2015‑16), largely reflecting higher than previously projected recipient numbers, payment rates and top‑up payments made after the lodgement of tax returns; and
- Youth Allowance payments for unemployed youth, which are expected to increase by $125 million in 2013‑14 ($423 million over the four years to 2015‑16), reflecting a higher than expected number of recipients continuing to receive income support.
Major reductions in expected payments in 2013‑14 as a result of parameter and other variations since MYEFO, include:
- payments under the Pharmaceutical Benefits Scheme (PBS), which are expected to be $176 million lower in 2013‑14 ($1.1 billion over the four years to 2015‑16), reflecting the impact of price disclosure in line with the agreement reached with industry in 2010, which progressively reduces the price of some PBS medicines that are subject to competition;
- Veterans' Affairs payments, which are expected to be $75 million lower in 2013‑14 ($409 million over the four years to 2015‑16), reflecting a forecast natural decline in the number of beneficiaries across a range of programs;
- Tertiary Student Assistance payments, which are expected to be $376 million lower in 2013‑14 ($979 million over the four years to 2015‑16). This is largely related to the 2011‑12 Budget measure, Supporting Families with Teenagers, which is designed to align the system so that FTB‑A will be the primary payment for full‑time students and Youth Allowance for those out of school. This has resulted in a decrease in client numbers for Youth Allowance;
- Income Support for Carers payments, which are expected to be $115 million lower in 2013‑14 ($509 million over the four years to 2015‑16), largely reflecting lower than expected growth in recipient numbers; and
- Low Income Supplement (LIS) payments, which are expected to be $141 million lower in 2013‑14 ($497 million over four years to 2015‑16). In 2012‑13, the LIS had a smaller than projected customer take‑up and it is forecast that low customer numbers will continue as the eligible population is expected to remain stable.
Consistent with previous budgets, the underlying cash balance has been improved by the regular draw down of the conservative bias allowance. Details of this draw down are provided in Appendix B of Statement 6, Expenses and Net Capital Investment.
Fiscal balance estimates
The fiscal deficit is expected to be $13.5 billion (0.8 per cent of GDP) in 2013‑14, a change of $17.8 billion since the $4.3 billion surplus expected in MYEFO.
Table 7 provides a reconciliation of the variations in the fiscal balance since the 2012‑13 Budget.
| Estimates | Projections | ||||
|---|---|---|---|---|---|
| 2012‑13 $m |
2013‑14 $m |
2014‑15 $m |
2015‑16 $m | ||
| 2012‑13 Budget fiscal balance | 2,500 | 2,646 | 7,020 | 9,457 | |
| Per cent of GDP | 0.2 | 0.2 | 0.4 | 0.5 | |
| Changes from 2012‑13 Budget to 2012‑13 MYEFO | |||||
| Effect of policy decisions(a) | 386 | 5,852 | 2,442 | 2,424 | |
| Effect of parameter and other variations | -1,679 | -4,222 | -2,539 | -2,118 | |
| Total variations | -1,293 | 1,629 | -97 | 305 | |
| 2012-2013 MYEFO fiscal balance | 1,207 | 4,275 | 6,923 | 9,762 | |
| Per cent of GDP | 0.1 | 0.3 | 0.4 | 0.5 | |
| Changes from 2012‑13 MYEFO to 2013‑14 Budget | |||||
| Effect of policy decisions(a)(b) | |||||
| Revenue | -36 | 111 | 5,533 | 9,766 | |
| Expenses | 1,978 | 382 | -1,014 | -3,054 | |
| Net capital investment | 63 | 196 | 356 | 87 | |
| Total policy decisions impact on fiscal balance | -2,077 | -467 | 6,191 | 12,733 | |
| Effect of parameter and other variations(b) | |||||
| Revenue | -13,742 | -15,523 | -15,792 | -18,108 | |
| Expenses | 4,413 | 65 | 2,973 | -1,742 | |
| Net capital investment | 1,242 | 1,717 | 605 | 174 | |
| Total parameter and other variations impact on fiscal balance | -19,396 | -17,306 | -19,370 | -16,540 | |
| 2013‑14 Budget fiscal balance | -20,266 | -13,497 | -6,255 | 5,955 | |
| Per cent of GDP | -1.3 | -0.8 | -0.4 | 0.3 | |
(a) Excludes secondary impacts on public debt interest of policy decisions and offsets from the Contingency Reserve for decisions taken.
(b) A positive number for revenue indicates an increase in the fiscal balance, while a positive number for expenses and net capital investment indicates a decrease in the fiscal balance.
Changes in revenue estimates since MYEFO
Changes in accrual revenue are generally driven by the same factors as cash receipts, though differences arise where revenue raised in a given year is not received in that year.
Changes in expense estimates since MYEFO
Movements in accrual expenses over the forward estimates are broadly similar to the movements in cash payments. The key exceptions include:
- superannuation benefits, where there are differences between the timing of cash payments and accrued expenses; and
- the Natural Disaster Relief and Recovery Arrangements, where expenses are recognised in the financial year in which the disaster occurs, rather than when cash payments are made.
More detailed information on expenses can be found in Statement 6, Expenses and Net Capital Investment.
Net capital investment estimates
Net capital investment is broadly defined as the sale and acquisition of non‑financial assets less depreciation expenses. It provides a measure of the overall growth in capital assets (including buildings and infrastructure, specialist military equipment, and computer software) after taking into account depreciation and amortisation as previously acquired assets age.
In 2013‑14, net capital investment is forecast to be $1.9 billion higher than forecast in MYEFO, largely reflecting the acquisition of military equipment and the construction of Defence support facilities as outlined in the 2013 Defence White Paper. Capital investment in 2013‑14 includes payments for 12 new‑build EA‑18G Growler aircraft, three Air Warfare Destroyers, and two Landing Helicopter Dock amphibious ships, the replacement of Australia's Armidale Class Patrol Boats and continued investment in the development of fifth‑generation F‑35A Joint Strike Fighter aircraft.
More detailed information on net capital investment can be found in Statement 6, Expenses and Net Capital Investment.
Net debt, net financial worth and net worth
The Government's medium‑term fiscal strategy commitment to achieve surpluses, on average, over the medium term, assists in reducing net debt over time as a share of GDP. The medium‑term fiscal strategy also commits to improving the Government's net financial worth over the medium term.
Table 8 provides a summary of Australian Government general government sector net financial worth, net worth, net debt and net interest payments.
The large write‑downs in tax receipts in 2012‑13 and over the forward estimates have contributed to budget deficits out to 2014‑15, necessitating a higher borrowing requirement. This has, in turn, resulted in higher net debt, and lower net worth and net financial worth than forecast at MYEFO.
| Estimates | Projections | |||||
|---|---|---|---|---|---|---|
| 2012‑13 $b |
2013‑14 $b |
2014‑15 $b |
2015‑16 $b |
2016‑17 $b | ||
| Financial assets | 242.2 | 264.0 | 286.0 | 308.8 | 343.0 | |
| Non-financial assets | 110.3 | 112.6 | 115.1 | 116.9 | 119.1 | |
| Total assets | 352.5 | 376.6 | 401.1 | 425.8 | 462.2 | |
| Total liabilities | 513.6 | 550.1 | 577.0 | 593.9 | 618.1 | |
| Net worth | -161.1 | -173.5 | -175.9 | -168.2 | -156.0 | |
| Net financial worth(a) | -271.4 | -286.1 | -290.9 | -285.1 | -275.1 | |
| Per cent of GDP | -17.8 | -17.9 | -17.3 | -16.1 | -14.8 | |
| Net debt(b) | 161.6 | 178.1 | 191.6 | 191.2 | 185.7 | |
| Per cent of GDP | 10.6 | 11.1 | 11.4 | 10.8 | 10.0 | |
| Net interest payments | 8.2 | 7.8 | 8.4 | 9.8 | 7.7 | |
| Per cent of GDP | 0.5 | 0.5 | 0.5 | 0.6 | 0.4 | |
(a) Net financial worth equals total financial assets minus total liabilities.
(b) Net debt equals the sum of deposits held, government securities, loans and other borrowing, minus the sum of cash and deposits, advances paid and investments, loans and placements.
Net debt for the Australian Government general government sector is estimated to be $178.1 billion (11.1 per cent of GDP) in 2013‑14, $33.5 billion higher than estimated at MYEFO.
The increase in 2013‑14 net debt since MYEFO is primarily driven by a higher issuance of Commonwealth Government Securities, which has been partly offset by an increase in the value of certain investments held by the Future Fund.
Australian Government net debt continues to remain low by international standards. The average net debt for the major advanced economies is expected to peak at around 92.6 per cent of GDP in 2014, whilst Australia's net debt will peak at 11.4 per cent of GDP in 2014‑15. Australia's net debt position is then expected to reduce to 10.0 of GDP by 2016‑17.
The changes to net debt described above also impact on net financial worth and net worth.
- Net financial worth is estimated to be ‑$286.1 billion in 2013‑14, compared to the MYEFO estimate of ‑$251.5 billion.
- Net worth is forecast to be ‑$173.5 billion in 2013‑14, compared to the MYEFO estimate of ‑$138.3 billion.
Improving the government's balance sheet over the medium term provides the Government with the capacity and flexibility to respond to unanticipated adverse events and longer‑term challenges.
Further details on the balance sheet are outlined in Statement 7, Asset and Liability Management.
Medium‑term fiscal outlook
Table 9 outlines the underlying cash balance and net debt across the medium term. On current projections, there is an underlying cash surplus of $21.4 billion by 2023‑24.
| Medium-term projections | |||||||
|---|---|---|---|---|---|---|---|
| 2017-18 | 2018-19 | 2019-20 | 2020-21 | 2021-22 | 2022-23 | 2023-24 | |
| Underlying cash balance ($b)(a) | 18 | 27 | 26 | 24 | 26 | 24 | 21 |
| Per cent of GDP | 0.9 | 1.3 | 1.2 | 1.0 | 1.1 | 0.9 | 0.8 |
| Net Debt ($b) | 150 | 106 | 69 | 30 | -5 | -38 | -68 |
| Per cent of GDP | 7.6 | 5.1 | 3.2 | 1.3 | -0.2 | -1.5 | -2.5 |
(a) Excludes expected net Future Fund earnings.
Note: In addition to the underlying cash balance, changes in net debt include increases in the value of the non‑equity assets of the Future Fund due to earnings and capital gains, and changes in the market value of debt.
The medium term fiscal projections reflect the Government's fiscal strategy. Real growth in spending is assumed to be held to 2 per cent a year, on average, until the underlying cash surplus is at least 1 per cent of GDP and while the economy is growing at or above trend. The level of tax receipts is allowed to return naturally as the economy grows until it reaches 23.7 per cent of GDP (2018‑19). That ratio is then held constant.
On current projections, the underlying cash balance is expected to reach 1 per cent of GDP in 2018‑19, one year later than projected at MYEFO (Chart 3). Net debt is projected to return to zero in 2021‑22, one year later than projected at MYEFO (Chart 4). This delay is mainly attributable to the weaker outlook for the underlying cash balance.
Chart 3: Underlying cash balance projected to 2023‑24
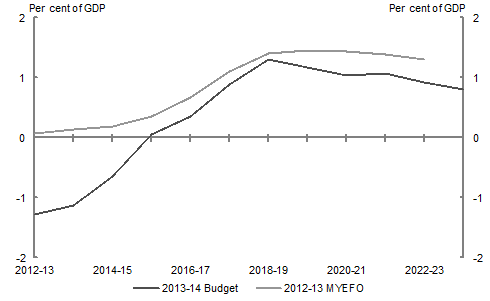
Source: Treasury projections.
Chart 4: Government net debt projected to 2023‑24
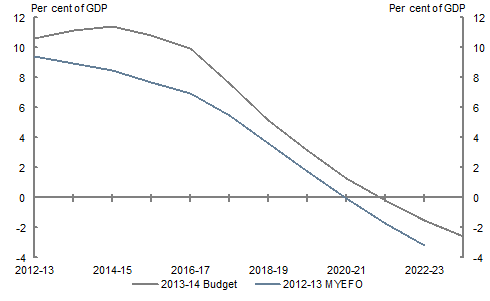
Source: Treasury projections.
Note: Where possible, Budget documents are available in HTML and for downloading in Portable Document Format(PDF). If you require further information on any of the tables or charts on this website, please contact The Treasury.
