




Statement 4: Fiscal policy in the current economic environment (Continued)
Medium‑term outlook for fiscal sustainability
Assessing fiscal sustainability involves examining a government's capacity to meet its liabilities without placing upward pressure on interest rates or impeding economic growth. A government's finances can be judged as fiscally sustainable when the government can meet its current and future financial obligations without the need for unrealistically large and disruptive adjustments to tax and expenditure programs.
A government's capacity to meet its liabilities depends on a wide range of factors. These include the level of debt, the values of financial and non‑financial assets and liabilities, interest rates and economic growth prospects. Fiscal sustainability also depends on the extent to which a government's budget position is supported by factors that are permanent or temporary in nature, the quality of institutions and whether a government is in a position to meet any contingent liabilities.
There is no single indicator that adequately captures all of these elements. While a credible plan to return the budget to surplus and low levels of government debt are key, there are also a number of analytical measures that can shed light on aspects of fiscal sustainability. There are arguments for and against each analytical measure, so it is important that an assessment of fiscal sustainability consider the measures collectively, rather than in isolation.
Sustainability assessments begin with the budget balance
A starting point in assessing fiscal sustainability is the trajectory of the underlying cash balance. The GFC led to a substantial deterioration of budget balances in most countries. Australia was no exception, with the operation of the automatic stabilisers and the use of discretionary fiscal stimulus pushing the budget into deficit (although the support to the economy provided by the stimulus partially offset this impact). However, we have fared better than most, as a result of many factors, including the efficacy of our fiscal expansion, which helped limit the economic impacts of the crisis.
As described earlier in this Statement, while the temporary fiscal stimulus measures have since been unwound, the GFC and the resources investment boom have had enduring impacts on the government's tax receipts. Coupled with weakness in nominal GDP growth due to the high Australian dollar and falling global commodity prices, this has seen the underlying cash balance remain in deficit.
The settings in this Budget are expected to return the budget to balance in 2015‑16 and to surplus by 2016‑17. The plan to return the budget to surplus is clear and achievable. It involves savings measures to address major areas of fiscal pressure in the long term and commitments to constrain growth in real spending and allow tax receipts to recover naturally as the economy grows.
Australia's budget position compares favourably with most other advanced economies (Chart 10). For comparability, Australian data are presented for consolidated general government, including state and local governments.9 In 2016‑17, when the Australian Government budget is projected to return to surplus, the IMF Fiscal Monitor projects that only 10 of 30 advanced economies will be in surplus. Collectively, the advanced economies are expected to run a budget deficit of 2.6 per cent of GDP in that year.
Chart 10: Comparison of budget balances for advanced economies 2012
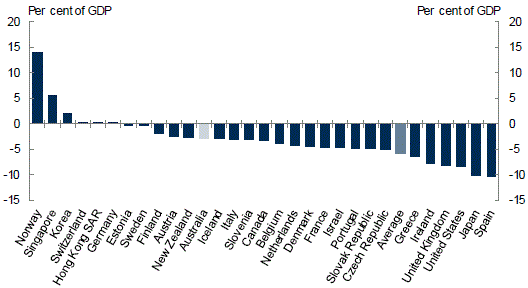
Note: Data are for general government (that is, consolidated Commonwealth, State, and local government). Data for Australia are for 2012‑13, from Budget Paper No. 3 Appendix C, and will differ from those presented elsewhere in Budget Paper No. 1, which are for the Commonwealth Government only.
Source: IMF Fiscal Monitor April 2013 and Treasury.
Distinguishing between temporary and permanent factors is important
An assessment of fiscal sustainability should also consider the factors driving the budget balance. A common approach is to adjust the budget balance for the impact of economic factors that are considered likely to be temporary. These temporary influences may obscure the underlying fiscal position and, therefore, the extent to which fiscal adjustments might be needed in future to maintain sustainability.
The cyclically‑adjusted balance (CAB) estimates what the budget balance would be if the real economy was operating at full capacity, consistent with stable inflation. This provides an indication of the size of the automatic fiscal stabilisers — that is, the cyclical impact on the budget of the economy being either above or below full capacity.
The CAB is widely used internationally, with estimates published by the IMF, OECD and a number of individual countries. IMF estimates, updated by Treasury for the 2013‑14 Budget, suggest that Australia is currently in a modest cyclically‑adjusted deficit, but that it is in a better position than most other countries, particularly the major advanced economies (Chart 11).10 Australia's CAB from 2012‑13 onward also compares favourably to that of Canada, another commodity‑exporting advanced economy that came through the GFC in relatively good shape.
Chart 11: Cyclically adjusted balance
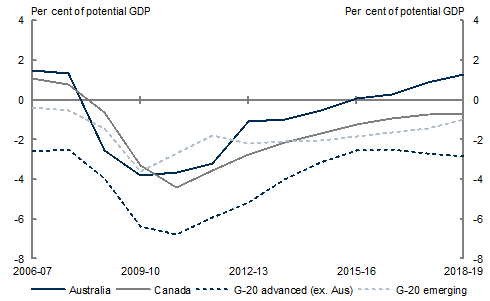
Note: Australian data are for Commonwealth government on a financial year basis. Data for other countries are for total general government and are on a calendar year basis (for example, 2006‑07 data are for calendar year 2006).
Source: IMF Fiscal Monitor April 2013 and Treasury.
Estimates of the CAB are sensitive to assessments of an economy's productive potential, which is difficult to estimate in real time. They also need to be considered in the context of Australia's low debt levels, which are discussed in the next section.
Structural budget balance estimates go a step further, adjusting the cyclically‑adjusted balance for other economic factors considered likely to have large temporary impacts on the budget. Like the CAB, estimates of the structural budget balance are subject to considerable uncertainty, due to their sensitivity to assumptions and reliance on values of difficult to estimate concepts, such as the output gap and the structural level of the terms of trade. These uncertainties caution against over‑reliance on point estimates and emphasise the need to consider a range of plausible estimates. International experience also cautions against the use of CAB and structural balance estimates for setting fiscal policy due, in particular, to the difficulty in making reliable estimates in real time.
The key assumption underpinning structural balance estimates in Australia's case is the long‑run assessment of our terms of trade, which have risen significantly over the past decade, largely due to strong growth in demand for Australia's non‑rural commodity exports from emerging Asia. While the terms of trade have already fallen from their peak in the September quarter of 2011 and are projected to fall further as global supply of non‑rural commodities increases, there is considerable uncertainty around terms of trade projections, including in the medium‑to‑long term.
It is also difficult to capture the relationship between economic aggregates and revenue, which can vary considerably over time, depending on how different tax bases are affected. This is especially the case when the economy is experiencing large shocks, such as those associated with the resources boom and the GFC over the past decade.
Structural budget balance estimates produced for Australia by organisations such as the OECD indicate that, prior to the GFC, underlying cash surpluses were supported by temporary factors, including the high terms of trade, an economy operating above its long‑run potential and buoyant asset prices. This drove a temporary surge in tax receipts that was used to finance spending increases and tax reductions, causing deterioration in the structural budget position.
The GFC led to a further deterioration in the structural budget position, largely due to the Government's temporary fiscal stimulus measures and some of the factors that drove the fall in the tax share of GDP described earlier in this Statement. The fiscal stimulus measures have since been unwound; however, the reduced tax share of GDP continues to weigh on the budget.
Continued improvement in the structural budget position over the short‑ and medium‑term is supported by the Government's long‑term savings measures (described in Box 3) and the disciplines imposed by its commitments to:
- allow tax receipts to recover naturally as the economy improves, while keeping taxation as a share of GDP below its 2007‑08 level on average; and
- hold real spending growth to 2 per cent a year, on average, until the budget surplus reaches at least 1 per cent of GDP, and while the economy is growing at or above trend.
This will reinforce the sustainability of the fiscal position at a pace that does not undermine economic growth or threaten jobs.
The strength of the government balance sheet is critical
Fiscal sustainability ultimately comes down to the government's ability to meet its current and future liabilities. A common measure of a government's liabilities is net debt. Net debt is preferred to gross debt as it takes into account total debt liabilities as well as debt‑equivalent assets held by the government.
The Government's medium‑term fiscal strategy takes a broader perspective still, targeting an improvement in net financial worth over time. Net financial worth takes account of financial assets and liabilities not included in net debt, such as equity investments and government employee superannuation liabilities. While more comprehensive than net debt, net financial worth measures are not widely available across countries and therefore fiscal sustainability assessments often fall back onto net debt comparisons.
Chart 12 shows that Australia has retained its strong balance sheet position with much lower debt levels than other advanced countries (these data are also on a total general government basis for comparability).11 The expected peak in Australia's general government net debt (comprising the Australian Government, state and local governments) of 14.9 per cent of GDP in 2014‑15 is around one‑fifth of the average level in that year for the advanced economies as a whole and one‑sixth of the average level for the G7.12 Within the advanced economies, only five small northern European economies have stronger net debt positions, out of the 25 advanced economies for which these data are available.
Chart 12: Comparison of net debt for advanced economies 2012
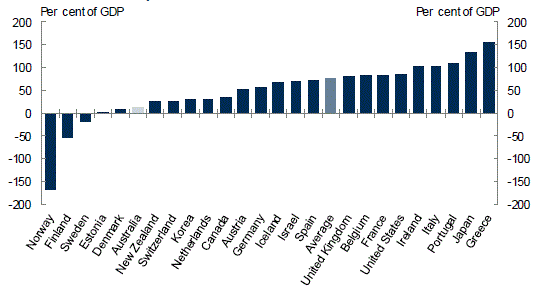
Note: Data are for general government (that is, consolidated Commonwealth, State, and local government). Data for Australia are for 2012‑13, from Budget Paper No. 3 Appendix C, and will differ from those presented elsewhere in Budget Paper No. 1, which are for the Commonwealth Government only.
Source: IMF Fiscal Monitor April 2013 and Treasury.
It is also important to take account of risks to the balance sheet from contingent liabilities, which have the potential to significantly affect fiscal sustainability. A key lesson from the GFC is that adverse events that trigger crystallisation of contingent liabilities — in particular, financial system guarantees — can dramatically transform government balance sheets. This highlights the importance of Australia's strong institutions, a resilient financial sector and sound economic management for maintaining fiscal sustainability.
While the number and value of quantifiable contingent risks on the government balance sheet has risen over the past decade, as has the number of unquantifiable risks, these contingent liabilities and other fiscal risks are comprehensively identified and detailed in the budget documents (see Budget Statement 8). Importantly, contingent risks relating to the financial sector are well managed by Australia's robust prudential regulation regime, as attested by the GFC experience and the results of recent financial system stress tests (Laker 2012).
Debt dynamics also matter
The evolution of government liabilities as a share of GDP is also important for fiscal sustainability. A common approach is to estimate the primary balance required to stabilise debt at a given share of GDP, as an indicator of the adjustment needed to ensure fiscal sustainability. For this purpose, the IMF calculates the cyclically‑adjusted primary balance (CAPB) that needs to be achieved from 2020 onward so as to achieve a given debt ratio by 2030.13
The latest IMF estimates, updated for the 2013‑14 Budget numbers, suggest that Australia faces a smaller adjustment from the current CAPB position to maintain sustainability over the medium‑term than most other advanced economies (Chart 13).14 This reflects a lower starting point for the cyclically‑adjusted primary deficit and the debt ratio.
Chart 13: Advanced economies — medium‑term adjustment
required to stabilise debt‑to‑GDP ratio by 2030
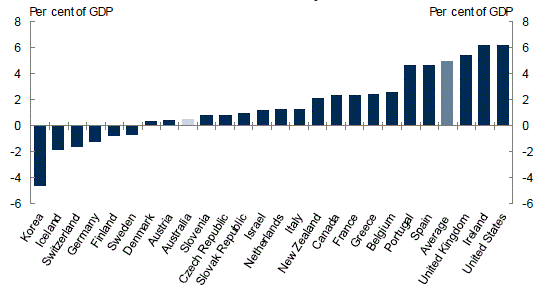
Note: Adjustment required from 2013 CAPB to bring the debt ratio down to 60 per cent (80 per cent for Japan), or to stabilise the ratio at the end‑2013 level by 2030 if the ratio is less than 60 per cent. Ratio is for gross general government debt, except for Australia, Canada, Japan, and New Zealand, where net debt ratios are used. CAPB is CAB plus gross interest payments, except for Australia, Canada, Japan, and New Zealand, where CAPB is CAB plus net interest payments. Japan has been excluded from the chart for presentational reasons. Japan's medium term adjustment required to stabilise its debt‑to‑GDP ratio by 2030 is 16.1 per cent of GDP. Australian data are for Commonwealth government and relate to financial years 2013‑14 and 2030‑31. Data for other countries are for total general government and are on a calendar year basis.
Source: IMF Fiscal Monitor April 2013 and Treasury estimates.
In interpreting these estimates it is important to bear in mind that they are based on assumptions that have most other economies stabilising their debt ratios at higher levels than Australia. Of the eight countries assessed as having a smaller medium‑term adjustment need than Australia, five have higher net debt ratios.
The IMF also calculates a required 'long‑term' adjustment, which adds to the medium‑term adjustment projected increases in age‑related spending — recognising that this will require further savings in order to stabilise the debt ratio. Although the long‑term required adjustment is larger than the medium‑term adjustment, Australia also faces a smaller adjustment on this measure than most other advanced economies (Chart 14). In addition to the factors explaining the smaller medium‑term adjustment, this also reflects a smaller projected increase in age‑related spending. Of the seven countries assessed as having a smaller long‑term adjustment need than Australia, five have higher debt ratios.15
Chart 14: Advanced economies — long‑term adjustment
required to stabilise debt‑to‑GDP ratio by 2030
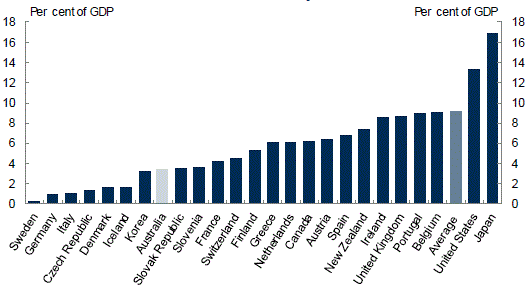
Note: As for Chart 13, with projected increase in age‑related spending added to required medium‑term primary balance adjustment.
Source: IMF Fiscal Monitor April 2013 and Treasury estimates.
Low debt means low interest payments
Australia's low net debt position is reflected in a relatively low net interest burden, notwithstanding that our stronger economy means that domestic interest rates are not as low as in many other advanced economies (Chart 15). As interest rates in countries like Japan, the United States and the United Kingdom are further below normal levels, this — together with the expectation that debt levels will remain high for some time — means that their budgets are more exposed to rising interest burdens once their economies recover and interest rates normalise.
Chart 15: Comparison of net interest payments for advanced economies 2012
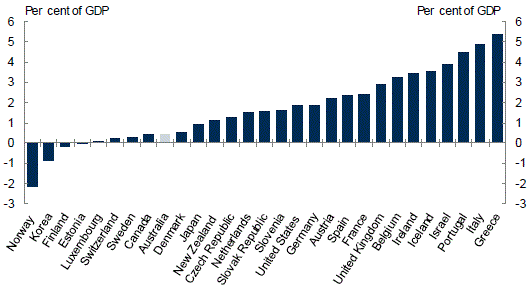
Note: Data are for general government (that is, consolidated Commonwealth, State, and local government). Data for Australia are from Budget Paper No. 3 Appendix C and will differ from those presented elsewhere in Budget Paper No. 1, which are for the Commonwealth Government only. Australian data are for 2011‑12, as forecasts of net interest payments for State and local governments for 2012‑13 are not available.
Source: OECD Economic Outlook 92 and Treasury.
9 Australia's consolidated general government underlying cash deficit is forecast in the Budget to be 2.9 per cent of GDP in 2012‑13, compared to an underlying cash deficit for the Commonwealth of 1.3 per cent of GDP.
10 The IMF's general methodology for estimating the CAB is outlined in Escolano (2010).
11 Australia's total consolidated general government net debt is forecast in the Budget to be 13.0 per cent of GDP in 2012‑13, compared to Commonwealth net debt of 10.6 per cent of GDP.
12 For Australian Government net debt, the expected peak is 11.4 per cent of GDP in 2014‑15. Australian Government net debt levels will be less than one-eighth of the average level for the major advanced economies.
13 The IMF's methodology is outlined in Schaechter et al (2012).
14 This approach is also subject to caveats. In particular, it is contingent on assumed (and somewhat arbitrary) debt targets that vary across countries and does not necessarily provide an absolute benchmark to assess sustainability across countries or across time for the same country (Escolano 2010).
15 This comparison in based on IMF net debt data where these are available, and on IMF gross debt data in the case of the Czech Republic.
Note: Where possible, Budget documents are available in HTML and for downloading in Portable Document Format(PDF). If you require further information on any of the tables or charts on this website, please contact The Treasury.
