




Part 3: Fiscal outlook
Overview
The 2013‑14 MYEFO delivers on the Government's commitment to release a comprehensive and realistic statement on the budget position. It outlines the size of the task to return the budget to sustainable surpluses and to reduce government debt.
There has been a marked deterioration in the fiscal outlook since the 2013 PEFO.
The underlying cash balance has deteriorated by $16.8 billion in the 2013‑14 year and by $68.1 billion over the forward estimates. As a result, a deficit of $47.0 billion is forecast in 2013‑14 and deficits totalling $123 billion are projected over the forward estimates.
| Estimates | |||||||
|---|---|---|---|---|---|---|---|
| 2013‑14 | 2014‑15 | ||||||
| Budget | PEFO | MYEFO | Budget | PEFO | MYEFO | ||
| Underlying cash balance($b)(a) | -18.0 | -30.1 | -47.0 | -10.9 | -24.0 | -33.9 | |
| Per cent of GDP | -1.1 | -1.9 | -3.0 | -0.6 | -1.5 | -2.1 | |
| Fiscal balance($b) | -13.5 | -25.5 | -41.8 | -6.3 | -22.1 | -31.5 | |
| Per cent of GDP | -0.8 | -1.6 | -2.7 | -0.4 | -1.3 | -1.9 | |
| Projections | |||||||
| 2015‑16 | 2016‑17 | ||||||
| Budget | PEFO | MYEFO | Budget | PEFO | MYEFO | ||
| Underlying cash balance($b)(a) | 0.8 | -4.7 | -24.1 | 6.6 | 4.2 | -17.7 | |
| Per cent of GDP | 0.0 | -0.3 | -1.4 | 0.4 | 0.2 | -1.0 | |
| Fiscal balance($b) | 6.0 | 1.8 | -18.8 | 10.8 | 7.8 | -14.5 | |
| Per cent of GDP | 0.3 | 0.1 | -1.1 | 0.6 | 0.4 | -0.8 | |
(a) Excludes expected net Future Fund earnings.
The deterioration in the budget position since the 2013 PEFO reflects the following key facts:
- Slower growth in real GDP, together with softer domestic prices and wages, have resulted in significantly lower nominal GDP, which has largely driven the reduction in tax receipts by more than $37 billion over the forward estimates.
- The softer economic outlook, coupled with changes in demand‑driven programmes and the revised assumption for projecting the unemployment rate, has increased total payments by $11.3 billion over the forward estimates.
- Actions by the Government to address the legacy issues inherited from the former Government have impacted on the budget position over the forward estimates, with the largest of these elements being the $8.8 billion grant to the Reserve Bank of Australia.
The financial implications of the Government's election commitments are fully incorporated in this MYEFO, with the exception of the commitment to reduce the headcount of the Australian Public Service (APS) by 12,000. This commitment will be reviewed in light of the findings of the National Commission of Audit. The Government remains committed to streamlining the public sector in the context of the expected headcount reduction implicit in the former Government's efficiency dividends and associated measures.
Resolving legacy issues from the former Government
In this MYEFO, the Government has taken a number of revenue and spending decisions and included provisioning in the Contingency Reserve (for expenses) or against relevant revenue heads, to deal with a number of unfunded policy issues inherited from the former Government.
The largest financial impact relates to the decision to provide the Reserve Bank of Australia with an $8.8 billion grant to rebuild its reserve fund to a level deemed prudent by the Reserve Bank Board. This will enhance the Reserve Bank's capacity to conduct its monetary policy and foreign exchange operations.
Other legacy issues where additional costs have been incurred include the following:
- Addressing the uncertainty for businesses and households associated with the backlog of 92 announced but unlegislated tax and superannuation measures will cost $2.9 billion over the forward estimates. The Government has reviewed the measures and has decided to proceed with 34 measures as announced, not to proceed with 55 measures, and to proceed with three measures with amendment.
- Restoring funding for schools to the level announced in the 2013‑14 Budget by providing $1.2 billion in funding across the forward estimates for Queensland, Western Australia, and the Northern Territory for Students First — A fairer funding agreement for schools.
- A funding shortfall of around $1.2 billion over the forward estimates inherited from the former Government's inadequate provisioning for its offshore processing policy for illegal maritime arrivals.
- Commonwealth provisioning in the Contingency Reserve and relevant revenue heads related to unfunded superannuation liabilities of New South Wales universities.
- Provisioning in the Contingency Reserve for the unfunded redundancies associated with the reduction of 14,473 APS staff implicit in the former Government's policy settings.
The Government has also identified agencies with critical funding shortfalls for their operations or capital requirements, such as the Australian Competition and Consumer Commission, and is taking steps to review these agencies comprehensively and develop solutions to place them on a more sustainable operational footing. The outcomes of this work will be outlined in the 2014‑15 Budget.
The significant pressures on the budget continue immediately beyond the forward estimates, where large demand‑driven programmes begin to ramp‑up significantly. This is particularly evident beyond 2016‑17 in funding for official development assistance, the National Disability Insurance Scheme, and Students First — A fairer funding agreement for schools (Chart 3.1 below).
Chart 3.1: Payments for official development assistance (ODA), the National Disability Insurance Scheme (NDIS), and Students First projected from 2013‑14 to 2019‑20
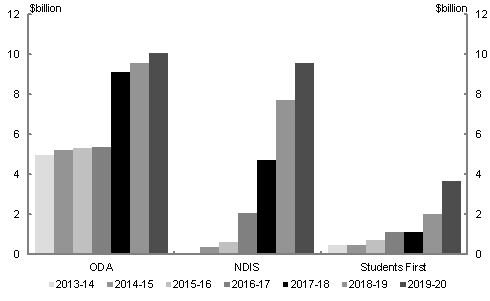
Note: Over the forward estimates official development assistance is grown in line with inflation, consistent with the Government's election commitment. The medium‑term projections for official development assistance assume a return to the former Government's target of 0.5 per cent of gross national income from 2017‑18. The projections for Schools First assume all States and Territories participate and there are no changes to the former Government's policy except those announced publicly on 2 December 2013. The projections for NDIS are based on the current policy.
Source: Treasury projections
Delivering on the Government's election commitments
The Government's election commitments have been fully accounted for in the 2013‑14 MYEFO with the exception of savings from reducing the size of APS. Taken together, with potential savings from streamlining the APS, there would be a positive impact on the budget position.
With regard to key election commitments included as decisions in the MYEFO, legislation to repeal the carbon tax was introduced into Parliament on 13 November 2013. Repealing this tax will reduce cost pressures on households and businesses, and is consistent with the Government's plan for a stronger economy built on lower taxes, less regulation and a stronger private sector.
The total impact of the repeal of the carbon tax and associated measures is a net deterioration in the budget of $7.4 billion over the forward estimates period. This cost reflects, in part, the Government's decision to retain the current personal income tax rates while abolishing the carbon tax, and to maintain the increases in fortnightly pensions and benefit rates that were introduced with the carbon tax.
Legislation to repeal the minerals resource rent tax was also introduced into Parliament on 13 November 2013. The Bill also repeals or revises a number of related measures, the costs of which were intended to be met by revenue from the minerals resource rent tax, including the company tax loss carry‑back arrangements, Schoolkids Bonus, the Regional Infrastructure Fund and the Regional Development Australia Fund, and the superannuation guarantee charge increase. The total value of measures in the Bill is $13.4 billion over the forward estimates.
An important element of repairing the budget position is to boost growth and productivity. Accordingly, the Government is embarking on an ambitious infrastructure investment programme through the Auslink Programme to fast track essential projects and increase funding so that we can start building the transport infrastructure that Australia needs for the 21st century.
This Government will provide an additional $8.2 billion over six years, bringing the total land transport infrastructure investment from 2013‑14 to 2018‑19 to $34.5 billion. Significant projects being funded under the Auslink Programme to meet the Government's election commitments include East‑West Link in Melbourne, WestConnex in Sydney, the Toowoomba Second Range Crossing and Melbourne to Brisbane Inland Rail. These projects will help to alleviate congestion in our cities, link our regions, improve safety across our road network and underpin business productivity.
Commitments where details are yet to be finalised have been provisioned for in the Contingency Reserve and related revenue heads as estimates variations. This is consistent with the treatment of outstanding election commitments in the MYEFO following the 2004 and the 2010 Federal elections. These commitments will be detailed in the 2014‑15 Budget.
The election commitment that has not been incorporated into MYEFO is the $5.2 billion saving from reducing the public sector headcount by 12,000 through natural attrition.
Other policy decisions
The Government will provide $996 million over six years for eight infrastructure projects previously funded from the former Government's Regional Infrastructure Fund. The Government will fund these productivity‑enhancing infrastructure projects without the minerals resource rent tax. These projects include the Great Northern Highway — Muchea to Wubin and the North West Coastal Highway — Minilya to Barradale, which will be co‑funded by the States and Territories.
The Government has begun the process of identifying responsible savings as a down payment towards repairing the budget. A net save of $1.1 billion over the forward estimates will be achieved from not proceeding with various uncommitted discretionary grants or spending commitments announced by the former Government in the 2013 Economic Statement or before the 2013 PEFO, while accepting most of the offsetting saves identified as part of these spending packages.
In addition, the Government has begun a process to streamline government and reduce duplication, starting with the abolition or rationalisation of over 20 non‑statutory bodies where activities are no longer needed or can be managed within existing departmental resources.
Medium term
The deterioration in the financial position of the Commonwealth over the forward estimates since the 2013 PEFO is mirrored in a marked deterioration in the projected underlying cash balance over the medium term, in the absence of remedial action.
Without policy change, average annual real expenditure growth of 3.7 per cent is projected over the period from 2016‑17 to 2023‑24. Even if it is assumed that tax as a share of GDP was allowed to grow through fiscal drag, including income tax bracket creep (see Chart 3.2 below), the budget would remain in deficit in every year through to 2023‑24 (see Chart 3.3 below).
Chart 3.2: Payments and receipts projected to 2023‑24
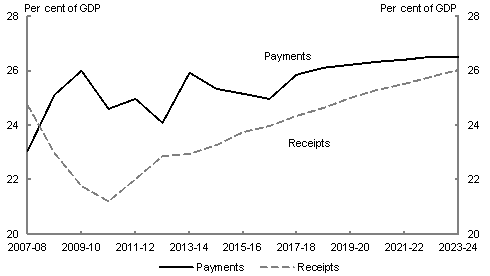
Note: Payments and receipts exclude Future Fund payments and earnings, which are also not included in the underlying cash balance.
Source: Treasury projections.
Chart 3.3: Underlying cash balance projected to 2023‑24
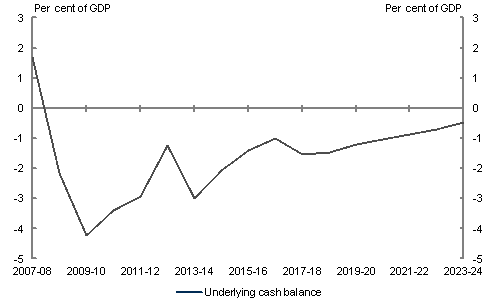
Note: The underlying cash balance excludes Future Fund earnings and payments.
Source: Treasury projections.
If tax cuts were provided in order to return fiscal drag, including income tax bracket creep, and prevent average tax rates increasing, the budget would produce even larger deficits over the medium term to 2023‑24. In addition to growing the economy, this highlights that the heavy lifting to achieve a surplus must come through expenditure restraint as a rising personal income tax burden would also have negative impacts on workforce participation.
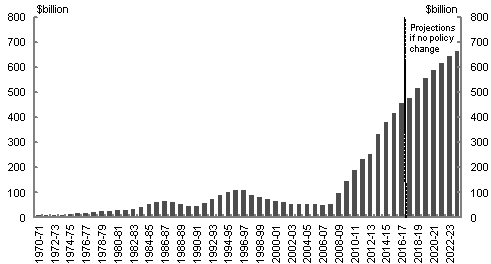
In addition, deficits in each and every year, without remedial action, would contribute to a substantial increase in Commonwealth Government Securities on issue, which would rise to $667 billion by 2023‑24 (around 26 per cent of GDP) (Chart 3.4).
Chart 3.4: Face value of Commonwealth Government Securities on issue projected to 2023‑24
Source: Treasury projections.
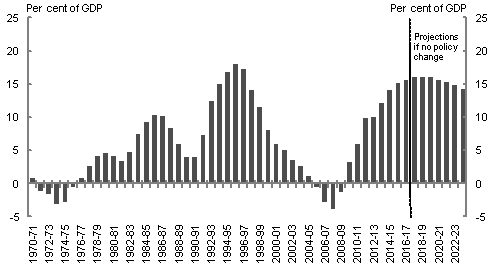
Net debt would continue to rise, peaking at 16.2 per cent of GDP in 2018‑19 (Chart 3.5).
Chart 3.5: Net debt projected to 2023‑24
Source: Treasury projections.
Fiscal Strategy
The Government has inherited a budget in significant need of repair.
Undertaking systemic fiscal repair to return the Budget to surplus and to reduce debt is a key election commitment of the Government.
The Government has a clear plan to deliver on this commitment.
The Government has committed to restoring public sector finances by returning the budget to sustainable surpluses that build to at least 1 per cent of GDP by 2023‑24.
The Government has established the National Commission of Audit to assess the role and scope of Government, as well as ensuring taxpayers' money is spent wisely and in an efficient manner. The Commission will provide its Phase 1 report to Government at the end of January and Phase 2 report at the end of March 2014. The recommendations of the National Commission of Audit will provide the platform for the 2014‑15 Budget for reducing government spending.
At the same time, it is critical that Australia lifts its potential rate of economic growth and productivity in order to deliver sustained growth in living standards over the decades ahead. Quality investments in infrastructure, significant reductions in red tape and a system of government that encourages innovation will support productivity growth and, in turn, stronger economic growth.
Consistent with the requirements of the Charter of Budget Honesty Act 1998, the Government will outline the full detail of its medium‑term fiscal strategy in the 2014‑15 Budget.
Budget aggregates
The underlying cash deficit is expected to be $47.0 billion (3.0 per cent of GDP) in 2013‑14, improving to a deficit of $17.7 billion (1.0 per cent of GDP) in 2016‑17. In accrual terms, the fiscal balance deficit is expected to be $41.8 billion (2.7 per cent of GDP) in 2013‑14, improving to a deficit of $14.5 billion (0.8 per cent of GDP) in 2016‑17.
Net debt is expected to be $191.5 billion (12.1 per cent of GDP) in 2013‑14 and is expected to reach $280.5 billion (15.7 per cent of GDP) in 2016‑17.
The face value of Commonwealth Government Securities on issue is expected to rise over the forward estimates to a within‑year peak of around $460 billion in 2016‑17.
| Estimates | |||||
|---|---|---|---|---|---|
| 2013‑14 | 2014‑15 | ||||
| PEFO | MYEFO | PEFO | MYEFO | ||
| $b | $b | $b | $b | ||
| Receipts | 369.5 | 364.9 | 390.3 | 382.7 | |
| Per cent of GDP | 23.6 | 23.1 | 23.9 | 23.5 | |
| Payments(a) | 396.6 | 409.0 | 411.3 | 413.7 | |
| Per cent of GDP | 25.3 | 25.9 | 25.1 | 25.4 | |
| Net Future Fund earnings | 2.9 | 2.9 | 3.0 | 3.0 | |
| Underlying cash balance(b) | -30.1 | -47.0 | -24.0 | -33.9 | |
| Per cent of GDP | -1.9 | -3.0 | -1.5 | -2.1 | |
| Revenue | 379.9 | 373.9 | 397.7 | 387.9 | |
| Per cent of GDP | 24.2 | 23.7 | 24.3 | 23.8 | |
| Expenses | 401.5 | 412.1 | 416.0 | 417.8 | |
| Per cent of GDP | 25.6 | 26.1 | 25.4 | 25.6 | |
| Net operating balance | -21.5 | -38.1 | -18.2 | -29.9 | |
| Net capital investment | 4.0 | 3.7 | 3.8 | 1.6 | |
| Fiscal balance | -25.5 | -41.8 | -22.1 | -31.5 | |
| Per cent of GDP | -1.6 | -2.7 | -1.3 | -1.9 | |
| Memorandum item: | |||||
| Headline cash balance | -37.2 | -51.6 | -33.6 | -42.4 | |
| Projections | |||||
| 2015‑16 | 2016‑17 | ||||
| PEFO | MYEFO | PEFO | MYEFO | ||
| $b | $b | $b | $b | ||
| Receipts | 423.4 | 409.1 | 450.8 | 432.8 | |
| Per cent of GDP | 24.6 | 24.0 | 24.8 | 24.2 | |
| Payments(a) | 424.9 | 430.0 | 443.2 | 447.1 | |
| Per cent of GDP | 24.6 | 25.2 | 24.4 | 25.0 | |
| Net Future Fund earnings | 3.2 | 3.1 | 3.4 | 3.4 | |
| Underlying cash balance(b) | -4.7 | -24.1 | 4.2 | -17.7 | |
| Per cent of GDP | -0.3 | -1.4 | 0.2 | -1.0 | |
| Revenue | 433.3 | 417.4 | 464.6 | 445.0 | |
| Per cent of GDP | 25.1 | 24.4 | 25.6 | 24.9 | |
| Expenses | 430.9 | 436.0 | 454.5 | 457.1 | |
| Per cent of GDP | 25.0 | 25.5 | 25.0 | 25.6 | |
| Net operating balance | 2.4 | -18.6 | 10.1 | -12.1 | |
| Net capital investment | 0.5 | 0.2 | 2.3 | 2.4 | |
| Fiscal balance | 1.8 | -18.8 | 7.8 | -14.5 | |
| Per cent of GDP | 0.1 | -1.1 | 0.4 | -0.8 | |
| Memorandum item: | |||||
| Headline cash balance | -14.0 | -31.7 | -5.9 | -25.8 | |
(a) Equivalent to cash payments for operating activities, purchase of non‑financial assets and net acquisition of assets under finance leases.
(b) Excludes expected net Future Fund earnings.
Underlying cash balance estimates
The 2013‑14 underlying cash deficit is expected to be $28.9 billion larger than expected in the 2013‑14 Budget, and $16.8 billion larger than expected in the 2013 PEFO.
| Estimates | |||||
|---|---|---|---|---|---|
| 2013‑14 | 2014‑15 | ||||
| PEFO | MYEFO | PEFO | MYEFO | ||
| $b | $b | $b | $b | ||
| Cash receipts | |||||
| Operating cash receipts | 369.0 | 364.5 | 388.1 | 380.5 | |
| Capital cash receipts(b) | 0.4 | 0.4 | 2.2 | 2.3 | |
| Total cash receipts | 369.5 | 364.9 | 390.3 | 382.7 | |
| Cash payments | |||||
| Operating cash payments | 386.8 | 398.7 | 401.4 | 403.5 | |
| Capital cash payments(c) | 9.4 | 9.9 | 10.0 | 10.2 | |
| Total cash payments | 396.2 | 408.6 | 411.3 | 413.7 | |
| Finance leases and similar arrangements(d) | 0.5 | 0.5 | 0.0 | 0.0 | |
| GFS cash surplus(+)/deficit(-) | -27.2 | -44.1 | -21.0 | -31.0 | |
| Per cent of GDP | -1.7 | -2.8 | -1.3 | -1.9 | |
| less Net Future Fund earnings | 2.9 | 2.9 | 3.0 | 3.0 | |
| Underlying cash balance(e) | -30.1 | -47.0 | -24.0 | -33.9 | |
| Per cent of GDP | -1.9 | -3.0 | -1.5 | -2.1 | |
| Memorandum items: | |||||
| Net cash flows from investments in financial assets for policy purposes | -10.0 | -7.5 | -12.6 | -11.5 | |
| plus Net Future Fund earnings | 2.9 | 2.9 | 3.0 | 3.0 | |
| Headline cash balance | -37.2 | -51.6 | -33.6 | -42.4 | |
| Projections | |||||
| 2015‑16 | 2016‑17 | ||||
| PEFO | MYEFO | PEFO | MYEFO | ||
| $b | $b | $b | $b | ||
| Cash receipts | |||||
| Operating cash receipts | 420.8 | 406.4 | 450.6 | 432.6 | |
| Capital cash receipts(b) | 2.6 | 2.7 | 0.2 | 0.2 | |
| Total cash receipts | 423.4 | 409.1 | 450.8 | 432.8 | |
| Cash payments | |||||
| Operating cash payments | 415.7 | 420.8 | 434.5 | 437.9 | |
| Capital cash payments(c) | 9.2 | 9.3 | 8.8 | 9.2 | |
| Total cash payments | 424.9 | 430.0 | 443.2 | 447.1 | |
| Finance leases and similar arrangements(d) | 0.0 | 0.0 | 0.0 | 0.0 | |
| GFS cash surplus(+)/deficit(-) | -1.5 | -20.9 | 7.6 | -14.3 | |
| Per cent of GDP | -0.1 | -1.2 | 0.4 | -0.8 | |
| less Net Future Fund earnings | 3.2 | 3.1 | 3.4 | 3.4 | |
| Underlying cash balance(e) | -4.7 | -24.1 | 4.2 | -17.7 | |
| Per cent of GDP | -0.3 | -1.4 | 0.2 | -1.0 | |
| Memorandum items: | |||||
| Net cash flows from investments in financial assets for policy purposes | -12.5 | -10.7 | -13.5 | -11.5 | |
| plus Net Future Fund earnings | 3.2 | 3.1 | 3.4 | 3.4 | |
| Headline cash balance | -14.0 | -31.7 | -5.9 | -25.8 | |
(a) The numbers for PEFO were not published in the 2013 PEFO.
(b) Equivalent to cash receipts from the sale of non‑financial assets in the cash flow statement.
(c) Equivalent to cash payments for purchases of non‑financial assets in the cash flow statement.
(d) The acquisition of assets under finance leases decreases the underlying cash balance. The disposal of assets previously held under finance leases increases the underlying cash balance.
(e) Excludes expected net Future Fund earnings.
Table 3.4 provides a reconciliation of the changes in the underlying cash balance since the 2013‑14 Budget.
| Estimates | Projections | ||||||
|---|---|---|---|---|---|---|---|
| 2013‑14 | 2014‑15 | 2015‑16 | 2016‑17 | ||||
| $m | $m | $m | $m | ||||
| 2013‑14 Budget underlying cash balance(a) | -18,043 | -10,888 | 849 | 6,591 | |||
| Per cent of GDP | -1.1 | -0.6 | 0.0 | 0.4 | |||
| Changes from 2013‑14 Budget to 2013 PEFO | |||||||
| Effect of policy decisions(b) | -374 | -1,663 | 3,315 | 6,915 | |||
| Effect of parameter and other variations | -11,725 | -11,429 | -8,826 | -9,307 | |||
| Total variations | -12,099 | -13,093 | -5,511 | -2,392 | |||
| 2013 PEFO underlying cash balances(a) | -30,142 | -23,981 | -4,662 | 4,199 | |||
| Per cent of GDP | -1.9 | -1.5 | -0.3 | 0.2 | |||
| Changes from 2013 PEFO to 2013‑14 MYEFO | |||||||
| Effect of policy decisions(b)(c) | |||||||
| Receipts | 1,674 | -882 | -2,976 | -5,455 | |||
| Payments | 11,940 | -227 | -1,472 | -4,180 | |||
| Total policy decisions impact on underlying cash balance | -10,266 | -655 | -1,505 | -1,274 | |||
| Effect of parameter and other variations(c) | |||||||
| Receipts | -6,196 | -6,680 | -11,359 | -12,531 | |||
| Payments | 462 | 2,600 | 6,609 | 8,082 | |||
| less Net Future Fund earnings(d) | -75 | -9 | -51 | -20 | |||
| Total parameter and other variations impact on underlying cash balance | -6,582 | -9,272 | -17,916 | -20,592 | |||
| 2013‑14 MYEFO underlying cash balance(a) | -46,989 | -33,907 | -24,083 | -17,668 | |||
| Per cent of GDP | -3.0 | -2.1 | -1.4 | -1.0 | |||
(a) Excludes expected net Future Fund earnings.
(b) Excludes secondary impacts on public debt interest of policy decisions and offsets from the Contingency Reserve for decisions taken.
(c) A positive number for receipts indicates an increase in the underlying cash balance, while a positive number for payments indicates a decrease in the underlying cash balance.
(d) The movement in net Future Fund earnings is now shown separately.
Since the 2013 PEFO, total policy decisions have had a negative impact on the underlying cash position of $10.3 billion in 2013‑14 and by $13.7 billion over the forward estimates.
Since the 2013 PEFO, total parameter and other variations have had a negative impact on the underlying cash position of $6.6 billion in 2013‑14 and by $54.4 billion over the forward estimates.
The change in the projections assumption for the unemployment rate increases the number of unemployment benefit recipients in the projection period, and contributes $3.7 billion to the deterioration in the budget bottom line since the 2013 PEFO over the forward estimates.
In addition, changes to the terms of trade methodology reduce nominal GDP growth over the projection period, and contribute to the deterioration in the budget bottom line by reducing tax receipts by around $2.0 billion over the forward estimates since the 2013 PEFO.
Further details of the impact of policy decisions and major variations arising from parameter and other variations on the fiscal outlook are provided in the receipt estimates and payment estimates sections below.
Receipt estimates
Total receipts are expected to be $4.5 billion lower in 2013‑14 than estimated at the 2013 PEFO, tax receipts are $4.6 billion lower and non‑tax receipts are $109 million higher. Since the 2013 PEFO, total receipts have been revised down by $7.6 billion over the forward estimates due to new policy decisions, and revised down by $36.8 billion over the forward estimates due to parameter and other variations.
| Estimates | Change on PEFO | ||||||
|---|---|---|---|---|---|---|---|
| PEFO | MYEFO | ||||||
| $m | $m | $m | % | ||||
| Individuals and other withholding taxes | |||||||
| Gross income tax withholding | 160,600 | 157,200 | -3,400 | -2.1 | |||
| Gross other individuals | 33,700 | 34,000 | 300 | 0.9 | |||
| less: Refunds | 27,500 | 27,200 | -300 | -1.1 | |||
| Total individuals and other withholding tax | 166,800 | 164,000 | -2,800 | -1.7 | |||
| Fringe benefits tax | 4,160 | 4,090 | -70 | -1.7 | |||
| Company tax | 69,200 | 69,000 | -200 | -0.3 | |||
| Superannuation fund taxes | 7,620 | 6,860 | -760 | -10.0 | |||
| Minerals resource rent tax(a) | 850 | 500 | -350 | -41.2 | |||
| Petroleum resource rent tax | 2,410 | 1,750 | -660 | -27.4 | |||
| Income taxation receipts | 251,040 | 246,200 | -4,840 | -1.9 | |||
| Goods and services tax | 50,633 | 50,248 | -385 | -0.8 | |||
| Wine equalisation tax | 760 | 740 | -20 | -2.6 | |||
| Luxury car tax | 380 | 400 | 20 | 5.3 | |||
| Excise and customs duty | |||||||
| Petrol | 5,850 | 5,850 | 0 | 0.0 | |||
| Diesel | 8,980 | 8,990 | 10 | 0.1 | |||
| Other fuel products | 3,800 | 3,820 | 20 | 0.5 | |||
| Tobacco | 8,320 | 8,350 | 30 | 0.4 | |||
| Beer | 2,390 | 2,360 | -30 | -1.3 | |||
| Spirits | 2,030 | 1,990 | -40 | -2.0 | |||
| Other alcoholic beverages(b) | 1,010 | 970 | -40 | -4.0 | |||
| Other customs duty | |||||||
| Textiles, clothing and footwear | 730 | 750 | 20 | 2.7 | |||
| Passenger motor vehicles | 930 | 930 | 0 | 0.0 | |||
| Other imports | 1,610 | 1,570 | -40 | -2.5 | |||
| less: Refunds and drawbacks | 260 | 260 | 0 | 0.0 | |||
| Total excise and customs duty | 35,390 | 35,320 | -70 | -0.2 | |||
| Carbon pricing mechanism | 6,475 | 7,180 | 705 | 10.9 | |||
| Agricultural levies | 461 | 459 | -2 | -0.4 | |||
| Other taxes | 2,971 | 2,933 | -38 | -1.3 | |||
| Indirect taxation receipts | 97,070 | 97,280 | 210 | 0.2 | |||
| Taxation receipts | 348,110 | 343,480 | -4,630 | -1.3 | |||
| Sales of goods and services | 8,686 | 8,626 | -60 | -0.7 | |||
| Interest received | 3,744 | 3,591 | -153 | -4.1 | |||
| Dividends | 2,748 | 2,883 | 135 | 4.9 | |||
| Other non-taxation receipts | 6,164 | 6,350 | 186 | 3.0 | |||
| Non-taxation receipts | 21,342 | 21,451 | 109 | 0.5 | |||
| Total receipts | 369,452 | 364,930 | -4,521 | -1.2 | |||
| Memorandum: | |||||||
| Total excise | 26,520 | 26,400 | -120 | -0.5 | |||
| Total customs duty | 8,870 | 8,920 | 50 | 0.6 | |||
| Capital gains tax(c) | 7,900 | 7,900 | 0 | 0.0 | |||
| Medicare and DisabilityCare Australia levy(d) | 9,960 | 9,950 | -10 | -0.1 | |||
(a) Net receipts from the minerals resource rent tax are expected to be $0.3 billion in 2013‑14 which represents the net receipts impact across different revenue heads. These include the offsetting reductions in company tax (through deductibility) and interactions with other taxes. The Government has announced the minerals resource rent tax will not apply beyond 30 June 2014.
(b) Other alcoholic beverages are those not exceeding 10 per cent by volume of alcohol (excluding beer, brandy and wine).
(c) Capital gains tax is part of gross other individuals, company tax and superannuation fund taxes.
(d) The Medicare and DisabilityCare Australia levy liabilities are reported in the year in which the income tax liability is assessed.
| Estimates | Change on PEFO | ||||||
|---|---|---|---|---|---|---|---|
| PEFO | MYEFO | ||||||
| $m | $m | $m | % | ||||
| Individuals and other withholding taxes | |||||||
| Gross income tax withholding | 174,000 | 168,800 | -5,200 | -3.0 | |||
| Gross other individuals | 37,000 | 36,600 | -400 | -1.1 | |||
| less: Refunds | 28,300 | 28,000 | -300 | -1.1 | |||
| Total individuals and other withholding tax | 182,700 | 177,400 | -5,300 | -2.9 | |||
| Fringe benefits tax | 4,580 | 4,470 | -110 | -2.4 | |||
| Company tax | 70,100 | 70,500 | 400 | 0.6 | |||
| Superannuation fund taxes | 9,090 | 8,760 | -330 | -3.6 | |||
| Minerals resource rent tax(a) | 1,100 | 300 | -800 | -72.7 | |||
| Petroleum resource rent tax | 2,470 | 2,100 | -370 | -15.0 | |||
| Income taxation receipts | 270,040 | 263,530 | -6,510 | -2.4 | |||
| Goods and services tax | 53,559 | 52,948 | -611 | -1.1 | |||
| Wine equalisation tax | 810 | 780 | -30 | -3.7 | |||
| Luxury car tax | 350 | 380 | 30 | 8.6 | |||
| Excise and customs duty | |||||||
| Petrol | 5,750 | 5,650 | -100 | -1.7 | |||
| Diesel | 9,180 | 9,180 | 0 | 0.0 | |||
| Other fuel products | 3,620 | 3,580 | -40 | -1.1 | |||
| Tobacco | 9,110 | 9,110 | 0 | 0.0 | |||
| Beer | 2,420 | 2,360 | -60 | -2.5 | |||
| Spirits | 2,160 | 2,090 | -70 | -3.2 | |||
| Other alcoholic beverages(b) | 1,060 | 990 | -70 | -6.6 | |||
| Other customs duty | |||||||
| Textiles, clothing and footwear | 580 | 600 | 20 | 3.4 | |||
| Passenger motor vehicles | 990 | 920 | -70 | -7.1 | |||
| Other imports | 1,680 | 1,600 | -80 | -4.8 | |||
| less: Refunds and drawbacks | 260 | 260 | 0 | 0.0 | |||
| Total excise and customs duty | 36,290 | 35,820 | -470 | -1.3 | |||
| Carbon pricing mechanism | 2,870 | 1,695 | -1,175 | -40.9 | |||
| Agricultural levies | 451 | 470 | 18 | 4.1 | |||
| Other taxes | 3,135 | 2,980 | -155 | -4.9 | |||
| Indirect taxation receipts | 97,466 | 95,073 | -2,393 | -2.5 | |||
| Taxation receipts | 367,506 | 358,603 | -8,903 | -2.4 | |||
| Sales of goods and services | 8,519 | 8,442 | -77 | -0.9 | |||
| Interest received | 3,646 | 3,544 | -102 | -2.8 | |||
| Dividends | 2,463 | 3,891 | 1,428 | 57.9 | |||
| Other non-taxation receipts | 8,170 | 8,263 | 93 | 1.1 | |||
| Non-taxation receipts | 22,799 | 24,140 | 1,341 | 5.9 | |||
| Total receipts | 390,305 | 382,743 | -7,562 | -1.9 | |||
| Memorandum: | |||||||
| Total excise | 27,040 | 26,640 | -400 | -1.5 | |||
| Total customs duty | 9,250 | 9,180 | -70 | -0.8 | |||
| Capital gains tax(c) | 10,700 | 10,700 | 0 | 0.0 | |||
| Medicare and DisabilityCare Australia levy(d) | 10,470 | 10,380 | -90 | -0.9 | |||
(a) Net receipts from the minerals resource rent tax are expected to be $0.2 billion in 2014‑15 which represents the net receipts impact across different revenue heads. These include the offsetting reductions in company tax (through deductibility) and interactions with other taxes. The Government has announced the minerals resource rent tax will not apply beyond 30 June 2014.
(b) Other alcoholic beverages are those not exceeding 10 per cent by volume of alcohol (excluding beer, brandy and wine).
(c) Capital gains tax is part of gross other individuals, company tax and superannuation fund taxes.
(d) The Medicare and DisabilityCare Australia levy liabilities are reported in the year in which the income tax liability is assessed.
Policy decisions
Policy decisions since the 2013 PEFO have increased total receipts by $1.7 billion in 2013‑14 and reduced total receipts by $7.6 billion over the forward estimates period.
The carbon tax and related measures will be repealed from 1 July 2014. This will reduce receipts by $6.3 billion over the forward estimates period. This includes abolishing the carbon tax as well as the equivalent carbon price applied to synthetic greenhouse gases, aviation fuels and liquid and gaseous fuels.
The minerals resource rent tax and most related measures will also be repealed by 1 July 2014. The repeal of the minerals resource rent tax reduces receipts by $3.4 billion over the forward estimates period relative to the 2013 PEFO. This is a net estimate, after allowing for the interaction between the minerals resource rent tax and other taxes, such as company tax. However, the removal and rephasing of related tax concessions that the minerals resource rent tax was intended to fund will increase receipts by $5.7 billion over the forward estimates resulting in a net increase to receipts over the forward estimates of $2.3 billion.
The Government is dealing with 92 announced but unlegislated tax and superannuation measures. The Government will proceed with 34 measures, not proceed with 55 measures and three measures will proceed with amendment. Measures that will not proceed include changes to the treatment of car fringe benefits, the removal of the provision allowing the imposition of a tax on certain superannuation earnings supporting retirement income streams and the introduction of a cap on work‑related self‑education expenses. Decisions not to proceed with many measures reflect the Government's assessment that these measures are either unworkable or would be economically damaging. Collectively, these decisions will reduce receipts by $3.6 billion relative to the 2013 PEFO.
Parameter and other variations
Parameter and other variations have decreased total receipts since the 2013 PEFO by $6.2 billion in 2013‑14 and $36.8 billion over the forward estimates period.
Included in parameter and other variations are provisions for those election commitments that have not been finalised. These provisions relate to the introduction of a 1.5 per cent company levy to fund the new Paid Parental Leave Scheme, the increased income and superannuation taxes flowing from the introduction of the scheme and a reduction in the company tax rate to 28.5 per cent.
In addition, a provision has also been made for the impact on tax receipts of a free trade agreement with Korea and for unfunded superannuation liabilities relating to New South Wales universities.
The key economic parameters that influence tax receipts and tax revenue are shown in Table 3.7. The table shows effects on the Australian Government's main tax bases of the changed circumstances and outlook since the 2013 PEFO.
| Outcome | Estimates | Projections | |||||
|---|---|---|---|---|---|---|---|
| 2012‑13 | 2013‑14 | 2014‑15 | 2015‑16 | 2016‑17 | |||
| % | % | % | % | % | |||
| Revenue parameters at 2013‑14 MYEFO | |||||||
| Nominal gross domestic product (non-farm) | 2.5 | 3 1/2 | 3 1/2 | 4 3/4 | 4 3/4 | ||
| Change since 2013 PEFO | 0.0 | - 1/4 | -1 | - 1/2 | - 1/2 | ||
| Compensation of employees (non-farm)(b) | 3.6 | 3 | 4 | 5 3/4 | 5 1/2 | ||
| Change since 2013 PEFO | -0.2 | -1 1/2 | - 3/4 | 1/4 | 0 | ||
| Corporate gross operating surplus(c) | -2.9 | 4 | 2 3/4 | 2 1/4 | 2 1/2 | ||
| Change since 2013 PEFO | 1.1 | 1 1/4 | -1 1/2 | -2 3/4 | -2 3/4 | ||
| Unincorporated business income | 1.4 | 1 1/4 | 3/4 | 4 3/4 | 4 3/4 | ||
| Change since 2013 PEFO | -0.3 | 2 | -1 1/2 | - 1/2 | - 1/2 | ||
| Property income(d) | 3.5 | 10 3/4 | 6 1/2 | 5 | 5 | ||
| Change since 2013 PEFO | -1.4 | 8 3/4 | 1/4 | - 1/2 | - 1/2 | ||
| Consumption subject to GST | 3.4 | 3 1/4 | 4 1/4 | 5 1/2 | 5 1/2 | ||
| Change since 2013 PEFO | -0.2 | - 3/4 | - 1/2 | 0 | 0 | ||
(a) Current prices, per cent change on previous year. Changes since the 2013 PEFO are percentage points and may not reconcile due to rounding.
(b) Compensation of employees measures total remuneration earned by employees.
(c) Corporate gross operating surplus is an Australian National Accounts measure of company profits, gross of depreciation.
(d) Property income measures income derived from rent, dividends and interest.
Parameter and other variations have decreased tax receipts since the 2013 PEFO by $6.3 billion in 2013‑14 and $37.8 billion over the forward estimates period.
Tax receipts have been affected by the weaker economic outlook. In particular, the downward revisions to forecasts of wages growth and corporate profitability — and hence nominal GDP — have resulted in significant downward revisions to tax receipts collected from wages and profits.
Consequently, taxes from individuals have been revised down $2.7 billion in 2013‑14 and $20.4 billion across the four years to 2016‑17. Company tax has been revised down by $180 million in 2013‑14 and $7.1 billion across the four years to 2016‑17.
Parameter and other variations have increased non‑tax receipts since 2013 PEFO by $38 million in 2013‑14, primarily reflecting minor movements in forecast dividend and interest receipts.
Analysis of the sensitivity of the receipts estimates to changes in the economic outlook is provided in Attachment A to this part.
Payment estimates
Since the 2013 PEFO, estimated cash payments for 2013‑14 have increased by $12.4 billion, reflecting increased payments due to new policy decisions of $11.9 billion, and increased payments due to parameter and other variations of $462 million.
Policy decisions
Major policy decisions since the 2013 PEFO that have increased cash payments in 2013‑14 and over the four years to 2016‑17 include:
- a grant payment of $8.8 billion to the Reserve Bank of Australia (RBA) to increase the RBA's capital reserve and strengthen the RBA's financial position;
- a range of measures associated with the repeal of the carbon tax, including an expected increase in payments for the buy‑back of free permits in 2013‑14 as well as abolishing the equivalent carbon tax applied to liquid and gaseous fuels through reductions in entitlements to fuel tax credits. These measures are expected to increase cash payments by $2.1 billion in 2013‑14 ($2.8 billion over four years);
- a number of land transport infrastructure projects, including the Bruce, Princes and Pacific Highway projects and the NSW F3 to M2 extension as part of the Auslink Programme for national land transport. These measures are expected to increase cash payments by $1.1 billion in 2013‑14 ($5.6 billion over four years);
- the implementation of the Government's border protection policies, which is expected to increase cash payments by $904 million in 2013‑14 ($2.1 billion over four years). When combined with the related $858 million reduction in the costs of the onshore detention network, this results in a $1.2 billion cost directly attributable to insufficient funding provided previously for offshore processing facilities in Papua New Guinea and Nauru; and
- additional funding for the Students First package of measures, including implementing a fairer funding agreement for schools with the Queensland, Western Australian and Northern Territory governments ($1.2 billion over four years) and committing a further $94 million to other Students First initiatives, including $70 million for the establishment of the Independent Public Schools Fund.
The impact of these policy decisions has been partially offset in 2013‑14, and largely offset over the four years to 2016‑17, by a number of decisions that have reduced cash payments, including:
- a range of measures associated with the repeal of the minerals resource rent tax, including abolishing the Schoolkids Bonus from 1 January 2014, discontinuing the Regional Infrastructure Fund and the Regional Development Australia Fund, and abolishing the Mining Tax Supplementary Allowance. These measures are expected to reduce cash payments by $1.0 billion in 2013‑14 ($8.4 billion over four years);
- redirecting funding over six years under the Building Stronger Communities Fund ($528 million) and Trade Training Centres ($987 million) and other smaller portfolio savings, to broadly offset the cost of Students First — A fairer funding agreement for schools. The savings decisions for the Building Stronger Communities Fund and Trade Training Centres are expected to decrease cash payments by $104 million in 2013‑14 ($841 million over four years); and
- the amalgamation and rephasing of expenditure under the Restoring the Balance in the Murray‑Darling Basin programme and the Sustainable Rural Water Use and Infrastructure Program over a six year period. These measures are expected to reduce cash payments by $54.2 million in 2013‑14 ($650 million over four years).
Box 3.1: Grant to strengthen the RBA's financial position
On 23 October 2013, the Government announced a grant of $8.8 billion to the Reserve Bank of Australia (RBA) to strengthen its financial position.
The strong and sustained appreciation of the Australian dollar from 2009 caused the RBA to record large financial losses in 2009‑10 and 2010‑11 as the value of its foreign currency assets declined in Australian dollar terms. This coincided with global interest rates declining to historical lows, reducing the RBA's underlying earnings.
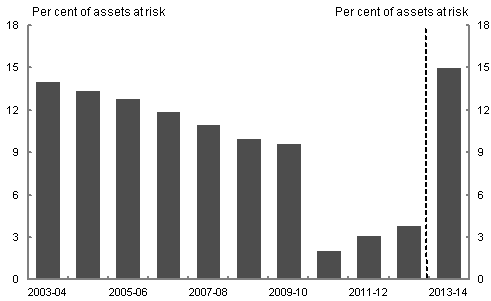
The resultant losses were absorbed by the Reserve Bank Reserve Fund (RBRF), reducing the balance to significantly below the level now considered prudent by the Reserve Bank Board based on its most recent assessment of the risks to the RBA's balance sheet (Chart A).
The low level of the RBRF has not posed an immediate risk to the solvency of the RBA and has not impaired its operations. Nevertheless, on current projections, it would take many years to build the RBRF to the level deemed prudent by the Board — 15 per cent of assets at risk — through the usual channel of retaining profits, leaving the RBA financially exposed in an uncertain global environment.
The Government has therefore decided, following consultation with the Reserve Bank Governor, to provide a one‑off $8.8 billion grant to the RBA to strengthen its financial position. The grant safeguards the credibility and independence of the RBA, putting beyond doubt its ability to perform its key functions at the heart of Australia's financial system and to meet any challenges that may lie ahead in a volatile global economy.
Chart A: Reserve Bank Reserve Fund
Source: Reserve Bank of Australia.
Parameter and other variations
Major increases in cash payments in 2013‑14 and over the four years to 2016‑17 as a result of parameter and other variations since the 2013 PEFO include:
- payments related to Family Tax Benefit, which are expected to increase by $368 million in 2013‑14 ($1.0 billion over four years), largely reflecting a higher than expected increase in recipient numbers and higher average rates of payment;
- Child Care Benefit and Child Care Rebate payments, which are expected to increase by $303 million in 2013‑14 ($2.6 billion over four years), largely reflecting higher than expected utilisation of child care;
- Private Health Insurance rebate payments, which are expected to increase by $237 million in 2013‑14 ($873 million over four years), largely reflecting stronger than expected growth in the number of people with subsidised private health cover;
- payments under the Natural Disaster Relief and Recovery Arrangements, which are expected to be $198 million higher in 2013‑14, primarily relating to the earlier than expected completion of some projects. This has contributed to lower payments over the three years to 2016‑17 by $214 million, which also reflects a reduction in the estimated total cost of reconstruction following natural disasters in Queensland;
- refunds of unclaimed moneys from banking institutions, which are expected to be $176 million higher in 2013‑14, reflecting higher than expected claims being made in 2013‑14;
- Medicare Benefits Schedule payments, which are expected to be $164 million higher in 2013‑14 ($659 million over four years), primarily reflecting a higher than expected demand for specialist, primary care, pathology and diagnostic imaging services;
- Disability Support Pension payments, which are expected to be $145 million higher in 2013‑14 ($587 million over four years), reflecting higher customer numbers and average payment rates than expected;
- Research and Development Tax Incentive payments, which are expected to be $128 million higher in 2013‑14 ($519 million over four years), reflecting stronger than expected growth in claims in the second year of operation of the 45 per cent refundable tax offset for companies with a turnover of less than $20 million. It is expected that the higher level of claims will continue across the forward estimates;
- Age Pension payments, which are expected to increase by $75 million in 2013‑14 ($721 million over four years), primarily reflecting the recently announced changes to the deeming rates on pensions; and
- Residential Care Subsidies, which are expected to increase by $479 million over four years (although there is a reduction in payments of $26 million in 2013‑14), reflecting increases in the average level of frailty of residents and a higher than expected number of aged care places.
Major reductions in expected cash payments in 2013‑14 and over the four years to 2016‑17 as a result of parameter and other variations since the 2013 PEFO, include:
- payments under the Pharmaceutical Benefits Scheme, which are expected to be $526 million lower in 2013‑14 ($2.7 billion over four years), largely reflecting higher than estimated savings resulting from existing pricing policy, lower than anticipated ongoing growth in demand for certain macular degeneration medicines and adjustments to reflect the 2013‑14 actual outcomes;
- payments for the immigration detention network, which are expected to be $358 million lower in 2013‑14 ($2.1 billion over four years). This largely reflects a reduction in the forecast number of illegal maritime arrivals; and
- Australian Government general recurrent grants funding for schools, which is expected to be $125 million lower in 2013‑14, reflecting lower than previously forecast cost increases in actual recurrent expenditure by government schools.
Consistent with previous budgets, the underlying cash balance has been improved by the regular draw down of the conservative bias allowance. Details of this draw down are provided at Attachment D.
Analysis of the sensitivity of the payments estimates to changes in the economic outlook is provided in Attachment A to this part.
A provision for election commitments where implementation details are still being finalised and which will be progressed in the 2014‑15 Budget has also been included as an estimates variation in the Contingency Reserve. This provision results in a net increase in payments over the forward estimates.
Fiscal balance estimates
Compared with the 2013 PEFO, the fiscal balance is expected to be $16.3 billion lower for 2013‑14, and $68.6 billion lower over the forward estimates period.
Table 3.8 provides a reconciliation of fiscal balance estimates, including the impact of policy decisions and parameter and other variations on revenue, expense and net capital investment.
| Estimates | Projections | ||||||
|---|---|---|---|---|---|---|---|
| 2013‑14 | 2014‑15 | 2015‑16 | 2016‑17 | ||||
| $m | $m | $m | $m | ||||
| 2013‑14 Budget fiscal balance | -13,497 | -6,255 | 5,955 | 10,819 | |||
| Per cent of GDP | -0.8 | -0.4 | 0.3 | 0.6 | |||
| Changes from 2013‑14 Budget to 2013 PEFO | |||||||
| Effect of policy decisions(a) | -749 | -3,835 | 4,712 | 6,515 | |||
| Effect of parameter and other variations | -11,262 | -11,988 | -8,820 | -9,543 | |||
| Total variations | -12,011 | -15,823 | -4,109 | -3,028 | |||
| 2013 PEFO fiscal balance | -25,508 | -22,078 | 1,847 | 7,792 | |||
| Per cent of GDP | -1.6 | -1.3 | 0.1 | 0.4 | |||
| Changes from 2013 PEFO to 2013‑14 MYEFO | |||||||
| Effect of policy decisions(a)(b) | |||||||
| Revenue | -70 | -1,918 | -4,554 | -7,814 | |||
| Expenses | 7,710 | -1,996 | -3,014 | -6,467 | |||
| Net capital investment | 283 | 285 | -90 | -161 | |||
| Total policy decisions impact on fiscal balance | -8,063 | -207 | -1,450 | -1,185 | |||
| Effect of parameter and other variations(b) | |||||||
| Revenue | -5,955 | -7,940 | -11,289 | -11,804 | |||
| Expenses | 2,864 | 3,769 | 8,121 | 9,042 | |||
| Net capital investment | -547 | -2,490 | -237 | 217 | |||
| Total parameter and other variations impact on fiscal balance | -8,272 | -9,218 | -19,173 | -21,062 | |||
| 2013‑14 MYEFO fiscal balance | -41,843 | -31,504 | -18,776 | -14,456 | |||
| Per cent of GDP | -2.7 | -1.9 | -1.1 | -0.8 | |||
(a) Excludes secondary impacts on public debt interest of policy decisions and offsets from the Contingency Reserve for decisions taken.
(b) A positive number for revenue indicates an increase in the fiscal balance, while a positive number for expenses and net capital investment indicates a decrease in the fiscal balance.
Revenue estimates
Total revenue has been revised down by $6.0 billion in 2013‑14 since the 2013 PEFO.
While changes in tax revenue are generally driven by the same factors as tax receipts, there are differences as not all revenue raised in a given year is actually paid in that year. These differences exist for most revenue heads, and vary across years.
Movements in non‑taxation revenue that are not matched by an equal movement in non‑taxation receipts include dividends from the Reserve Bank of Australia, which have a significantly different impact on accrual revenue compared to cash receipts. The dividend revenue is recognised when the entitlement to the dividend is established, not when the dividend receipt is received.
Detailed Australian Government general government sector revenue estimates for 2013‑14 and 2014‑15, compared with estimates from the 2013 PEFO, are provided in Tables 3.9 and 3.10 respectively.
| Estimates | Change on PEFO | ||||||
|---|---|---|---|---|---|---|---|
| PEFO | MYEFO | ||||||
| $m | $m | $m | % | ||||
| Individuals and other withholding taxes | |||||||
| Gross income tax withholding | 161,980 | 158,510 | -3,470 | -2.1 | |||
| Gross other individuals | 36,950 | 36,650 | -300 | -0.8 | |||
| less: Refunds | 27,500 | 27,200 | -300 | -1.1 | |||
| Total individuals and other withholding tax | 171,430 | 167,960 | -3,470 | -2.0 | |||
| Fringe benefits tax | 4,210 | 4,140 | -70 | -1.7 | |||
| Company tax | 71,319 | 70,400 | -919 | -1.3 | |||
| Superannuation fund taxes | 7,750 | 6,990 | -760 | -9.8 | |||
| Minerals resource rent tax(b) | 850 | 500 | -350 | -41.2 | |||
| Petroleum resource rent tax | 2,790 | 1,900 | -890 | -31.9 | |||
| Income taxation revenue | 258,349 | 251,890 | -6,459 | -2.5 | |||
| Goods and services tax | 52,930 | 52,680 | -250 | -0.5 | |||
| Wine equalisation tax | 770 | 750 | -20 | -2.6 | |||
| Luxury car tax | 380 | 400 | 20 | 5.3 | |||
| Excise and customs duty | |||||||
| Petrol | 5,740 | 5,740 | 0 | 0.0 | |||
| Diesel | 8,810 | 8,820 | 10 | 0.1 | |||
| Other fuel products | 3,730 | 3,730 | 0 | 0.0 | |||
| Tobacco | 8,230 | 8,260 | 30 | 0.4 | |||
| Beer | 2,330 | 2,320 | -10 | -0.4 | |||
| Spirits | 2,030 | 1,990 | -40 | -2.0 | |||
| Other alcoholic beverages(c) | 1,010 | 970 | -40 | -4.0 | |||
| Other customs duty | |||||||
| Textiles, clothing and footwear | 730 | 750 | 20 | 2.7 | |||
| Passenger motor vehicles | 930 | 930 | 0 | 0.0 | |||
| Other imports | 1,620 | 1,580 | -40 | -2.5 | |||
| less: Refunds and drawbacks | 260 | 260 | 0 | 0.0 | |||
| Total excise and customs duty | 34,900 | 34,830 | -70 | -0.2 | |||
| Carbon pricing mechanism | 7,980 | 7,340 | -640 | -8.0 | |||
| Agricultural levies | 461 | 459 | -2 | -0.4 | |||
| Other taxes | 3,159 | 3,086 | -73 | -2.3 | |||
| Indirect taxation revenue | 100,580 | 99,545 | -1,035 | -1.0 | |||
| Taxation revenue | 358,928 | 351,434 | -7,494 | -2.1 | |||
| Sales of goods and services | 8,638 | 8,680 | 42 | 0.5 | |||
| Interest | 3,965 | 3,730 | -234 | -5.9 | |||
| Dividends | 2,293 | 3,792 | 1,499 | 65.3 | |||
| Other non-taxation revenue | 6,123 | 6,286 | 164 | 2.7 | |||
| Non-taxation revenue | 21,018 | 22,488 | 1,470 | 7.0 | |||
| Total revenue | 379,947 | 373,922 | -6,024 | -1.6 | |||
| Memorandum: | |||||||
| Total excise | 26,020 | 25,900 | -120 | -0.5 | |||
| Total customs duty | 8,880 | 8,930 | 50 | 0.6 | |||
| Capital gains tax(d) | 7,900 | 7,900 | 0 | 0.0 | |||
| Medicare and DisabilityCare Australia levy(e) | 9,960 | 9,950 | -10 | -0.1 | |||
(a) The numbers for PEFO were not published in the 2013 PEFO.
(b) Net revenue from the minerals resource rent tax is expected to be $0.3 billion in 2013‑14 which represents the net revenue impact across different revenue heads. These include the offsetting reductions in company tax (through deductibility) and interactions with other taxes. The Government has announced the minerals resource rent tax will not apply beyond 30 June 2014.
(c) Other alcoholic beverages are those not exceeding 10 per cent by volume of alcohol (excluding beer, brandy and wine).
(d) Capital gains tax is part of gross other individuals, company tax and superannuation fund taxes.
(e) The Medicare and DisabilityCare Australia levy liabilities are reported in the year in which the income tax liability is assessed.
| Estimates | Change on PEFO | ||||||
|---|---|---|---|---|---|---|---|
| PEFO | MYEFO | ||||||
| $m | $m | $m | % | ||||
| Individuals and other withholding taxes | |||||||
| Gross income tax withholding | 175,480 | 170,210 | -5,270 | -3.0 | |||
| Gross other individuals | 40,450 | 39,500 | -950 | -2.3 | |||
| less: Refunds | 28,300 | 28,000 | -300 | -1.1 | |||
| Total individuals and other withholding tax | 187,630 | 181,710 | -5,920 | -3.2 | |||
| Fringe benefits tax | 4,660 | 4,550 | -110 | -2.4 | |||
| Company tax | 72,080 | 72,330 | 250 | 0.3 | |||
| Superannuation fund taxes | 9,260 | 8,930 | -330 | -3.6 | |||
| Minerals resource rent tax(b) | 1,100 | 300 | -800 | -72.7 | |||
| Petroleum resource rent tax | 2,470 | 2,100 | -370 | -15.0 | |||
| Income taxation revenue | 277,200 | 269,920 | -7,280 | -2.6 | |||
| Goods and services tax | 56,055 | 55,710 | -345 | -0.6 | |||
| Wine equalisation tax | 820 | 790 | -30 | -3.7 | |||
| Luxury car tax | 350 | 380 | 30 | 8.6 | |||
| Excise and customs duty | |||||||
| Petrol | 5,770 | 5,670 | -100 | -1.7 | |||
| Diesel | 9,205 | 9,205 | 0 | 0.0 | |||
| Other fuel products | 3,630 | 3,590 | -40 | -1.1 | |||
| Tobacco | 9,120 | 9,130 | 10 | 0.1 | |||
| Beer | 2,430 | 2,370 | -60 | -2.5 | |||
| Spirits | 2,160 | 2,090 | -70 | -3.2 | |||
| Other alcoholic beverages(c) | 1,060 | 990 | -70 | -6.6 | |||
| Other customs duty | |||||||
| Textiles, clothing and footwear | 580 | 600 | 20 | 3.4 | |||
| Passenger motor vehicles | 990 | 920 | -70 | -7.1 | |||
| Other imports | 1,680 | 1,600 | -80 | -4.8 | |||
| less: Refunds and drawbacks | 260 | 260 | 0 | 0.0 | |||
| Total excise and customs duty | 36,365 | 35,905 | -460 | -1.3 | |||
| Carbon pricing mechanism | 2,020 | 0 | -2,020 | -100 | |||
| Agricultural levies | 451 | 470 | 18 | 4.1 | |||
| Other taxes | 3,227 | 3,182 | -45 | -1.4 | |||
| Indirect taxation revenue | 99,288 | 96,437 | -2,851 | -2.9 | |||
| Taxation revenue | 376,488 | 366,356 | -10,131 | -2.7 | |||
| Sales of goods and services | 8,569 | 8,496 | -73 | -0.9 | |||
| Interest | 3,994 | 4,060 | 66 | 1.6 | |||
| Dividends | 2,428 | 2,448 | 19 | 0.8 | |||
| Other non-taxation revenue | 6,260 | 6,522 | 262 | 4.2 | |||
| Non-taxation revenue | 21,251 | 21,525 | 274 | 1.3 | |||
| Total revenue | 397,739 | 387,882 | -9,858 | -2.5 | |||
| Memorandum: | |||||||
| Total excise | 27,115 | 26,725 | -390 | -1.4 | |||
| Total customs duty | 9,250 | 9,180 | -70 | -0.8 | |||
| Capital gains tax(d) | 10,700 | 10,700 | 0 | 0.0 | |||
| Medicare and DisabilityCare Australia levy(e) | 10,470 | 10,380 | -90 | -0.9 | |||
(a) The numbers for PEFO were not published in the 2013 PEFO.
(b) Net revenue from the minerals resource rent tax is expected to be $0.2 billion in 2014‑15 which represents the net revenue impact across different revenue heads. These include the offsetting reductions in company tax (through deductibility) and interactions with other taxes. The Government has announced the minerals resource rent tax will not apply beyond 30 June 2014.
(c) Other alcoholic beverages are those not exceeding 10 per cent by volume of alcohol (excluding beer, brandy and wine).
(d) Capital gains tax is part of gross other individuals, company tax and superannuation fund taxes.
(e) The Medicare and DisabilityCare Australia levy liabilities are reported in the year in which the income tax liability is assessed.
Expense and net capital investment estimates
Movements in accrual expenses and net capital investment over the forward estimates are broadly similar to the movements in cash payments. The key exceptions include:
- an increase in the accrued superannuation expenses for civilian superannuation schemes of $930 million reflecting differences between the timing of cash payments and accrued expenses; and
- the provision of GST to the States and Territories, reflecting higher than estimated GST entitlements of $361 million relating to the 2012‑13 financial year. This amount was accrued in 2012‑13 and was paid in 2013‑14.
Estimates of Australian Government general government sector expenses by function can be found in Attachment D.
Table 3.11 provides a reconciliation of expense estimates.
| Estimates | Projections | ||||||
|---|---|---|---|---|---|---|---|
| 2013‑14 | 2014‑15 | 2015‑16 | 2016‑17 | ||||
| $m | $m | $m | $m | ||||
| 2013‑14 Budget expenses | 398,301 | 415,663 | 431,015 | 454,747 | |||
| Changes from 2013‑14 Budget to 2013 PEFO | |||||||
| Effect of policy decisions(a) | 1,134 | -1,628 | -1,565 | -2,303 | |||
| Effect of parameter and other variations | 2,050 | 1,950 | 1,461 | 2,092 | |||
| Total variations | 3,184 | 322 | -103 | -211 | |||
| 2013 PEFO expenses | 401,485 | 415,985 | 430,911 | 454,536 | |||
| Changes from 2013 PEFO to 2013‑14 MYEFO | |||||||
| Effect of policy decisions(a) | 7,710 | -1,996 | -3,014 | -6,467 | |||
| Effect of economic parameter variations | |||||||
| Total economic parameter variations | 256 | 207 | 1,948 | 2,371 | |||
| Unemployment benefits | 49 | -278 | 1,660 | 2,092 | |||
| Prices and wages | 682 | 1,170 | 1,051 | 1,029 | |||
| Interest and exchange rates | -16 | -26 | -13 | 1 | |||
| GST payments to the States | -459 | -660 | -750 | -750 | |||
| Public debt interest | 732 | 1,357 | 2,262 | 3,191 | |||
| Program specific parameter variations | 1,529 | 1,887 | 1,272 | 1,883 | |||
| Slippage in decisions | 0 | 0 | 0 | 0 | |||
| Other variations | 348 | 319 | 2,640 | 1,596 | |||
| Total variations | 10,574 | 1,773 | 5,108 | 2,574 | |||
| 2013‑14 MYEFO expenses | 412,060 | 417,758 | 436,019 | 457,110 | |||
(a) Excludes secondary impacts on public debt interest of policy decisions and offsets from the Contingency Reserve for decisions taken.
Table 3.12 provides a reconciliation of the net capital investment estimates.
| Estimates | Projections | ||||||
|---|---|---|---|---|---|---|---|
| 2013‑14 | 2014‑15 | 2015‑16 | 2016‑17 | ||||
| $m | $m | $m | $m | ||||
| 2013‑14 Budget net capital investment | 2,945 | 2,204 | 1,126 | 3,003 | |||
| Changes from 2013‑14 Budget to 2013 PEFO | |||||||
| Effect of policy decisions(a) | 314 | -3 | -2 | -2 | |||
| Effect of parameter and other variations | 711 | 1,631 | -617 | -678 | |||
| Total variations | 1,024 | 1,629 | -619 | -681 | |||
| 2013 PEFO net capital investment | 3,970 | 3,833 | 507 | 2,322 | |||
| Changes from 2013 PEFO to 2013‑14 MYEFO | |||||||
| Effect of policy decisions(a) | 283 | 285 | -90 | -161 | |||
| Effect of parameter and other variations | -547 | -2,490 | -237 | 217 | |||
| Total variations | -263 | -2,205 | -327 | 56 | |||
| 2013‑14 MYEFO net capital investment | 3,706 | 1,628 | 180 | 2,378 | |||
(a) Excludes secondary impacts on public debt interest of policy decisions and offsets from the Contingency Reserve for decisions taken.
Headline cash balance
The headline cash balance consists of the underlying cash balance, net cash flows from investments in financial assets for policy purposes (for example, the equity funding of NBN Co), and net Future Fund earnings. Table 3.13 provides a reconciliation between the underlying and headline cash balance estimates.
| Estimates | Projections | ||||||
|---|---|---|---|---|---|---|---|
| 2013‑14 | 2014‑15 | 2015‑16 | 2016‑17 | ||||
| $m | $m | $m | $m | ||||
| 2013‑14 MYEFO underlying cash balance(a) | -46,989 | -33,907 | -24,083 | -17,668 | |||
| plus Net cash flows from investments in financial assets for policy purposes |
|||||||
| Student loans | -5,014 | -6,114 | -6,624 | -7,100 | |||
| NBN investment | -3,500 | -6,317 | -5,286 | -4,692 | |||
| Residential mortgage backed securities | 2,110 | 1,619 | 1,522 | 1,118 | |||
| CEFC loans and investments | -492 | 12 | 29 | 33 | |||
| International loans and subscriptions under AIPRD, IDA and ADF |
-269 | -346 | -352 | -821 | |||
| Farm Finance concessional loans | -210 | -210 | 0 | 0 | |||
| Net other | -147 | -128 | -30 | -19 | |||
| Total net cash flows from investments in financial assets for policy purposes |
-7,522 | -11,484 | -10,741 | -11,481 | |||
| plus Net Future Fund earnings | 2,871 | 2,953 | 3,138 | 3,373 | |||
| 2013‑14 MYEFO headline cash balance | -51,640 | -42,437 | -31,686 | -25,776 | |||
(a) Excludes expected net Future Fund earnings.
The headline cash balance for 2013‑14 is estimated to be a deficit of $51.6 billion (3.3 per cent of GDP), compared with a deficit of $37.2 billion at PEFO.
The deterioration in the headline cash balance has been primarily driven by policy decisions and variations that have affected the underlying cash balance. This deterioration has been partially offset by a reduction in net cash flows from investments in financial assets for policy purposes of $2.4 billion largely reflecting the Government's decision to close the Clean Energy Finance Corporation and the reduced equity funding for NBN Co. These changes improve the headline cash balance by $2.2 billion in 2013‑14, and by $7.4 billion over the forward estimates.
Commonwealth Government Securities
Table 3.14 contains projections of the face value of CGS on issue. It is important to note that there is a debt issuance strategy for the budget year only. Projections beyond the budget year are based on a set of technical assumptions and will vary significantly with changes to budget estimates and projections.
| 2013‑14 | 2014‑15 | 2015‑16 | 2016‑17 | |
|---|---|---|---|---|
| $b | $b | $b | $b | |
| End-of-year amount | 310 | 360 | 400 | 430 |
| Within-year peak(c) | 320 | 370 | 420 | 460 |
| Month of peak (c) | Jun-14 | Apr-15 | Jun-16 | Feb-17 |
(a) Face value data in this table are rounded to the nearest $10 billion.
(b) These figures exclude CGS on issue that are not subject to the Treasurer's Direction, as specified in subsection 51JA(2A) of the Commonwealth Inscribed Stock Act 1911.
(c) The precise within‑year timing of cash outlays and receipts are not known. Projected peaks of CGS on issue are therefore subject to considerable uncertainty.
Source: Australian Office of Financial Management.
Further information on Commonwealth Government Securities is provided in the Debt Statement at Attachment F.
Net debt, net financial worth and net worth
In 2013‑14, net debt for the Australian Government general government sector is estimated to be $191.5 billion (12.1 per cent of GDP), compared with the 2013 PEFO estimate of $184.0 billion (11.7 per cent of GDP). By the end of the forward estimates period, net debt as a percentage of GDP is expected to reach 15.7 per cent in 2016‑17.
The increase in the expected level of net debt since the 2013 PEFO primarily reflects a higher issuance of CGS owing to an increase in the financing requirement, which is partly negated by higher yields (interest rates) than were assumed at the 2013 PEFO.
The overall improvement in net financial worth and net worth in 2013‑14 was mainly driven by the net gain from foreign currency operations of the Reserve Bank of Australia that is incorporated in the Commonwealth balance sheet through investments in other public sector entities.
- Net financial worth for the Australian Government general government sector is estimated to be ‑$289.7 billion (18.4 per cent of GDP) in 2013‑14, compared to the 2013 PEFO estimate of ‑$295.5 billion (18.9 per cent of GDP).
- Net worth for the Australian Government general government sector is expected to be ‑$176.6 billion in 2013‑14, compared to the 2013 PEFO estimate of ‑$181.9 billion.
Net interest payments are estimated to be $8.8 billion in 2013‑14 (0.6 per cent of GDP), which is broadly in line with the 2013 PEFO estimate of $8.4 billion (0.5 per cent of GDP).
Table 3.15 provides a summary of Australian Government general government sector net financial worth, net worth, net debt and net interest payments.
| Estimates | |||||
|---|---|---|---|---|---|
| 2013‑14 | 2014‑15 | ||||
| PEFO | MYEFO | PEFO | MYEFO | ||
| $b | $b | $b | $b | ||
| Financial assets | 260.8 | 273.3 | 279.2 | 289.5 | |
| Non-financial assets | 113.6 | 113.0 | 116.8 | 116.2 | |
| Total assets | 374.4 | 386.3 | 396.0 | 405.7 | |
| Total liabilities | 556.3 | 563.0 | 596.9 | 612.7 | |
| Net worth | -181.9 | -176.6 | -200.9 | -207.0 | |
| Net financial worth(a) | -295.5 | -289.7 | -317.7 | -323.2 | |
| Per cent of GDP | -18.9 | -18.4 | -19.4 | -19.8 | |
| Net debt(b) | 184.0 | 191.5 | 212.1 | 231.1 | |
| Per cent of GDP | 11.7 | 12.1 | 13.0 | 14.2 | |
| Net interest payments | 8.4 | 8.8 | 9.5 | 10.6 | |
| Per cent of GDP | 0.5 | 0.6 | 0.6 | 0.7 | |
| Projections | |||||
| 2015‑16 | 2016‑17 | ||||
| PEFO | MYEFO | PEFO | MYEFO | ||
| $b | $b | $b | $b | ||
| Financial assets | 305.1 | 310.2 | 341.1 | 339.8 | |
| Non-financial assets | 119.0 | 118.3 | 120.5 | 120.2 | |
| Total assets | 424.1 | 428.5 | 461.6 | 460.0 | |
| Total liabilities | 622.2 | 654.5 | 652.5 | 701.2 | |
| Net worth | -198.1 | -226.0 | -190.9 | -241.2 | |
| Net financial worth(a) | -317.1 | -344.4 | -311.4 | -361.4 | |
| Per cent of GDP | -18.4 | -20.2 | -17.1 | -20.2 | |
| Net debt(b) | 219.0 | 259.1 | 217.3 | 280.5 | |
| Per cent of GDP | 12.7 | 15.2 | 12.0 | 15.7 | |
| Net interest payments | 11.5 | 13.5 | 10.0 | 12.8 | |
| Per cent of GDP | 0.7 | 0.8 | 0.6 | 0.7 | |
(a) Net financial worth equals total financial assets minus total liabilities.
(b) Net debt equals the sum of deposits held, government securities, loans and other borrowing, minus the sum of cash and deposits, advances paid and investments, loans and placements.
Structural budget balance
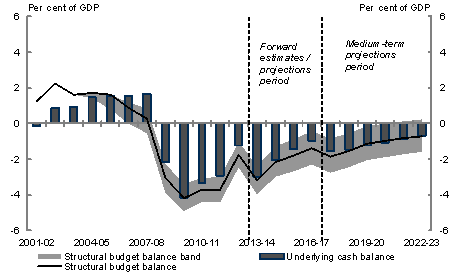
The range of estimates shown in Chart 3.6 suggests that the structural budget balance fell into deficit after 2007‑08. A structural deficit of between 3 and 4 per cent of GDP is estimated in 2013‑14. Estimates of the structural budget balance have deteriorated since the 2013 PEFO, broadly in line with the downgrade to the underlying cash balance. While the structural position of the budget is expected to improve gradually, on current projections the budget is not expected to return to structural balance in the medium‑term, further highlighting that significant adjustment is required to restore fiscal sustainability.
Chart 3.6: Structural budget balance estimates1
Source: ABS cat. no. 5206.0, 5302.0, 6202.0, 6401.0 and Treasury.
Note: The grey range represents the range of structural budget estimates using the OECD's assumption for Australia's structural level of the terms of trade (average between 1986‑87 and 2010‑11), and using the average from 2003‑04 to 2015‑16 consistent with the 2013‑14 Budget. The OECD assumption generates the lower bound of the shaded region, while the 2003‑04 to 2015‑16 average assumption generates the upper bound.
Structural budget balance measures are sensitive to the assumptions and parameters underpinning the estimates, including identifying the structural level of the terms of trade and the relationship between tax receipts and economic activity. Due to the sensitivity of estimates to assumptions, it is best to consider a range of structural budget balance estimates based on plausible assumptions for the underlying parameters as one element of a broader assessment of fiscal sustainability.
1 The structural budget balance estimates shown in Chart 3.6 incorporate a minor methodological change from the model used to produce chart G1 in the 2013 PEFO (detailed in Treasury working paper 2013-01). The 'structural level' of the Gross National Expenditure deflator is now set equal to its projected level, consistent with the Reserve Bank of Australia targeting future growth in consumer prices rather than the level, such that there is no underlying path for domestic prices that the economy will revert to over time. The change in methodology results in an improvement in the structural budget balance of around 0.1 to 0.2 per cent of GDP in 2013‑14 and 2014‑15 relative to the previous methodology.
Note: Where possible, Budget documents are available in HTML and for downloading in Portable Document Format(PDF). If you require further information on any of the tables or charts on this website, please contact The Treasury.
