


Chart Data
Part 1: Overview
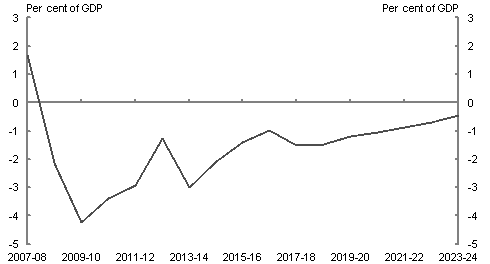
Chart 1.1: Underlying cash balance projected to 2023‑24 if no policy change
Source: Treasury Projections.
This chart shows the underlying cash balance, as a per cent of GDP, projected out to 2023-24. Without policy change and taking no remedial action, budget deficits would be projected in each and every year to 2023-24.
| Underlying cash balance % GDP |
|
|---|---|
| 2007‑08 | 1.7 |
| 2008‑09 | -2.2 |
| 2009‑10 | -4.2 |
| 2010‑11 | -3.4 |
| 2011‑12 | -2.9 |
| 2012‑13 | -1.2 |
| 2013‑14 | -3.0 |
| 2014‑15 | -2.1 |
| 2015‑16 | -1.4 |
| 2016‑17 | -1.0 |
| 2017‑18 | -1.5 |
| 2018‑19 | -1.5 |
| 2019‑20 | -1.2 |
| 2020‑21 | -1.0 |
| 2021‑22 | -0.9 |
| 2022‑23 | -0.7 |
| 2023‑24 | -0.5 |
Part 2: Economic Outlook
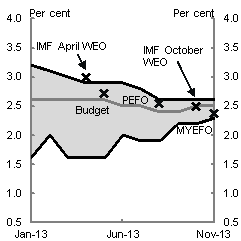
Chart 2.1: Consensus real GDP forecasts
for calendar year 2013
Note: The top and bottom lines represent range of Consensus forecasts. The centre line represents Consensus mean forecast.
Source: Consensus Economics and Treasury.
This chart shows the range of Consensus forecasts for real GDP growth for calendar year 2013 (top and bottom lines), and the mean Consensus forecast (centre line). Published forecasts from the IMF's World Economic Outlook and the Treasury are also included. The chart shows that Treasury's forecasts for calendar year 2013 are broadly consistent with Consensus forecasts and the IMF.
| Consensus Economics - High forecast |
Consensus Economics - Low forecast |
Consensus Economics - Mean forecast |
Treasury forecast |
IMF World Economic Outlook forecast |
|
|---|---|---|---|---|---|
| Jan-13 | 3.2 | 1.6 | 2.6 | ||
| Feb-13 | 3.1 | 2.0 | 2.6 | ||
| Mar-13 | 3.0 | 1.6 | 2.6 | ||
| Apr-13 | 2.9 | 1.6 | 2.6 | 3.0 | |
| May-13 | 2.9 | 1.6 | 2.6 | 2.7 | |
| Jun-13 | 2.9 | 2.0 | 2.5 | ||
| Jul-13 | 2.8 | 1.9 | 2.5 | ||
| Aug-13 | 2.6 | 1.9 | 2.4 | 2.6 | |
| Sep-13 | 2.6 | 2.2 | 2.4 | ||
| Oct-13 | 2.6 | 2.2 | 2.5 | 2.5 | |
| Nov-13 | 2.6 | 2.3 | 2.5 | 2.4 |
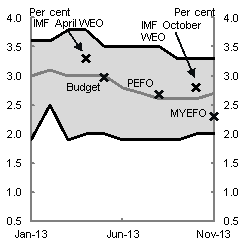
Chart 2.2: Consensus real GDP forecasts
for calendar year 2014
Note: The top and bottom lines represent range of Consensus forecasts. The centre line represents Consensus mean forecast.
Source: Consensus Economics and Treasury.
This chart shows the range of Consensus forecasts for real GDP growth for calendar year 2014 (top and bottom lines), and the mean Consensus forecast (centre line). Published forecasts from the IMF's World Economic Outlook and the Treasury are also included. The chart shows that Treasury's forecasts for calendar year 2014 are broadly consistent with Consensus forecasts and the IMF.
| Consensus Economics - High forecast |
Consensus Economics - Low forecast |
Consensus Economics - Mean forecast |
Treasury forecast |
IMF World Economic Outlook forecast |
|
|---|---|---|---|---|---|
| Jan-13 | 3.6 | 1.9 | 3.0 | ||
| Feb-13 | 3.6 | 2.5 | 3.1 | ||
| Mar-13 | 3.8 | 1.9 | 3.0 | ||
| Apr-13 | 3.8 | 2.0 | 3.0 | 3.3 | |
| May-13 | 3.5 | 2.0 | 3.0 | 3.0 | |
| Jun-13 | 3.5 | 1.9 | 2.8 | ||
| Jul-13 | 3.5 | 1.9 | 2.7 | ||
| Aug-13 | 3.5 | 1.9 | 2.6 | 2.7 | |
| Sep-13 | 3.3 | 1.9 | 2.6 | ||
| Oct-13 | 3.3 | 2.0 | 2.6 | 2.8 | |
| Nov-13 | 3.3 | 2.0 | 2.7 | 2.3 |
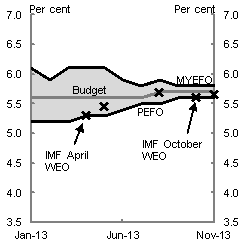
Chart 2.3: Consensus unemployment rate forecasts
for calendar year 2013
Note: The top and bottom lines represent range of Consensus forecasts. The centre line represents Consensus mean forecast.
Source: Consensus Economics and Treasury.
This chart shows the range of Consensus forecasts for the unemployment rate for calendar year 2013 (top and bottom lines), and the mean Consensus forecast (centre line). Published forecasts from the IMF's World Economic Outlook and the Treasury are also included. The chart shows that Treasury's forecasts for calendar year 2013 are broadly consistent with Consensus forecasts and the IMF.
| Consensus Economics - High forecast |
Consensus Economics - Low forecast |
Consensus Economics - Mean forecast |
Treasury forecast |
IMF World Economic Outlook forecast |
|
|---|---|---|---|---|---|
| Jan-13 | 6.1 | 5.2 | 5.6 | ||
| Feb-13 | 5.9 | 5.2 | 5.6 | ||
| Mar-13 | 6.1 | 5.2 | 5.6 | ||
| Apr-13 | 6.1 | 5.3 | 5.6 | 5.3 | |
| May-13 | 6.1 | 5.3 | 5.6 | 5.5 | |
| Jun-13 | 5.9 | 5.4 | 5.6 | ||
| Jul-13 | 5.8 | 5.5 | 5.6 | ||
| Aug-13 | 5.9 | 5.5 | 5.7 | 5.7 | |
| Sep-13 | 5.8 | 5.6 | 5.7 | ||
| Oct-13 | 5.8 | 5.6 | 5.7 | 5.6 | |
| Nov-13 | 5.8 | 5.6 | 5.7 | 5.7 |
Chart 2.4: Consensus unemployment rate forecasts
for calendar year 2014
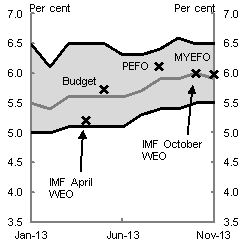
Note: The top and bottom lines represent range of Consensus forecasts. The centre line represents Consensus mean forecast.
Source: Consensus Economics and Treasury.
This chart shows the range of Consensus forecasts for the unemployment rate for calendar year 2014 (top and bottom lines), and the mean Consensus forecast (centre line). Published forecasts from the IMF's World Economic Outlook and the Treasury are also included. The chart shows that Treasury's forecasts for calendar year 2014 are broadly consistent with Consensus forecasts and the IMF.
| Consensus Economics - High forecast |
Consensus Economics - Low forecast |
Consensus Economics - Mean forecast |
Treasury forecast |
IMF World Economic Outlook forecast |
|
|---|---|---|---|---|---|
| Jan-13 | 6.5 | 5.0 | 5.5 | ||
| Feb-13 | 6.1 | 5.0 | 5.4 | ||
| Mar-13 | 6.5 | 5.1 | 5.6 | ||
| Apr-13 | 6.5 | 5.1 | 5.6 | 5.2 | |
| May-13 | 6.5 | 5.1 | 5.6 | 5.7 | |
| Jun-13 | 6.3 | 5.1 | 5.6 | ||
| Jul-13 | 6.3 | 5.3 | 5.7 | ||
| Aug-13 | 6.4 | 5.4 | 5.9 | 6.1 | |
| Sep-13 | 6.6 | 5.4 | 5.9 | ||
| Oct-13 | 6.5 | 5.5 | 6.0 | 6.0 | |
| Nov-13 | 6.5 | 5.5 | 5.9 | 6.0 |
Chart A: Projections of Australia's terms of trade
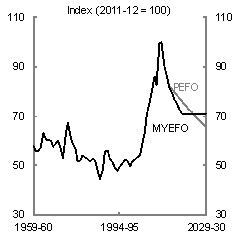
Source: ABS cat. no. 5204.0 and Treasury.
This chart shows the historical value of Australia's terms of trade over the period 1959-60 to 2012-13, and Treasury's forecasts of the terms of trade at PEFO and MYEFO over the period 2013-14 to 2029-30. At MYEFO the terms of trade are projected to decline at a faster rate than at PEFO, but are projected to stabilise in 2019-20.
| Terms of trade as at PEFO | Terms of trade as at MYEFO | |
|---|---|---|
| 1959-60 | 58.1 | 58.1 |
| 1960-61 | 55.6 | 55.6 |
| 1961-62 | 56.2 | 56.2 |
| 1962-63 | 57.4 | 57.4 |
| 1963-64 | 63.3 | 63.3 |
| 1964-65 | 60.3 | 60.3 |
| 1965-66 | 60.3 | 60.3 |
| 1966-67 | 59.9 | 59.9 |
| 1967-68 | 57.5 | 57.5 |
| 1968-69 | 59.0 | 59.0 |
| 1969-70 | 60.1 | 60.1 |
| 1970-71 | 56.3 | 56.3 |
| 1971-72 | 52.8 | 52.8 |
| 1972-73 | 62.8 | 62.8 |
| 1973-74 | 67.5 | 67.5 |
| 1974-75 | 61.4 | 61.4 |
| 1975-76 | 58.6 | 58.6 |
| 1976-77 | 56.7 | 56.7 |
| 1977-78 | 51.6 | 51.6 |
| 1978-79 | 51.9 | 51.9 |
| 1979-80 | 53.9 | 53.9 |
| 1980-81 | 53.4 | 53.4 |
| 1981-82 | 52.6 | 52.6 |
| 1982-83 | 51.8 | 51.8 |
| 1983-84 | 53.0 | 53.0 |
| 1984-85 | 52.2 | 52.2 |
| 1985-86 | 47.3 | 47.3 |
| 1986-87 | 44.7 | 44.7 |
| 1987-88 | 48.6 | 48.6 |
| 1988-89 | 55.8 | 55.8 |
| 1989-90 | 55.9 | 55.9 |
| 1990-91 | 53.0 | 53.0 |
| 1991-92 | 51.4 | 51.4 |
| 1992-93 | 49.2 | 49.2 |
| 1993-94 | 47.8 | 47.8 |
| 1994-95 | 49.4 | 49.4 |
| 1995-96 | 51.0 | 51.0 |
| 1996-97 | 52.5 | 52.5 |
| 1997-98 | 52.2 | 52.2 |
| 1998-99 | 49.7 | 49.7 |
| 1999-00 | 51.6 | 51.6 |
| 2000-01 | 52.5 | 52.5 |
| 2001-02 | 53.3 | 53.3 |
| 2002-03 | 54.1 | 54.1 |
| 2003-04 | 58.1 | 58.1 |
| 2004-05 | 63.7 | 63.7 |
| 2005-06 | 70.6 | 70.6 |
| 2006-07 | 75.7 | 75.7 |
| 2007-08 | 79.9 | 79.9 |
| 2008-09 | 86.0 | 86.0 |
| 2009-10 | 82.5 | 82.5 |
| 2010-11 | 99.6 | 99.6 |
| 2011-12 | 100.0 | 100.0 |
| 2012-13 | 90.2 | 90.2 |
| 2013-14 | 85.1 | 85.8 |
| 2014-15 | 82.0 | 81.6 |
| 2015-16 | 80.8 | 79.2 |
| 2016-17 | 79.6 | 77.0 |
| 2017-18 | 78.4 | 74.8 |
| 2018-19 | 77.2 | 72.7 |
| 2019-20 | 76.1 | 70.6 |
| 2020-21 | 75.0 | 70.6 |
| 2021-22 | 73.9 | 70.6 |
| 2022-23 | 72.8 | 70.6 |
| 2023-24 | 71.7 | 70.6 |
| 2024-25 | 70.7 | 70.6 |
| 2025-26 | 69.6 | 70.6 |
| 2026-27 | 68.6 | 70.6 |
| 2027-28 | 67.6 | 70.6 |
| 2028-29 | 66.6 | 70.6 |
| 2029-30 | 65.6 | 70.6 |
Part 3: Fiscal Outlook
Chart 3.1: Payments for official development assistance (ODA), the National Disability Insurance Scheme (NDIS), and Students First projected from 2013‑14 to 2019‑20
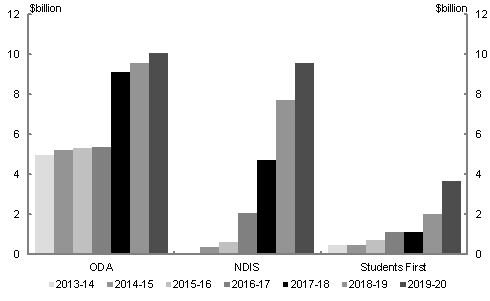
Note: Over the forward estimates official development assistance is grown in line with inflation, consistent with the Government's election commitment. The medium‑term projections for official development assistance assume a return to the former Government's target of 0.5 per cent of gross national income from 2017‑18. The projections for Schools First assume all States and Territories participate and there are no changes to the former Government's policy except those announced publicly on 2 December 2013. The projections for NDIS are based on the current policy.
Source: Treasury projections
This chart shows that funding for ODA, NDIS and Students First will ramp-up significantly in the years beyond the forward estimates. ODA will grow from $5.0 billion in 2013-14 to $10.1 billion in 2019-20; NDIS will grow from $0.0 billion to $9.6 billion; and Students First will grow from $0.5 billion to $3.7 billion.
| 2013-14 | 2014-15 | 2015-16 | 2016-17 | 2017-18 | 2018-19 | 2019-20 | |
|---|---|---|---|---|---|---|---|
| ODA | 5.0 | 5.2 | 5.3 | 5.4 | 9.1 | 9.6 | 10.1 |
| NDIS | 0.0 | 0.4 | 0.6 | 2.1 | 4.7 | 7.7 | 9.6 |
| Students First | 0.5 | 0.5 | 0.7 | 1.1 | 1.1 | 2.0 | 3.7 |
Chart 3.2: Payments and receipts projected to 2023‑24
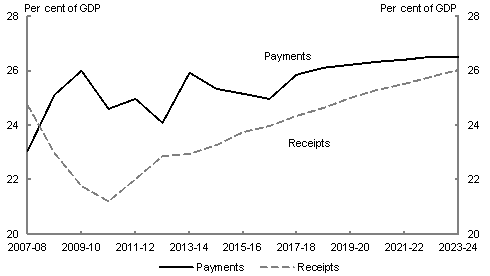
Note: Payments and receipts exclude Future Fund payments and earnings, which are also not included in the underlying cash balance.
Source: Treasury projections.
This chart shows receipts and payments (excluding Future Fund earnings and payments) projected to 2023‑24, if there was be no policy change, and tax as a share of GDP was allowed to grow through fiscal drag. In this scenario, receipts would grow to 26 per cent of GDP and payments would reach 26.5 per cent of GDP.
| Payments % GDP |
Receipts % GDP |
|
|---|---|---|
| 2007-08 | 23.1 | 24.7 |
| 2008-09 | 25.1 | 23.0 |
| 2009-10 | 26.0 | 21.8 |
| 2010-11 | 24.6 | 21.2 |
| 2011-12 | 24.9 | 22.0 |
| 2012-13 | 24.1 | 22.8 |
| 2013-14 | 25.9 | 22.9 |
| 2014-15 | 25.3 | 23.3 |
| 2015-16 | 25.1 | 23.7 |
| 2016-17 | 25.0 | 24.0 |
| 2017-18 | 25.9 | 24.3 |
| 2018-19 | 26.1 | 24.6 |
| 2019-20 | 26.2 | 25.0 |
| 2020-21 | 26.3 | 25.3 |
| 2021-22 | 26.4 | 25.5 |
| 2022-23 | 26.5 | 25.8 |
| 2023-24 | 26.5 | 26.0 |
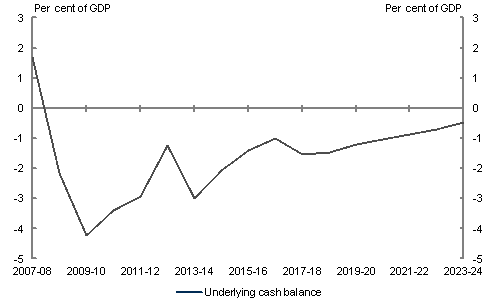
Chart 3.3: Underlying cash balance projected to 2023‑24
Note: The underlying cash balance excludes Future Fund earnings and payments.
Source: Treasury projections.
This chart shows the underlying cash balance, as a per cent of GDP, projected out to 2023-24. Without policy change and taking no remedial action, budget deficits would be projected in each and every year to 2023-24.
| Underlying cash balance % GDP |
|
|---|---|
| 2007-08 | 1.7 |
| 2008-09 | -2.2 |
| 2009-10 | -4.2 |
| 2010-11 | -3.4 |
| 2011-12 | -2.9 |
| 2012-13 | -1.2 |
| 2013-14 | -3.0 |
| 2014-15 | -2.1 |
| 2015-16 | -1.4 |
| 2016-17 | -1.0 |
| 2017-18 | -1.5 |
| 2018-19 | -1.5 |
| 2019-20 | -1.2 |
| 2020-21 | -1.0 |
| 2021-22 | -0.9 |
| 2022-23 | -0.7 |
| 2023-24 | -0.5 |
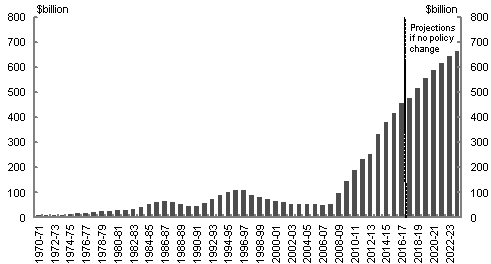
Chart 3.4: Face value of Commonwealth Government Securities on issue projected to 2023‑24
Source: Treasury projections.
This chart shows the face value of CGS on issue, projected to 2023-24, where it reaches $667 billion.
| Face value of CGS on issue (end of year) | |
|---|---|
| 2013-14 | 313 |
| 2014-15 | 360 |
| 2015-16 | 398 |
| 2016-17 | 436 |
| 2017-18 | 478 |
| 2018-19 | 518 |
| 2019-20 | 560 |
| 2020-21 | 592 |
| 2021-22 | 619 |
| 2022-23 | 645 |
| 2023-24 | 667 |
NOTE: For 1970-71 to 2012-13 data, refer to Appendix D: Historical Australian Government Data, Table D6.
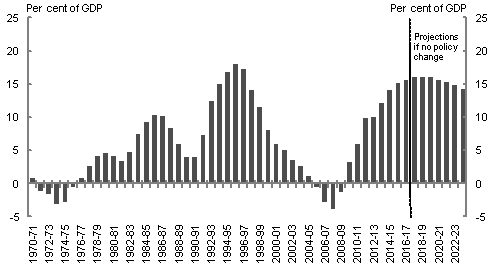
Chart 3.5: Net debt projected to 2023‑24
Source: Treasury projections.
This chart shows net debt, as a per cent of GDP, projected to 2023-24. Net debt is expected to peak at 16.2 per cent of GDP in 2018-19.
| Net Debt % GDP |
|
|---|---|
| 2013-14 | 12.1 |
| 2014-15 | 14.2 |
| 2015-16 | 15.2 |
| 2016-17 | 15.7 |
| 2017-18 | 16.1 |
| 2018-19 | 16.2 |
| 2019-20 | 16.2 |
| 2020-21 | 15.7 |
| 2021-22 | 15.4 |
| 2022-23 | 14.9 |
| 2023-24 | 14.3 |
NOTE: For 1970-71 to 2012-13 data, refer to Appendix D: Historical Australian Government Data, Table D5.
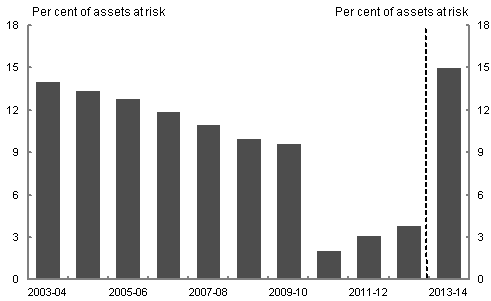
Chart A: Reserve Bank Reserve Fund
Source: Reserve Bank of Australia.
This chart shows the level of the Reserve Bank Reserve Fund as a per cent of assets at risk from 2003-04 to 2013-14. It shows that the balance of the Reserve Bank Reserve Fund has fallen significantly below the 15 per cent of assets at risk now considered prudent by the Reserve Bank Board.
| per cent of assets at risk | |
|---|---|
| 2003-04 | 14.0 |
| 2004-05 | 13.0 |
| 2005-06 | 12.5 |
| 2006-07 | 12.0 |
| 2007-08 | 11.0 |
| 2008-09 | 10.0 |
| 2009-10 | 9.6 |
| 2010-11 | 2.1 |
| 2011-12 | 3.1 |
| 2012-13 | 3.8 |
| 2013-14 | 15.0 |
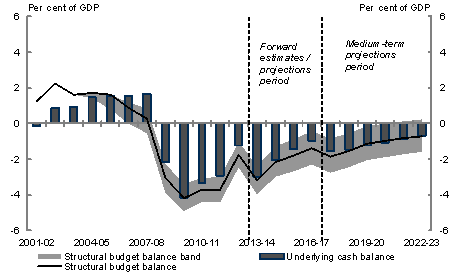
Chart 3.6: Structural budget balance estimates
Source: ABS cat. no. 5206.0, 5302.0, 6202.0, 6401.0 and Treasury.
Note: The grey range represents the range of structural budget estimates using the OECD's assumption for Australia's structural level of the terms of trade (average between 1986‑87 and 2010‑11), and using the average from 2003‑04 to 2015‑16 consistent with the 2013‑14 Budget. The OECD assumption generates the lower bound of the shaded region, while the 2003‑04 to 2015‑16 average assumption generates the upper bound.
This chart shows the range of structural budget balance estimates from 2001-02 to 2022-23. It shows that the structural budget balance fell into deficit from around 2007-08, deteriorating with the onset of the Global Financial Crisis. A structural deficit of between 3 and 4 per cent of GDP is estimated in 2013-14, with gradual improvement over the forward estimates and projections period.
| Underlying cash balance |
Structural budget balance |
High TOT assumption |
Low TOT assumption |
Range | |
|---|---|---|---|---|---|
| 2001-02 | -0.14 | 1.26 | 1.26 | 1.26 | 0 |
| 2002-03 | 0.92 | 2.23 | 2.23 | 2.23 | 0 |
| 2003-04 | 0.92 | 1.62 | 1.62 | 1.62 | 0 |
| 2004-05 | 1.47 | 1.72 | 1.72 | 1.42 | -0.3 |
| 2005-06 | 1.58 | 1.63 | 1.63 | 0.79 | -0.83 |
| 2006-07 | 1.58 | 0.89 | 1.18 | -0.01 | -1.18 |
| 2007-08 | 1.68 | 0.28 | 0.86 | -0.55 | -1.41 |
| 2008-09 | -2.14 | -3.07 | -2.24 | -3.88 | -1.64 |
| 2009-10 | -4.20 | -4.17 | -3.39 | -4.92 | -1.53 |
| 2010-11 | -3.37 | -3.72 | -3.03 | -4.38 | -1.36 |
| 2011-12 | -2.92 | -3.72 | -3.01 | -4.38 | -1.37 |
| 2012-13 | -1.24 | -1.75 | -0.99 | -2.46 | -1.46 |
| 2013-14 | -2.98 | -3.21 | -2.40 | -3.98 | -1.58 |
| 2014-15 | -2.08 | -2.16 | -1.28 | -2.98 | -1.7 |
| 2015-16 | -1.41 | -1.80 | -0.87 | -2.67 | -1.8 |
| 2016-17 | -0.99 | -1.38 | -0.42 | -2.29 | -1.87 |
| 2017-18 | -1.52 | -1.82 | -0.84 | -2.76 | -1.92 |
| 2018-19 | -1.48 | -1.52 | -0.53 | -2.45 | -1.92 |
| 2019-20 | -1.21 | -1.12 | -0.14 | -2.05 | -1.91 |
| 2020-21 | -1.05 | -0.97 | 0.00 | -1.88 | -1.88 |
| 2021-22 | -0.86 | -0.82 | 0.13 | -1.72 | -1.85 |
| 2022-23 | -0.70 | -0.70 | 0.24 | -1.58 | -1.82 |
Chart 3.7: Confidence intervals around real GDP growth rate forecasts
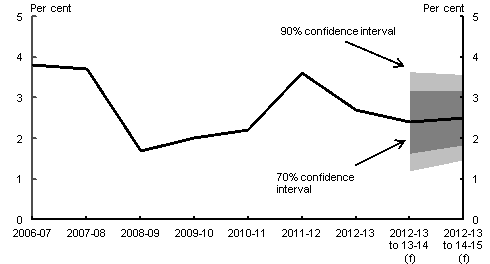
Note: The central line shows the outcomes and the 2013‑14 MYEFO forecasts. Annual growth rates are reported for the outcomes. Average annualised growth rates from 2012‑13 are reported for 2013‑14 onwards. (f) are forecasts. Confidence intervals are based on the root mean square errors (RMSEs) of December forecasts from 1998 onwards, with outcomes based on September quarter 2013 National Accounts data.
Source: ABS cat. no. 5206.0 and Treasury.
This chart shows confidence intervals around the MYEFO forecast for average annualised real GDP growth. The forecast for real GDP growth in 2013-14 is 2½ per cent, with the 90 per cent confidence interval 2½ percentage points wide.
| Real GDP growth rate | 90% confidence interval - upper bound | 70% confidence interval - upper bound | 70% confidence interval - lower bound | 90% confidence interval - lower bound | |
|---|---|---|---|---|---|
| 2006-07 | 3.8 | ||||
| 2007-08 | 3.7 | ||||
| 2008-09 | 1.7 | ||||
| 2009-10 | 2.0 | ||||
| 2010-11 | 2.2 | ||||
| 2011-12 | 3.6 | ||||
| 2012-13 | 2.7 | ||||
| 2012-13 to 13-14 (f) | 2.4 | 3.63 | 3.18 | 1.62 | 1.17 |
| 2012-13 to 14-15 (f) | 2.5 | 3.57 | 3.17 | 1.83 | 1.43 |
Chart 3.8: Confidence intervals around nominal GDP growth rate forecasts
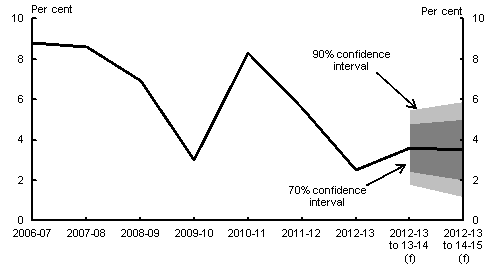
Note: See note to Chart 3.7.
Source: ABS cat. no. 5206.0 and Treasury.
This chart shows confidence intervals around the MYEFO forecast for average annualised nominal GDP growth. The forecast for nominal GDP growth in 2013-14 is 3½ per cent, with the 90 per cent confidence interval 3¾ percentage points wide.
| Nominal GDP growth rate | 90% confidence interval - upper bound | 70% confidence interval - upper bound | 70% confidence interval - lower bound | 90% confidence interval - lower bound | |
|---|---|---|---|---|---|
| 2006-07 | 8.8 | ||||
| 2007-08 | 8.6 | ||||
| 2008-09 | 6.9 | ||||
| 2009-10 | 3.0 | ||||
| 2010-11 | 8.3 | ||||
| 2011-12 | 5.6 | ||||
| 2012-13 | 2.5 | ||||
| 2012-13 to 13-14 (f) | 3.6 | 5.47 | 4.78 | 2.42 | 1.73 |
| 2012-13 to 14-15 (f) | 3.5 | 5.89 | 5.00 | 2.00 | 1.11 |
Chart 3.9: Confidence intervals around receipt forecasts
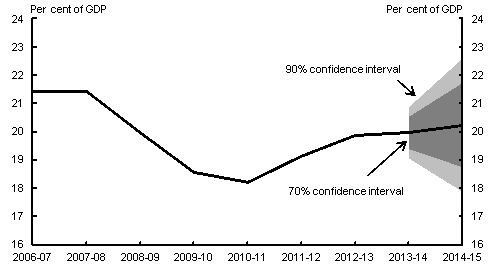
Note: The central line shows the outcomes and 2013‑14 MYEFO point estimate forecasts. Confidence intervals use RMSEs for MYEFO forecasts from the 1998‑99 MYEFO onwards.
Source: Budget papers and Treasury.
This chart shows confidence intervals around the 2013‑14 MYEFO forecast for receipts (excluding GST) as a percentage of GDP. The 2013‑14 MYEFO forecast for receipts (excluding GST) is approximately 20.0 per cent of GDP in 2013‑14. The 90 per cent confidence interval for 2013‑14 is around 1.8 percentage points wide.
| % GDP | Central forecast | 90% upper | 70% upper | 70% lower | 90% lower |
|---|---|---|---|---|---|
| 2006-07 | 21.4 | 21.4 | 21.4 | 21.4 | 21.4 |
| 2007-08 | 21.4 | 21.4 | 21.4 | 21.4 | 21.4 |
| 2008-09 | 20.0 | 20.0 | 20.0 | 20.0 | 20.0 |
| 2009-10 | 18.6 | 18.6 | 18.6 | 18.6 | 18.6 |
| 2010-11 | 18.2 | 18.2 | 18.2 | 18.2 | 18.2 |
| 2011-12 | 19.1 | 19.1 | 19.1 | 19.1 | 19.1 |
| 2012-13 | 19.9 | 19.9 | 19.9 | 19.9 | 19.9 |
| 2013-14 | 20.0 | 20.9 | 20.5 | 19.4 | 19.1 |
| 2014-15 | 20.2 | 22.6 | 21.7 | 18.7 | 17.9 |
Chart 3.10: Confidence intervals around payment forecasts
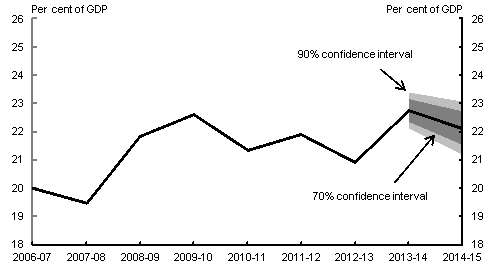
Note: See note to Chart 3.9.
Source: Budget papers and Treasury.
This chart shows confidence intervals around the 2013‑14 MYEFO forecast for payments (excluding GST) as a percentage of GDP. The 2013‑14 MYEFO forecast for payments (excluding GST) is approximately 22.8 per cent of GDP in 2013‑14. The 90 per cent confidence interval for 2013‑14 is around 1.3 percentage points wide.
| % GDP | Central forecast | 90% upper | 70% upper | 70% lower | 90% lower |
|---|---|---|---|---|---|
| 2006-07 | 20.0 | 20.0 | 20.0 | 20.0 | 20.0 |
| 2007-08 | 19.5 | 19.5 | 19.5 | 19.5 | 19.5 |
| 2008-09 | 21.8 | 21.8 | 21.8 | 21.8 | 21.8 |
| 2009-10 | 22.6 | 22.6 | 22.6 | 22.6 | 22.6 |
| 2010-11 | 21.3 | 21.3 | 21.3 | 21.3 | 21.3 |
| 2011-12 | 21.9 | 21.9 | 21.9 | 21.9 | 21.9 |
| 2012-13 | 20.9 | 20.9 | 20.9 | 20.9 | 20.9 |
| 2013-14 | 22.8 | 23.4 | 23.2 | 22.3 | 22.1 |
| 2014-15 | 22.1 | 23.1 | 22.7 | 21.5 | 21.2 |
Chart 3.11: Confidence intervals around the underlying cash balance forecasts
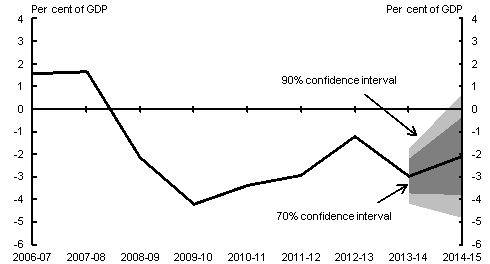
Note: See note to Chart 3.9.
Source: Budget papers and Treasury.
This chart shows confidence intervals around the 2013‑14 MYEFO forecast for underlying cash balance (excluding expected net Future Fund earnings) as a percentage of GDP. The 2013‑14 MYEFO forecast for the underlying cash balance (excluding expected net Future Fund earnings) is approximately -3.0 per cent of GDP in 2013‑14. The 90 per cent confidence interval for 2013‑14 is around 2.4 percentage points wide.
| % GDP | Central forecast | 90% upper | 70% upper | 70% lower | 90% lower |
|---|---|---|---|---|---|
| 2006-07 | 1.6 | 1.6 | 1.6 | 1.6 | 1.6 |
| 2007-08 | 1.7 | 1.7 | 1.7 | 1.7 | 1.7 |
| 2008-09 | -2.2 | -2.2 | -2.2 | -2.2 | -2.2 |
| 2009-10 | -4.2 | -4.2 | -4.2 | -4.2 | -4.2 |
| 2010-11 | -3.4 | -3.4 | -3.4 | -3.4 | -3.4 |
| 2011-12 | -2.9 | -2.9 | -2.9 | -2.9 | -2.9 |
| 2012-13 | -1.2 | -1.2 | -1.2 | -1.2 | -1.2 |
| 2013-14 | -3.0 | -1.8 | -2.2 | -3.7 | -4.2 |
| 2014-15 | -2.1 | 0.7 | -0.3 | -3.8 | -4.8 |
Part 3: Fiscal outlook - Attachment F
Chart 1: 2016‑17 face value of CGS on issue subject to Treasurer's Direction —reconciliation
from the 2013 PEFO to 2013‑14 MYEFO
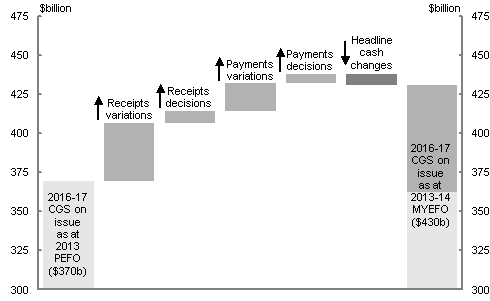
Note: End‑of‑year data. Projections of the face value of CGS on issue are published to the nearest $10 billion. As such, numbers may not add due to rounding.
Source: 2013 PEFO and Treasury.
This chart shows the change in the projected end-of-year face value of CGS on issue in 2016-17, between the 2013 PEFO (around $370 billion) and the 2013-14 MYEFO (around $430 billion). The majority of the increase in the face value of CGS on issue since the 2013 PEFO can be attributed to a deterioration in the underlying cash balance as a result of parameter and other variations. There has been a smaller deterioration in the underlying cash balance as a result of policy decisions since the 2013 PEFO. The Government's decision to close the Clean Energy Finance Corporation has reduced the headline cash deficit over the forward estimates, reducing required CGS on issue.
| $ billion | |
|---|---|
| 2013 PEFO: 2016-17 end-of-year face value of CGS on issue subject to the Treasurer's Direction |
370 |
| Receipts variations | 36.8 |
| Receipts decisions | 7.6 |
| Payments variations | 17.8 |
| Payments decisions | 6.1 |
| Headline cash changes | 7.3 |
| 2013-14 MYEFO: 2016-17 end-of-year face value of CGS on issue subject to the Treasurer's Direction |
430 |
Note: end-of-year data. Projections of the face value of CGS on issue are published to the nearest $10 billion. As such, numbers may not add due to rounding.
Chart 2: Total face value of CGS on issue 1970‑71 to 2023‑24
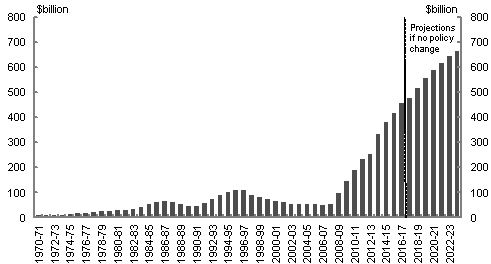
Notes: This chart shows the total amount of CGS on issue including that held on behalf of the States and the Northern Territory, but excludes Commonwealth holdings. Data to 2016‑17 are published in Appendix D: Historical Australian Government data.
Source: Australian Office of Financial Management and Treasury projections.
This chart shows the face value of CGS on issue, projected to 2023-24, where it reaches $667 billion.
| Face value of CGS on issue (end of year) |
|
|---|---|
| 2013-14 | 313 |
| 2014-15 | 360 |
| 2015-16 | 398 |
| 2016-17 | 436 |
| 2017-18 | 478 |
| 2018-19 | 518 |
| 2019-20 | 560 |
| 2020-21 | 592 |
| 2021-22 | 619 |
| 2022-23 | 645 |
| 2023-24 | 667 |
NOTE: For 1970-71 to 2012-13 data, refer to Appendix D: Historical Australian Government Data, Table D6.
Chart 3: 2016‑17 net debt — reconciliation from the 2013 PEFO to 2013‑14 MYEFO
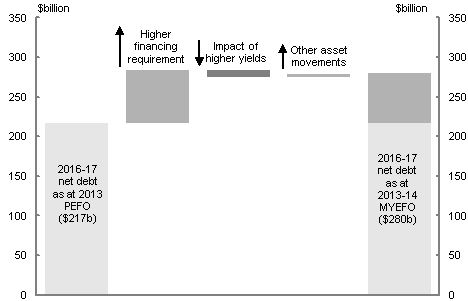
Source: 2013 PEFO and Treasury.
This chart shows the drivers of the increase in the net debt between the 2013 PEFO and the 2013-14 MYEFO. The chart shows that net debt increased in 2016-17 as a result of the higher issuance of CGS relative to the 2013 PEFO from the increased financing requirement. This was partially offset by a revaluation of the projected CGS on issue owing to an increase in yield (interest rates) on CGS. Other minor movements related to assets revaluation included in net debt.
| PEFO | Higher financing requirement |
Impact of yield movements |
Other | MYEFO | |
|---|---|---|---|---|---|
| $ billion | 217 | 67 | 9 | 5 | 280 |
Chart 4: Net debt on issue as a per cent of GDP 1970‑71 to 2023‑24
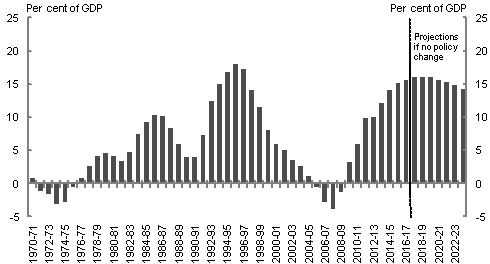
Source: Treasury projections.
This chart shows net debt, as a per cent of GDP, projected to 2023-24. Net debt is expected to peak at 16.2 per cent of GDP in 2018-19.
| Net Debt | |
|---|---|
| 2013-14 | 12.1 |
| 2014-15 | 14.2 |
| 2015-16 | 15.2 |
| 2016-17 | 15.7 |
| 2017-18 | 16.1 |
| 2018-19 | 16.2 |
| 2019-20 | 16.2 |
| 2020-21 | 15.7 |
| 2021-22 | 15.4 |
| 2022-23 | 14.9 |
| 2023-24 | 14.3 |
NOTE: For 1970-71 to 2012-13 data, refer to Appendix D: Historical Australian Government Data, Table D5.
Chart 5: Non‑resident holdings of Commonwealth Government Securities
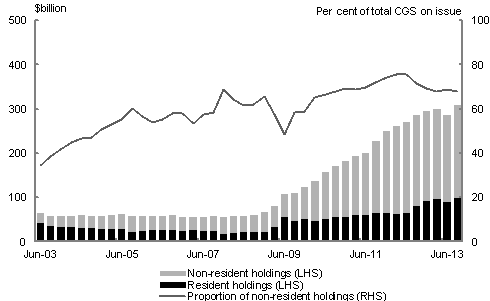
Note: Data refer to the market value of holdings.
Source: ABS Catalogue Number 5302.0 and Australian Office of Financial Management.
This chart shows that the proportion of non-resident holdings of Commonwealth Government Securities has risen significantly since 2009. As at the September quarter 2013, 67.9 per cent of total CGS on issue was not held by residents of Australia.
| Quarter | Non-resident holdings of CGS ($ billion) |
Proportion of non-resident holdings to total holdings of CGS on issue (per cent) |
|---|---|---|
| Jun-03 | 22 | 34.7 |
| Sep-03 | 23 | 38.4 |
| Dec-03 | 24 | 41.7 |
| Mar-04 | 26 | 44.7 |
| Jun-04 | 28 | 46.5 |
| Sep-04 | 27 | 47.2 |
| Dec-04 | 30 | 50.6 |
| Mar-05 | 32 | 53.2 |
| Jun-05 | 34 | 55.3 |
| Sep-05 | 34 | 60.2 |
| Dec-05 | 34 | 56.8 |
| Mar-06 | 32 | 53.7 |
| Jun-06 | 33 | 55.3 |
| Sep-06 | 35 | 57.9 |
| Dec-06 | 32 | 57.8 |
| Mar-07 | 30 | 53.5 |
| Jun-07 | 33 | 57.7 |
| Sep-07 | 34 | 58.6 |
| Dec-07 | 39 | 69.0 |
| Mar-08 | 38 | 64.4 |
| Jun-08 | 36 | 61.4 |
| Sep-08 | 37 | 62.2 |
| Dec-08 | 44 | 65.7 |
| Mar-09 | 46 | 57.6 |
| Jun-09 | 52 | 48.4 |
| Sep-09 | 65 | 58.6 |
| Dec-09 | 73 | 59.0 |
| Mar-10 | 90 | 65.4 |
| Jun-10 | 105 | 66.7 |
| Sep-10 | 117 | 68.0 |
| Dec-10 | 126 | 69.2 |
| Mar-11 | 133 | 68.8 |
| Jun-11 | 141 | 69.8 |
| Sep-11 | 164 | 71.9 |
| Dec-11 | 185 | 74.1 |
| Mar-12 | 198 | 75.8 |
| Jun-12 | 205 | 75.8 |
| Sep-12 | 206 | 71.5 |
| Dec-12 | 204 | 69.1 |
| Mar-13 | 203 | 68.0 |
| Jun-13 | 197 | 68.8 |
| Sep-13 | 209 | 67.9 |
Note: Data refer to the market value of holdings.
Chart 6: Yield curve assumptions
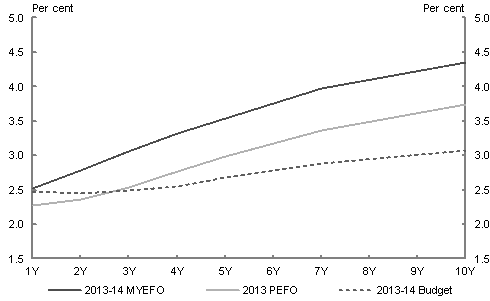
Source: Australian Office of Financial Management.
This chart shows the yield curve assumptions underpinning the 2013-14 Budget, the 2013 PEFO and the 2013-14 MYEFO. The yield curve has shifted upward since the 2013 PEFO. The assumed market yields at the 2013-14 MYEFO result in a weighted average cost of borrowing of around 3.9 per cent for future issuance of Treasury Bonds in the forward estimates period, compared with around 3.5 per cent at the 2013 PEFO.
| 2013-14 Budget | 2013 PEFO | 2013-14 MYEFO | |
|---|---|---|---|
| 1 year | nfp | nfp | nfp |
| 2 years | nfp | nfp | nfp |
| 3 years | nfp | nfp | nfp |
| 4 years | nfp | nfp | nfp |
| 5 years | nfp | nfp | nfp |
| 7 years | nfp | nfp | nfp |
| 10 years | nfp | nfp | nfp |
nfp = not for publication
Chart 7: Net interest payments from 1970‑71 to 2016‑17
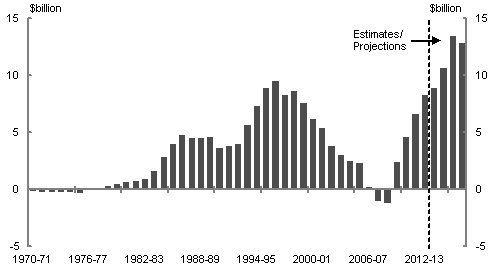
Note: Net interest payments are equal to the difference between interest paid and interest receipts.
Net interest payments from 1970‑71 to 2016‑17
| Net interest payments ($ million) |
|
|---|---|
| 1970-71 | -189 |
| 1971-72 | -245 |
| 1972-73 | -252 |
| 1973-74 | -286 |
| 1974-75 | -242 |
| 1975-76 | -330 |
| 1976-77 | -62 |
| 1977-78 | 4 |
| 1978-79 | 254 |
| 1979-80 | 440 |
| 1980-81 | 620 |
| 1981-82 | 680 |
| 1982-83 | 896 |
| 1983-84 | 1621 |
| 1984-85 | 2813 |
| 1985-86 | 3952 |
| 1986-87 | 4762 |
| 1987-88 | 4503 |
| 1988-89 | 4475 |
| 1989-90 | 4549 |
| 1990-91 | 3636 |
| 1991-92 | 3810 |
| 1992-93 | 3986 |
| 1993-94 | 5628 |
| 1994-95 | 7292 |
| 1995-96 | 8861 |
| 1996-97 | 9489 |
| 1997-98 | 8279 |
| 1998-99 | 8649 |
| 1999-00 | 7514 |
| 2000-01 | 6195 |
| 2001-02 | 5352 |
| 2002-03 | 3758 |
| 2003-04 | 3040 |
| 2004-05 | 2502 |
| 2005-06 | 2303 |
| 2006-07 | 228 |
| 2007-08 | -1015 |
| 2008-09 | -1196 |
| 2009-10 | 2386 |
| 2010-11 | 4608 |
| 2011-12 | 6609 |
| 2012-13 | 8285 |
| 2013-14(e) | 8828 |
| 2014-15(e) | 10617 |
| 2015-16(p) | 13466 |
| 2016-17(p) | 12824 |
(e) estimate
(p) projection
Note: Where possible, Budget documents are available in HTML and for downloading in Portable Document Format(PDF). If you require further information on any of the tables or charts on this website, please contact The Treasury.
