




Part 3: Fiscal outlook (Continued)
Confidence intervals around the economic and fiscal forecasts
Estimates of economic and fiscal variables over the forward estimates period are subject to inherent uncertainties, which generally tend to increase as the forecast horizon lengthens. Confidence intervals quantifying estimates of uncertainty around the key 2013‑14 MYEFO forecasts have been constructed using a set of historical forecasting errors based on forecasts made since 1998 (where errors are defined by the difference between the forecasts and actual outcomes). These confidence intervals highlight that there is a range of plausible alternative outcomes around any given point estimate and provide a guide to the degree of uncertainty around these forecasts, typically spanning a wide range of outcomes.1 As part of continuing to improve its forecasting processes, Treasury is implementing the recommendations of the 2012 Review of Treasury Macroeconomic and Revenue Forecasting.
Measures of uncertainty around economic forecasts
For real and nominal GDP forecasts, confidence intervals could be presented around forecasts of annual growth rates, average annualised growth rates or cumulative growth rates. While all three measures have merit, a key role of GDP forecasts is an input for producing revenue and expenses forecasts. For this purpose, the average annualised GDP growth rate or cumulative GDP growth rate is the more relevant summary statistic, since the level of GDP depends on cumulative growth over time. The average annualised growth rate is reported as it captures the effects of cumulative growth, while still giving a sense of what the annual growth rate would be.
Chart 3.7 suggests that real GDP growth in 2013‑14 is expected to be 2½ per cent, with the 70 per cent confidence interval ranging from 1½ to 3¼ per cent. In other words, if forecast errors are similar to those in the past 15 years, there is a 70 per cent probability that the growth rate will lie in this range.
Chart 3.7: Confidence intervals around real GDP growth rate forecasts
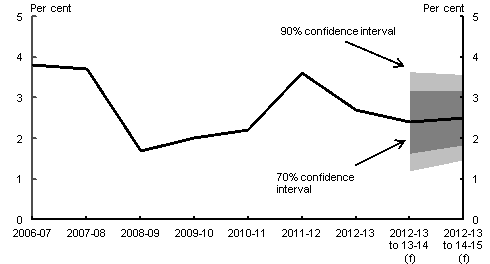
Note: The central line shows the outcomes and the 2013‑14 MYEFO forecasts. Annual growth rates are reported for the outcomes. Average annualised growth rates from 2012‑13 are reported for 2013‑14 onwards. (f) are forecasts. Confidence intervals are based on the root mean square errors (RMSEs) of December forecasts from 1998 onwards, with outcomes based on September quarter 2013 National Accounts data.
Source: ABS cat. no. 5206.0 and Treasury.
The uncertainty around nominal GDP is larger, reflecting uncertainty about the outlook for real GDP and uncertainty about the outlook for prices or the GDP deflator. Chart 3.8 suggests that nominal GDP growth in 2013‑14 is expected to be 3½ per cent, with the 70 per cent confidence interval ranging from 2½ to 4¾ per cent.
Chart 3.8: Confidence intervals around nominal GDP growth rate forecasts
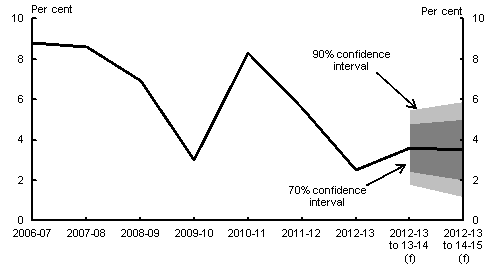
Note: See note to Chart 3.7.
Source: ABS cat. no. 5206.0 and Treasury.
Measures of uncertainty around fiscal forecasts
The following charts illustrate measures of uncertainty around the key 2013‑14 MYEFO fiscal forecasts. These charts show confidence intervals around the forecasts for receipts (excluding GST and including Future Fund earnings), payments (excluding GST) and the underlying cash balance (which excludes Future Fund earnings). These confidence intervals have been calculated by comparing the historical forecasts of the relevant fiscal variable with the outcome, expressed as a proportion of the GDP outcome in the relevant year.2
Impacts of future policy decisions are beyond the scope of fiscal forecasts. To account for this, confidence intervals constructed around the fiscal variables exclude historical variations caused by policy decisions. These intervals take into account errors caused by parameter and other variations in isolation, but include the public debt interest impact of policy decisions.3
It should be noted that excluding historical variations due to policy decisions does not exclude cases that are classified in budget documentation as parameter and other variations, but have more in common with decisions of government. For example, specific decisions to re‐profile spending due to changes in timing of projects are captured for reporting purposes as parameter and other variations. Similarly, new and often substantial spending decisions to provide assistance for the impacts of natural disasters are covered under the Natural Disaster Relief and Recovery Arrangements and are captured for budget reporting purposes as parameter and other variations. The treatment of these spending decisions contributes to the size of the confidence intervals around payments. Further uncertainty from this source can be expected over the forecast period as provisions for impacts of future natural disasters are not included in estimates beyond the budget year.
GST was not reported as a Commonwealth tax in budget documents prior to the 2008‑09 Budget. As a result, GST data has been removed from historical receipts and payments data to abstract from any error associated with this change in accounting treatment.
Receipts
Chart 3.9: Confidence intervals around receipt forecasts
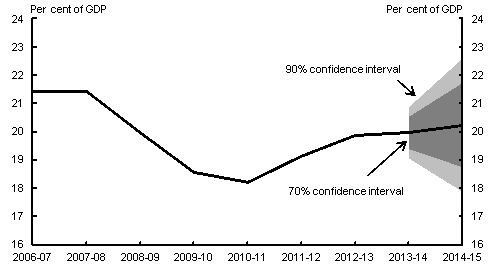
Note: The central line shows the outcomes and 2013‑14 MYEFO point estimate forecasts. Confidence intervals use RMSEs for MYEFO forecasts from the 1998‑99 MYEFO onwards.
Source: Budget papers and Treasury.
Chart 3.9 suggests that there is notable uncertainty around receipt forecasts and that this uncertainty increases over the estimates period. It suggests that in 2013‑14, the width of the 70 per cent confidence interval for the 2013‑14 MYEFO receipts forecast is approximately 1.1 per cent of GDP ($20 billion) and the 90 per cent confidence interval is approximately 1.8 per cent of GDP ($30 billion).
Payments
Chart 3.10: Confidence intervals around payment forecasts
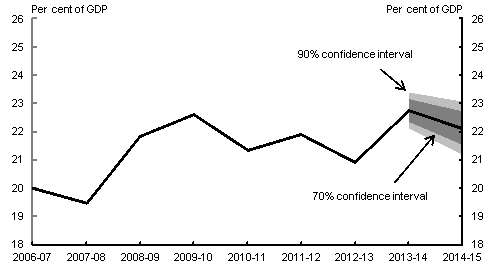
Note: See note to Chart 3.9.
Source: Budget papers and Treasury.
Chart 3.10 suggests that there is moderate uncertainty around payment forecasts and that this uncertainty exhibits apparent but contained growth over the estimates period. It suggests that in 2013‑14, the width of the 70 per cent confidence interval for the 2013‑14 MYEFO payments forecast is approximately 0.8 per cent of GDP ($15 billion) and the 90 per cent confidence interval is approximately 1.3 per cent of GDP ($20 billion).
Underlying cash balance
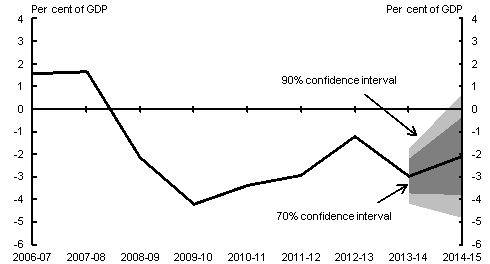
Chart 3.11: Confidence intervals around the underlying cash balance forecasts
Note: See note to Chart 3.9.
Source: Budget papers and Treasury.
Chart 3.11 suggests that there is notable uncertainty around the underlying cash balance forecasts and that this uncertainty exhibits pronounced growth over the estimates period. It suggests that in 2013‑14, the width of the 70 per cent confidence interval for the 2013‑14 MYEFO underlying cash balance forecast is approximately 1.5 per cent of GDP ($25 billion) and the 90 per cent confidence interval is approximately 2.4 per cent of GDP ($40 billion).
Further details on the methodology used to construct confidence intervals around the economic and fiscal forecasts can be found in Treasury Working Paper 2013‑04: Estimates of uncertainty around budget forecasts available online at: http://www.treasury.gov.au/PublicationsAndMedia/Publications/2013/Estimates‑of‑uncertainty‑around‑budget‑forecasts.
1 The 2012 Review of Treasury Macroeconomic and Revenue Forecasting found that the official macroeconomic and tax revenue forecasting performance is comparable with or better than that of other forecasters, suggesting that the uncertainty around the forecasts is similar or smaller than those of other forecasters.
2 The confidence intervals around the fiscal forecasts are based on GDP outcomes, rather than GDP forecasts, as discussed in Treasury Working Paper 2013-04: Estimates of uncertainty around budget forecasts which found that forecast errors for GDP and receipts (in particular) are highly correlated.
3 The impacts of past policy decisions on historical public debt interest through time cannot be readily identified or estimated. For this reason, no adjustment has been made to exclude these impacts from the analysis.
Note: Where possible, Budget documents are available in HTML and for downloading in Portable Document Format(PDF). If you require further information on any of the tables or charts on this website, please contact The Treasury.
