


Chart data
Budget Paper No.3 — Part 3
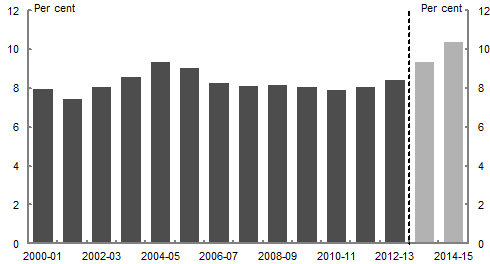
This column chart shows the proportion of the total GST entitlement that is redistributed, compared to an equal per capita distribution, for each financial year from 2000-01 to 2012-13. The chart also includes the estimated redistribution for 2013-14 and 2014-15. The chart shows that, whilst the proportion of the total GST entitlement that is redistributed has fluctuated from year to year, it has generally remained at around 8 per cent of the total from 2000-01 to 2012-13. It is expected to rise to around 10.4 per cent in 2014-15.
| Outcomes | Estimates | |
|---|---|---|
| 2000-01 | 7.985946 | |
| 2001-02 | 7.453357 | |
| 2002-03 | 8.088855 | |
| 2003-04 | 8.583154 | |
| 2004-05 | 9.370855 | |
| 2005-06 | 9.039887 | |
| 2006-07 | 8.284252 | |
| 2007-08 | 8.129117 | |
| 2008-09 | 8.157327 | |
| 2009-10 | 8.063128 | |
| 2010-11 | 7.944102 | |
| 2011-12 | 8.064341 | |
| 2012-13 | 8.425743 | |
| 2013-14 | 9.351339 | |
| 2014-15 | 10.41332 |
Budget Paper No.3 — Part 4
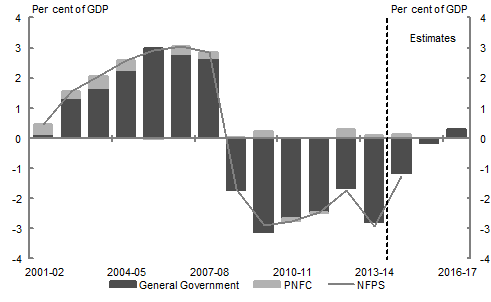
(a) Data for the PNFC sector (and therefore NFPS) are not available beyond 2014-15.
This chart shows the consolidated net operating balance by sector as a per cent of GDP from 2001-02 to 2016-17. Data for the public non-financial corporations sector and non-financial public sector are not available beyond 2014-15. The non-financial public sector recorded net operating surpluses between 2001-02 and 2007‑08. Since 2008‑09 the non-financial public sector has recorded net operating deficits and is expected to remain in deficit in 2014-15. The consolidated general government sector is expected to remain in deficit in 2014-15 before returning to surplus by 2016-17.
| X Values | General Government | PNFC | NFPS |
|---|---|---|---|
| 2001-02 | 0.12 | 0.35 | 0.47 |
| 2002-03 | 1.31 | 0.25 | 1.56 |
| 2003-04 | 1.67 | 0.39 | 2.07 |
| 2004-05 | 2.26 | 0.33 | 2.59 |
| 2005-06 | 2.98 | -0.05 | 2.93 |
| 2006-07 | 2.78 | 0.27 | 3.05 |
| 2007-08 | 2.67 | 0.18 | 2.84 |
| 2008-09 | -1.72 | 0.02 | -1.70 |
| 2009-10 | -3.13 | 0.25 | -2.88 |
| 2010-11 | -2.64 | -0.10 | -2.74 |
| 2011-12 | -2.45 | -0.02 | -2.47 |
| 2012-13 | -1.66 | 0.30 | -1.73 |
| 2013-14 | -2.79 | 0.10 | -2.92 |
| 2014-15 | -1.15 | 0.12 | -1.26 |
| 2015-16 | -0.15 | ||
| 2016-17 | 0.30 |
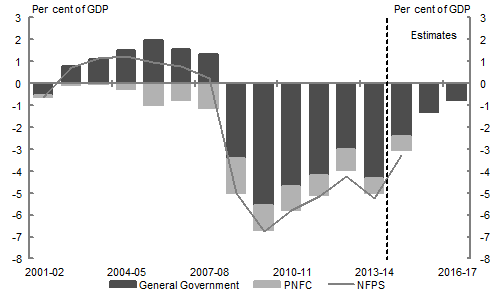
(a) Data for the PNFC sector (and therefore the NFPS) are not available beyond 2014‑15.
This chart shows the consolidated fiscal balance by sector as a per cent of GDP from 2001-02 to 2016-17. Data for the public non-financial corporations sector and non-financial public sector are not available beyond 2014-15. The non-financial public sector recorded fiscal surpluses between 2002-03 and 2007-08. Since 2008-09 the non-financial public sector has recorded fiscal deficits and is projected to remain in deficit in 2014-15. The general government sector follows a similar pattern to the non-financial public sector, with deficits shrinking over the forward estimates.
| X Values | General Government | PNFC | NFPS |
|---|---|---|---|
| 2001-02 | -0.52 | -0.11 | -0.63 |
| 2002-03 | 0.79 | -0.07 | 0.72 |
| 2003-04 | 1.10 | -0.02 | 1.14 |
| 2004-05 | 1.53 | -0.28 | 1.26 |
| 2005-06 | 1.95 | -0.99 | 0.99 |
| 2006-07 | 1.57 | -0.79 | 0.78 |
| 2007-08 | 1.35 | -1.11 | 0.25 |
| 2008-09 | -3.42 | -1.58 | -5.00 |
| 2009-10 | -5.55 | -1.16 | -6.73 |
| 2010-11 | -4.69 | -1.09 | -5.78 |
| 2011-12 | -4.21 | -0.88 | -5.13 |
| 2012-13 | -3.00 | -0.94 | -4.22 |
| 2013-14 | -4.33 | -0.70 | -5.25 |
| 2014-15 | -2.40 | -0.64 | -3.26 |
| 2015-16 | -1.33 | ||
| 2016-17 | -0.79 |
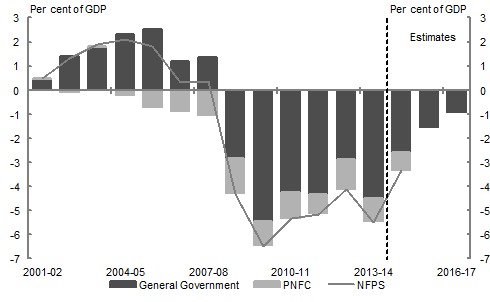
(a) Data for the PNFC sector (and therefore the NFPS) are not available beyond 2014‑15.
This chart shows the consolidated cash balance by sector as a per cent of GDP from 2001-02 to 2016-17. Data for the public non-financial corporations sector and non-financial public sector are not available beyond 2014-15. The non-financial public sector recorded cash surpluses between 2001-02 and 2007-08, but deficits since 2008-09 are estimated to continue into 2014-15. The general government sector follows a similar pattern with deficits declining over the forward estimates, while the public non-financial corporations sector has been in deficit since 2004-05 and is expected to remain in deficit in 2014-15.
| X Values | General Government | PNFC | NFPS |
|---|---|---|---|
| 2001-02 | 0.44 | 0.04 | 0.48 |
| 2002-03 | 1.40 | -0.07 | 1.32 |
| 2003-04 | 1.79 | 0.04 | 1.88 |
| 2004-05 | 2.33 | -0.23 | 2.10 |
| 2005-06 | 2.52 | -0.72 | 1.82 |
| 2006-07 | 1.18 | -0.88 | 0.30 |
| 2007-08 | 1.37 | -1.04 | 0.35 |
| 2008-09 | -2.82 | -1.48 | -4.31 |
| 2009-10 | -5.46 | -1.00 | -6.48 |
| 2010-11 | -4.26 | -1.08 | -5.33 |
| 2011-12 | -4.33 | -0.78 | -5.15 |
| 2012-13 | -2.89 | -1.20 | -4.11 |
| 2013-14 | -4.48 | -0.96 | -5.47 |
| 2014-15 | -2.57 | -0.74 | -3.31 |
| 2015-16 | -1.54 | ||
| 2016-17 | -0.91 |
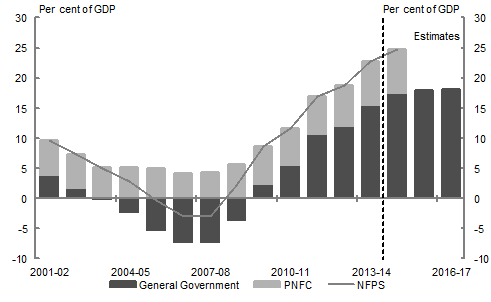
(a) Data for the PNFC sector (and therefore the NFPS) are not available beyond 2014‑15.
This chart shows the consolidated net debt from 2001-02 until 2016-17. Data for the public non-financial corporations sector and consolidated non-financial public sector are not available beyond 2014-15. Net debt in the non-financial public sector decreased between 2001-02 and 2006-07 reaching a low of negative 3 per cent of GDP in 2006-07 before increasing each year from 2007-08 as a result of the global financial crisis. Net debt in the general government sector follows a similar pattern, but the rate of increase is forecast to ease from 2014-15.
| X Values | General Government | PNFC | NFPS |
|---|---|---|---|
| 2001-02 | 3.86 | 5.73 | 9.59 |
| 2002-03 | 1.75 | 5.5 | 7.26 |
| 2003-04 | -0.19 | 5.13 | 4.94 |
| 2004-05 | -2.21 | 5.13 | 2.92 |
| 2005-06 | -5.3 | 5 | -0.29 |
| 2006-07 | -7.19 | 4.19 | -3 |
| 2007-08 | -7.31 | 4.42 | -2.89 |
| 2008-09 | -3.53 | 5.72 | 2.19 |
| 2009-10 | 2.28 | 6.38 | 8.66 |
| 2010-11 | 5.49 | 6.14 | 11.64 |
| 2011-12 | 10.61 | 6.3 | 16.91 |
| 2012-13 | 12 | 6.85 | 18.85 |
| 2013-14 | 15.5 | 7.2 | 22.7 |
| 2014-15 | 17.41 | 7.37 | 24.78 |
| 2015-16 | 17.91 | ||
| 2016-17 | 18.07 |