


Part 3: General Revenue Assistance
Overview of payments
General revenue assistance is a broad category of payments. This assistance is provided to the States without conditions, to spend according to their own budget priorities. The main form of general revenue assistance is the GST entitlement. Other general revenue assistance includes payments in relation to municipal services in the Australian Capital Territory, royalties, and Snowy Hydro Limited tax compensation.
In 2014‑15, the States will receive $54.9 billion from the Commonwealth in total general revenue assistance — $53.7 billion for the GST entitlement and $1.2 billion for other general revenue assistance. This represents a 5.9 per cent increase in the GST entitlement compared to the $50.7 billion the States are expected to receive in 2013‑14. In 2014‑15, total general revenue assistance to the States will represent 13.2 per cent of total Commonwealth expenditure. Total general revenue assistance provided to the States by the Commonwealth is shown in Table 3.1 and Table 3.2 shows a breakdown by State.
| $million | 2013‑14 | 2014‑15 | 2015‑16 | 2016‑17 | 2017‑18 |
|---|---|---|---|---|---|
| GST entitlement | 50,720.0 | 53,710.0 | 57,020.0 | 60,440.0 | 63,810.0 |
| Other payments | |||||
| ACT municipal services | 37.3 | 38.0 | 38.6 | 39.3 | 40.0 |
| Reduced royalties | 72.8 | 54.9 | 56.9 | 61.5 | 56.2 |
| Royalties | 1,149.7 | 983.5 | 974.5 | 981.8 | 928.2 |
| Snowy Hydro Limited tax compensation | 76.0 | 75.0 | 75.0 | 75.0 | 75.0 |
| Total other payments | 1,335.8 | 1,151.4 | 1,145.1 | 1,157.6 | 1,099.4 |
| Total | 52,055.8 | 54,861.4 | 58,165.1 | 61,597.6 | 64,909.4 |
| $million | NSW | VIC | QLD | WA | SA | TAS | ACT | NT | Total |
|---|---|---|---|---|---|---|---|---|---|
| 2013‑14 | 15,777.8 | 11,451.4 | 10,822.7 | 2,557.6 | 4,618.2 | 1,809.5 | 1,061.2 | 2,807.6 | 52,055.8 |
| 2014‑15 | 16,808.1 | 11,853.4 | 11,735.7 | 2,310.1 | 4,956.3 | 1,911.4 | 1,136.5 | 3,166.4 | 54,861.4 |
| 2015‑16 | 17,602.6 | 12,588.4 | 12,658.8 | 2,405.2 | 5,251.8 | 2,095.2 | 1,204.2 | 3,384.2 | 58,165.1 |
| 2016‑17 | 18,259.4 | 13,256.7 | 13,932.4 | 2,493.6 | 5,698.5 | 2,149.6 | 1,254.7 | 3,571.0 | 61,597.6 |
| 2017‑18 | 19,283.5 | 14,180.6 | 14,660.3 | 2,765.3 | 5,921.3 | 2,202.9 | 1,309.5 | 3,657.7 | 64,909.4 |
(a) State splits for royalties are not published due to commercial sensitivities. Therefore, total general revenue assistance will not equal the sum of the state splits above.
GST entitlement to the States
Under the Intergovernmental Agreement on Federal Financial Relations, the States are entitled to receive payments from the Commonwealth equivalent to the revenue received from the GST. GST revenue refers to the amount of GST recognised by the Australian Taxation Office (ATO), less the amount not remitted to the ATO as at 30 June of each financial year. GST entitlement refers to the amount of GST which is entitled to be distributed to the States. GST payments reflect the GST entitlement which is distributed to the States adjusted for any balancing amount from the prior financial year.
Specifically, GST revenue for a financial year varies from the amount of GST paid to the States for that year because of:
- GST revenues which are recognised on a Commonwealth whole‑of‑government basis, but not remitted to the ATO by 30 June of each financial year, as the revenues will not be remitted until the following financial year;
- penalties, other than general interest charge (GIC) penalties, which are not included in the definition in the Federal Financial Relations Act 2009 of GST to be paid to the States;
- the GST component of sales by Commonwealth agencies which has been collected by those agencies but which, as at 30 June in each financial year, has not been remitted to the ATO, because it is not due to be paid until the next Business Activity Statement is lodged; and
- a balancing adjustment to account for any variation in the previous financial year between the Treasurer's final outcome determination, and GST payment advances made during that financial year.
States receive monthly advances of GST throughout the year based on the Commonwealth estimate of the GST entitlement. The Treasurer makes a determination of the components of GST revenue collected in the financial year upon receipt of the final outcome after the close of the financial year. Any variation between GST advances and the final outcome is settled in the following financial year.
In 2013‑14, an amount of $361.0 million was added to the States' 2013‑14 GST entitlement as a balancing adjustment for the difference between the final amount and advances made during the 2012‑13 financial year.
A reconciliation of GST revenue, GST entitlement and GST payments to the States is provided in Table 3.3.
| $million | 2013‑14 | 2014‑15 | 2015‑16 | 2016‑17 | 2017‑18 |
|---|---|---|---|---|---|
| GST revenue | 54,321 | 56,970 | 60,370 | 63,740 | 67,300 |
| less change in GST receivables | 3,318 | 2,992 | 3,080 | 3,017 | 3,201 |
| GST receipts | 51,003 | 53,978 | 57,290 | 60,723 | 64,099 |
| less non-GIC penalties collected | 250 | 260 | 270 | 280 | 290 |
| less GST collected by Commonwealth agencies but not yet remitted to the ATO |
33 | 8 | 0 | 3 | -1 |
| GST entitlement | 50,720 | 53,710 | 57,020 | 60,440 | 63,810 |
| plus prior year balancing adjustment | 361 | ||||
| GST payments to the States | 51,081 | 53,710 | 57,020 | 60,440 | 63,810 |
Table 3.4 provides a reconciliation of the GST entitlement estimates since the 2013‑14 Budget and 2013‑14 MYEFO. The reconciliation accounts for policy decisions and parameter and other variations. The GST entitlement in 2014‑15 has been revised up by $1.0 billion since the 2013‑14 MYEFO.
| $million | 2013‑14 | 2014‑15 | 2015‑16 | 2016‑17 |
|---|---|---|---|---|
| GST entitlement at 2013‑14 Budget | 50,250 | 52,820 | 55,800 | 58,670 |
| Changes between 2013‑14 Budget and MYEFO | ||||
| Effect of policy decisions | 92 | 152 | 232 | 303 |
| Effect of parameter and other variations | -362 | -272 | -252 | -33 |
| Total variations | -270 | -120 | -20 | 270 |
| GST entitlement at 2013‑14 MYEFO | 49,980 | 52,700 | 55,780 | 58,940 |
| Changes between 2013‑14 MYEFO and Budget | ||||
| Effect of policy decisions | -2 | 4 | 9 | 23 |
| Effect of parameter and other variations | 742 | 1,006 | 1,231 | 1,477 |
| Total variations | 740 | 1,010 | 1,240 | 1,500 |
| GST entitlement at 2014‑15 Budget | 50,720 | 53,710 | 57,020 | 60,440 |
Specific policy decisions taken since MYEFO that affect the GST entitlement are shown in Table 3.5. These decisions increase the amount of the GST entitlement by $71.1 million over five years to 2017‑18.
Detailed information on policy decisions since the 2013‑14 MYEFO is included in Budget Paper No. 2, Budget Measures 2014‑15.
| $million | 2013‑14 | 2014‑15 | 2015‑16 | 2016‑17 | 2017‑18 |
|---|---|---|---|---|---|
| Migration Programme — allocation of places for 2014‑15 | -1.8 | -6.0 | -11.3 | -17.0 | -22.8 |
| Reintroduction of fuel excise indexation | 0.0 | 10.0 | 20.0 | 40.0 | 60.0 |
| Total | -1.8 | 4.0 | 8.7 | 23.0 | 37.2 |
Distribution of the GST entitlement among the States
The Commonwealth distributes GST among the States in accordance with the principle of horizontal fiscal equalisation and having regard to the recommendations of the Commonwealth Grants Commission (the Commission).
The Commission recommends GST revenue sharing relativities to be used in calculating each State's entitlement of the GST pool. The relativities determine how much GST each State receives compared with an equal per capita share and are determined such that, if each State made the same effort to raise revenue from its own sources and operated at the same level of efficiency, each State would have the capacity to provide services and the associated infrastructure at the same standard.
This does not necessarily result in the same standard of government services being delivered — just the equalisation of each State's capacity to provide the same standard of services. In calculating GST relativities, the Commission takes into account differences in the States' capacities to raise revenues and differences in the costs the States would incur in providing the same standard of government services, including through acquiring the infrastructure used to deliver those services.
Table 3.6 shows the relativities recommended by the Commission and determined by the Treasurer for 2013‑14 and 2014‑15, and the Commonwealth projected relativities for distributing GST for 2015‑16 to 2017‑18. The Commission does not provide projected relativities.
| NSW | VIC | QLD | WA | SA | TAS | ACT | NT | |
|---|---|---|---|---|---|---|---|---|
| 2013‑14 | 0.96576 | 0.90398 | 1.05624 | 0.44581 | 1.26167 | 1.61454 | 1.22083 | 5.31414 |
| 2014‑15 | 0.97500 | 0.88282 | 1.07876 | 0.37627 | 1.28803 | 1.63485 | 1.23600 | 5.66061 |
| 2015‑16(a) | 0.96513 | 0.88240 | 1.09328 | 0.36355 | 1.29491 | 1.71346 | 1.23444 | 5.70038 |
| 2016‑17(a) | 0.94732 | 0.87560 | 1.13192 | 0.34988 | 1.33452 | 1.68279 | 1.21322 | 5.67391 |
| 2017‑18(a) | 0.95023 | 0.88592 | 1.12472 | 0.36364 | 1.32193 | 1.65697 | 1.19896 | 5.50247 |
(a) Treasury projection.
The Commonwealth's relativity projections utilise a simplified version of the Commission's workings, starting with each State's relative fiscal need from the Commission's most recent Update report, in this case, the Report on GST Revenue Sharing Relativities — 2014 Update. Technical adjustments are then made for estimated changes in the size of the GST pool, State population shares and the distribution of National SPPs. This means that the Commonwealth's projections do not try to predict future State revenues, expenses or take into account any other major changes in Commonwealth‑State financial relations.
Consistent with the Commission's approach, the projected relativity for an individual year is the average of relativities for three historical assessment years. For example, the 2015‑16 projected relativity is based on relativities for 2011‑12, 2012‑13 and 2013‑14.
The detailed calculation for the distribution of the GST entitlement in 2013‑14 and 2014‑15 is shown in Table 3.7. Table 3.8 shows the distribution of the GST entitlement over the budget year and forward estimates.
| Estimated 31 December population (1) |
GST relativities (2) |
Adjusted population (1) x (2) (3) |
Share of adjusted population % (4) |
Share of GST pool $million (5) | |
|---|---|---|---|---|---|
| 2013‑14 | |||||
| NSW | 7,463,711 | 0.96576 | 7,208,154 | 31.0% | 15,727.2 |
| VIC | 5,793,116 | 0.90398 | 5,236,861 | 22.5% | 11,426.1 |
| QLD | 4,696,215 | 1.05624 | 4,960,330 | 21.3% | 10,822.7 |
| WA | 2,554,574 | 0.44581 | 1,138,855 | 4.9% | 2,484.8 |
| SA | 1,677,635 | 1.26167 | 2,116,622 | 9.1% | 4,618.2 |
| TAS | 513,657 | 1.61454 | 829,320 | 3.6% | 1,809.5 |
| ACT | 384,395 | 1.22083 | 469,281 | 2.0% | 1,023.9 |
| NT | 242,149 | 5.31414 | 1,286,814 | 5.5% | 2,807.6 |
| Total | 23,325,452 | na | 23,246,235 | 100.0% | 50,720.0 |
| 2014‑15 | |||||
| NSW | 7,566,847 | 0.97500 | 7,377,676 | 31.2% | 16,758.1 |
| VIC | 5,898,590 | 0.88282 | 5,207,393 | 22.0% | 11,828.4 |
| QLD | 4,789,361 | 1.07876 | 5,166,571 | 21.9% | 11,735.7 |
| WA | 2,638,729 | 0.37627 | 992,875 | 4.2% | 2,255.3 |
| SA | 1,694,049 | 1.28803 | 2,181,986 | 9.2% | 4,956.3 |
| TAS | 514,719 | 1.63485 | 841,488 | 3.6% | 1,911.4 |
| ACT | 391,290 | 1.23600 | 483,634 | 2.0% | 1,098.6 |
| NT | 246,259 | 5.66061 | 1,393,976 | 5.9% | 3,166.4 |
| Total | 23,739,844 | na | 23,645,600 | 100.0% | 53,710.0 |
(a) Amounts shown in 2013‑14 are estimates of each jurisdiction's GST entitlement based on the estimated total GST pool. These amounts do not take into account the prior year balancing adjustment for underpayments made in 2012‑13, totalling $361.0 million, which was paid in 2013‑14.
| $million | NSW | VIC | QLD | WA | SA | TAS | ACT | NT | Total |
|---|---|---|---|---|---|---|---|---|---|
| 2013‑14 | 15,727.2 | 11,426.1 | 10,822.7 | 2,484.8 | 4,618.2 | 1,809.5 | 1,023.9 | 2,807.6 | 50,720.0 |
| 2014‑15 | 16,758.1 | 11,828.4 | 11,735.7 | 2,255.3 | 4,956.3 | 1,911.4 | 1,098.6 | 3,166.4 | 53,710.0 |
| 2015‑16 | 17,552.6 | 12,563.4 | 12,658.8 | 2,348.3 | 5,251.8 | 2,095.2 | 1,165.5 | 3,384.2 | 57,020.0 |
| 2016‑17 | 18,209.4 | 13,231.7 | 13,932.4 | 2,432.1 | 5,698.5 | 2,149.6 | 1,215.4 | 3,571.0 | 60,440.0 |
| 2017‑18 | 19,233.5 | 14,155.6 | 14,660.3 | 2,709.2 | 5,921.3 | 2,202.9 | 1,269.4 | 3,657.7 | 63,810.0 |
(a) Amounts shown in 2013‑14 are estimates of each jurisdiction's GST entitlement based on the estimated total GST pool. These amounts do not take into account the prior year balancing adjustment for underpayments made in 2012‑13, totalling $361.0 million, which was paid in 2013‑14.
Box 3.1: The effect of horizontal fiscal equalisation
It is common for individual States within a federation to have different capacities to raise revenue or deliver services. The practice of equalising revenue capacities and/or expenditure capacities between the States in a federation is common. Australia has had various forms of fiscal equalisation since 1901.
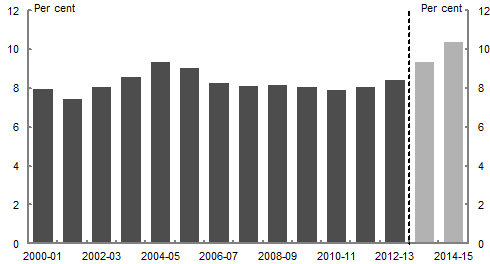
One way to view the degree of horizontal fiscal equalisation is to compare each State's share of the GST entitlement using the GST relativities, with a notional distribution on an equal per capita basis. In 2014‑15, around $5.6 billion (or 10.4 per cent) of the GST entitlement will be redistributed among the States, compared with an equal per capita distribution (Table A).
| GST distribution 2014‑15 Budget $million |
Equal per capita distribution of GST $million |
Redistribution(a) $million |
Projected population '000 |
Per capita redistribution $ |
|
|---|---|---|---|---|---|
| NSW | 16,758.1 | 17,119.5 | -361.5 | 7,567 | -47.8 |
| VIC | 11,828.4 | 13,345.2 | -1,516.8 | 5,899 | -257.2 |
| QLD | 11,735.7 | 10,835.6 | 900.0 | 4,789 | 187.9 |
| WA | 2,255.3 | 5,970.0 | -3,714.7 | 2,639 | -1,407.8 |
| SA | 4,956.3 | 3,832.7 | 1,123.6 | 1,694 | 663.3 |
| TAS | 1,911.4 | 1,164.5 | 746.9 | 515 | 1,451.1 |
| ACT | 1,098.6 | 885.3 | 213.3 | 391 | 545.1 |
| NT | 3,166.4 | 557.1 | 2,609.2 | 246 | 10,595.4 |
| Total | 53,710.0 | 53,710.0 | 5,593.0 | 23,740 |
(a) The total redistribution of $5,593 million is the sum of positive items in that column.
Chart A below shows the proportion of the GST entitlement being redistributed in 2014‑15 and since the GST commenced.
GST administration
States compensate the Commonwealth for the agreed costs incurred by the ATO in administering the GST, including costs incurred by the Australian Customs Service. The GST administration budget for the ATO is estimated to be $692.7 million for 2014‑15, as shown in Table 3.9.
| $million | 2013‑14 | 2014‑15 | 2015‑16 | 2016‑17 | 2017‑18 |
|---|---|---|---|---|---|
| Administration budget at 2013‑14 Budget | 698.6 | 715.0 | 725.4 | 592.4 | na |
| Total parameter variations from 2013‑14 Budget to MYEFO | - | -7.1 | -14.6 | -11.5 | - |
| Administration budget at 2013‑14 MYEFO | 698.6 | 707.9 | 710.8 | 580.9 | na |
| Changes from MYEFO to 2014‑15 Budget | |||||
| Parameter variations | - | -8.4 | -10.1 | -15.8 | - |
| Other variations | - | -6.8 | -6.8 | -5.5 | - |
| Total variations | - | -15.2 | -16.9 | -21.3 | 565.1 |
| Administration budget at 2014‑15 Budget | 698.6 | 692.7 | 693.9 | 559.6 | 565.1 |
| less prior year adjustment | -11.0 | ||||
| equals State government payments | 709.6 | 692.7 | 693.9 | 559.6 | 565.1 |
In 2012‑13, the GST administration payments made by the States were $11 million less than the combination of the total final audited GST administration cost for 2012‑13 and the States' 2011‑12 net underpayment. This underpayment was added to the estimated administration costs of $698.6 million for 2013‑14.
Other general revenue assistance
The Commonwealth makes payments of other general revenue assistance to the States, including:
- payments to the Australian Capital Territory for municipal services;
- compensation for reduced royalties;
- royalties; and
- Snowy Hydro Limited tax compensation.
Similar to GST, other general revenue assistance is provided to the States without conditions, to spend according to their own budget priorities. These payments are detailed below.
| $million | 2013‑14 | 2014‑15 | 2015‑16 | 2016‑17 | 2017‑18 |
|---|---|---|---|---|---|
| ACT municipal services | 37.3 | 38.0 | 38.6 | 39.3 | 40.0 |
| Reduced royalties | 72.8 | 54.9 | 56.9 | 61.5 | 56.2 |
| Royalties | 1,149.7 | 983.5 | 974.5 | 981.8 | 928.2 |
| Snowy Hydro Limited tax compensation | 76.0 | 75.0 | 75.0 | 75.0 | 75.0 |
| Total other general revenue assistance | 1,335.8 | 1,151.4 | 1,145.1 | 1,157.6 | 1,099.4 |
| $million | NSW | VIC | QLD | WA | SA | TAS | ACT | NT | Total |
|---|---|---|---|---|---|---|---|---|---|
| 2013‑14 | - | - | - | - | - | - | 37.3 | - | 37.3 |
| 2014‑15 | - | - | - | - | - | - | 38.0 | - | 38.0 |
| 2015‑16 | - | - | - | - | - | - | 38.6 | - | 38.6 |
| 2016‑17 | - | - | - | - | - | - | 39.3 | - | 39.3 |
| 2017‑18 | - | - | - | - | - | - | 40.0 | - | 40.0 |
The Commonwealth provides general revenue assistance to the Australian Capital Territory to assist meeting the additional municipal costs which arise from Canberra's role as the national capital; and to compensate the Australian Capital Territory for additional costs resulting from the national capital planning influences on the provision of water and sewerage services.
The level of funding is based upon the findings of the Commonwealth Grants Commission, in its second and third reports on financing for the Australian Capital Territory, prior to the move to self‑government in 1989.
| $million | NSW | VIC | QLD | WA | SA | TAS | ACT | NT | Total |
|---|---|---|---|---|---|---|---|---|---|
| 2013‑14 | - | - | - | 72.8 | - | - | - | - | 72.8 |
| 2014‑15 | - | - | - | 54.9 | - | - | - | - | 54.9 |
| 2015‑16 | - | - | - | 56.9 | - | - | - | - | 56.9 |
| 2016‑17 | - | - | - | 61.5 | - | - | - | - | 61.5 |
| 2017‑18 | - | - | - | 56.2 | - | - | - | - | 56.2 |
The Commonwealth provides general revenue assistance to compensate Western Australia for the loss of royalty revenue resulting from the removal of the exemption of condensate from crude oil excise in the 2009‑10 Budget.
| $million | NSW | VIC | QLD | WA | SA | TAS | ACT | NT | Total |
|---|---|---|---|---|---|---|---|---|---|
| 2013‑14 | - | - | - | nfp | - | - | - | nfp | 1,149.7 |
| 2014‑15 | - | - | - | nfp | - | - | - | nfp | 983.5 |
| 2015‑16 | - | - | - | nfp | - | - | - | nfp | 974.5 |
| 2016‑17 | - | - | - | nfp | - | - | - | nfp | 981.8 |
| 2017‑18 | - | - | - | nfp | - | - | - | nfp | 928.2 |
(a) State splits for royalties are not published due to commercial sensitivities.
Royalty payments to Western Australia
The Commonwealth provides general revenue assistance to Western Australia from royalties collected under the Offshore Petroleum (Royalty) Act 2006 in respect of the North West Shelf oil and gas project off the coast of Western Australia. The Commonwealth collects these royalties because it has jurisdiction over offshore areas.
These royalties are shared between the Commonwealth (approximately one third) and Western Australia (approximately two thirds). These payment arrangements are in accordance with the revenue sharing arrangements in section 75 of the Offshore Petroleum and Greenhouse Gas Storage Act 2006.
Royalty payments to the Northern Territory
The Commonwealth provides general revenue assistance to the Northern Territory in lieu of royalties on uranium mining in the Ranger Project Area, due to the Commonwealth's ownership of uranium in the Northern Territory.
General revenue assistance is payable biannually at the royalty rate of 1.25 per cent of the net proceeds of sales. These royalties are paid under a continuing agreement established under the 1978 Memorandum of Understanding between the Commonwealth and the Northern Territory.
| $million | NSW | VIC | QLD | WA | SA | TAS | ACT | NT | Total |
|---|---|---|---|---|---|---|---|---|---|
| 2013‑14 | 50.7 | 25.3 | - | - | - | - | - | - | 76.0 |
| 2014‑15 | 50.0 | 25.0 | - | - | - | - | - | - | 75.0 |
| 2015‑16 | 50.0 | 25.0 | - | - | - | - | - | - | 75.0 |
| 2016‑17 | 50.0 | 25.0 | - | - | - | - | - | - | 75.0 |
| 2017‑18 | 50.0 | 25.0 | - | - | - | - | - | - | 75.0 |
On 28 June 2002, the Snowy Mountains Hydro Electric Authority was corporatised. The assets and business of the Authority were transferred to Snowy Hydro Limited, a company jointly owned by the Commonwealth, New South Wales and Victoria (with 13 per cent, 58 per cent and 29 per cent shareholdings respectively).
The Commonwealth provides compensation payments to New South Wales and Victoria, in the form of general revenue assistance, for Commonwealth income taxes paid by Snowy Hydro Limited in proportion to the States' shareholdings.
Payments are made in accordance with the Snowy Hydro Tax Compensation Deed between the Commonwealth, New South Wales and Victoria. These taxes would have previously been payable to the States through tax equivalence regime payments.
Mirror tax arrangements
The Commonwealth introduced mirror tax arrangements in 1998 to ensure that the States were not financially disadvantaged by the High Court decision in Allders International Pty Ltd v Commissioner of State Revenue (Victoria), which invalidated state taxes on Commonwealth places. These arrangements mirror certain state taxes, including payroll taxes, land taxes and stamp duties, with respect to Commonwealth places. The States collect these mirror taxes on behalf of the Commonwealth and bear the administrative costs of collection. All mirror tax revenues are credited to the Commonwealth and simultaneously appropriated to the States. Hence, mirror taxes are recorded as both a Commonwealth revenue and expense, with no net impact on the Commonwealth's budget position, as shown in Table 3.11.
| $million | 2013‑14 | 2014‑15 | 2015‑16 | 2016‑17 | 2017‑18 |
|---|---|---|---|---|---|
| Mirror taxes | 508.4 | 524.3 | 559.8 | 593.2 | 615.7 |
| less Payments to State governments | 508.4 | 524.3 | 559.8 | 593.2 | 615.7 |
| Commonwealth Budget impact | - | - | - | - | - |