


Part 3: Fiscal Strategy and Outlook (continued)
Fiscal Outlook
Budget aggregates
An underlying cash deficit of $40.4 billion (2.5 per cent of GDP) is expected in 2014‑15, improving to a deficit of $11.5 billion (0.6 per cent of GDP) in 2017‑18.
A headline cash deficit of $43.9 billion (2.7 per cent of GDP) is expected in 2014‑15, improving to a deficit of $21.7 billion (1.2 per cent of GDP) in 2017‑18.
In accrual terms, a fiscal deficit of $39.8 billion (2.5 per cent of GDP) is expected in 2014‑15, improving to a deficit of $5.0 billion (0.3 per cent of GDP) in 2017‑18.
Table 3.5 provides key budget aggregates for the Australian Government general government sector.
| Estimates | |||||
|---|---|---|---|---|---|
| 2014‑15 | 2015‑16 | Budget | MYEFO | Budget | MYEFO |
| $b | $b | $b | $b | ||
| Receipts | 385.8 | 379.5 | 410.4 | 403.4 | |
| Per cent of GDP | 23.6 | 23.6 | 24.0 | 24.0 | |
| Payments(a) | 412.5 | 416.5 | 424.2 | 431.1 | |
| Per cent of GDP | 25.3 | 25.9 | 24.8 | 25.7 | |
| Net Future Fund earnings | 3.1 | 3.3 | 3.3 | 3.5 | |
| Underlying cash balance(b) | -29.8 | -40.4 | -17.1 | -31.2 | |
| Per cent of GDP | -1.8 | -2.5 | -1.0 | -1.9 | |
| Revenue | 391.3 | 385.9 | 419.6 | 411.7 | |
| Per cent of GDP | 24.0 | 24.0 | 24.5 | 24.5 | |
| Expenses | 414.8 | 422.9 | 431.1 | 436.5 | |
| Per cent of GDP | 25.4 | 26.3 | 25.2 | 26.0 | |
| Net operating balance | -23.5 | -37.0 | -11.5 | -24.8 | |
| Net capital investment | 2.4 | 2.8 | 0.7 | 2.4 | |
| Fiscal balance | -25.9 | -39.8 | -12.2 | -27.2 | |
| Per cent of GDP | -1.6 | -2.5 | -0.7 | -1.6 | |
| Memorandum item: | |||||
| Headline cash balance | -33.5 | -43.9 | -26.6 | -41.9 | |
| Projections | |||||
| 2016‑17 | 2017‑18 | ||||
| Budget | MYEFO | Budget | MYEFO | ||
| $b | $b | $b | $b | ||
| Receipts | 436.8 | 429.2 | 468.0 | 459.8 | |
| Per cent of GDP | 24.4 | 24.3 | 24.9 | 24.8 | |
| Payments(a) | 443.9 | 446.4 | 467.1 | 467.4 | |
| Per cent of GDP | 24.7 | 25.3 | 24.8 | 25.2 | |
| Net Future Fund earnings | 3.5 | 3.7 | 3.8 | 3.9 | |
| Underlying cash balance(b) | -10.6 | -20.8 | -2.8 | -11.5 | |
| Per cent of GDP | -0.6 | -1.2 | -0.2 | -0.6 | |
| Revenue | 449.8 | 441.0 | 480.4 | 473.2 | |
| Per cent of GDP | 25.1 | 25.0 | 25.5 | 25.5 | |
| Expenses | 453.8 | 456.1 | 475.4 | 475.3 | |
| Per cent of GDP | 25.3 | 25.8 | 25.3 | 25.6 | |
| Net operating balance | -4.0 | -15.1 | 4.9 | -2.1 | |
| Net capital investment | 2.6 | 2.7 | 4.0 | 2.9 | |
| Fiscal balance | -6.6 | -17.8 | 1.0 | -5.0 | |
| Per cent of GDP | -0.4 | -1.0 | 0.1 | -0.3 | |
| Memorandum item: | |||||
| Headline cash balance | -22.7 | -34.2 | -11.4 | -21.7 | |
(a) Equivalent to cash payments for operating activities, purchase of non‑financial assets and net acquisition of assets under finance leases.
(b) Excludes expected net Future Fund earnings.
Underlying cash balance estimates
| Estimates | |||||
|---|---|---|---|---|---|
| 2014‑15 | 2015‑16 | ||||
| Budget | MYEFO | Budget | MYEFO | ||
| $b | $b | $b | $b | ||
| Cash receipts | |||||
| Operating cash receipts | 383.5 | 377.3 | 407.7 | 400.7 | |
| Capital cash receipts(a) | 2.2 | 2.2 | 2.7 | 2.7 | |
| Total cash receipts | 385.8 | 379.5 | 410.4 | 403.4 | |
| Cash payments | |||||
| Operating cash payments | 401.7 | 405.1 | 414.4 | 420.7 | |
| Capital cash payments(b) | 10.8 | 11.4 | 9.8 | 10.3 | |
| Total cash payments | 412.5 | 416.5 | 424.2 | 431.1 | |
| Finance leases and similar arrangements(c) | 0.0 | 0.0 | 0.0 | 0.0 | |
| GFS cash surplus(+)/deficit(-) | -26.7 | -37.0 | -13.8 | -27.7 | |
| Per cent of GDP | -1.6 | -2.3 | -0.8 | -1.7 | |
| less Net Future Fund earnings | 3.1 | 3.3 | 3.3 | 3.5 | |
| Underlying cash balance(d) | -29.8 | -40.4 | -17.1 | -31.2 | |
| Per cent of GDP | -1.8 | -2.5 | -1.0 | -1.9 | |
| Memorandum items: | |||||
| Net cash flows from investments in financial assets for policy purposes | -6.8 | -6.8 | -12.8 | -14.2 | |
| plus Net Future Fund earnings | 3.1 | 3.3 | 3.3 | 3.5 | |
| Headline cash balance | -33.5 | -43.9 | -26.6 | -41.9 | |
| Projections | |||||
| 2016‑17 | 2017‑18 | ||||
| Budget | MYEFO | Budget | MYEFO | ||
| $b | $b | $b | $b | ||
| Cash receipts | |||||
| Operating cash receipts | 436.6 | 429.0 | 467.8 | 459.6 | |
| Capital cash receipts(a) | 0.2 | 0.2 | 0.2 | 0.2 | |
| Total cash receipts | 436.8 | 429.2 | 468.0 | 459.8 | |
| Cash payments | |||||
| Operating cash payments | 434.5 | 436.6 | 456.1 | 455.8 | |
| Capital cash payments(b) | 9.4 | 9.8 | 11.0 | 11.6 | |
| Total cash payments | 443.9 | 446.4 | 467.1 | 467.4 | |
| Finance leases and similar arrangements(c) | 0.0 | 0.0 | 0.0 | 0.0 | |
| GFS cash surplus(+)/deficit(-) | -7.1 | -17.2 | 0.9 | -7.6 | |
| Per cent of GDP | -0.4 | -1.0 | 0.0 | -0.4 | |
| less Net Future Fund earnings | 3.5 | 3.7 | 3.8 | 3.9 | |
| Underlying cash balance(d) | -10.6 | -20.8 | -2.8 | -11.5 | |
| Per cent of GDP | -0.6 | -1.2 | -0.2 | -0.6 | |
| Memorandum items: | |||||
| Net cash flows from investments in financial assets for policy purposes | -15.6 | -17.1 | -12.4 | -14.1 | |
| plus Net Future Fund earnings | 3.5 | 3.7 | 3.8 | 3.9 | |
| Headline cash balance | -22.7 | -34.2 | -11.4 | -21.7 | |
(a) Equivalent to cash receipts from the sale of non‑financial assets in the cash flow statement.
(b) Equivalent to cash payments for purchases of non‑financial assets in the cash flow statement.
(c) The acquisition of assets under finance leases decreases the underlying cash balance. The disposal of assets previously held under finance leases increases the underlying cash balance.
(d) Excludes expected net Future Fund earnings.
The 2014‑15 underlying cash deficit is expected to be $10.6 billion larger than forecast in the 2014‑15 Budget, but $8.1 billion lower than the deficit of $48.5 billion reported for 2013‑14.
Since the 2014‑15 Budget, total policy decisions have had a negative impact on the underlying cash position of $2.3 billion in 2014‑15 and $4.1 billion over the forward estimates. Setting aside the impact of Senate negotiations, policy decisions have improved the underlying cash balance by $3.2 billion over the forward estimates.
Since the 2014‑15 Budget, total parameter and other variations have had a negative impact on the underlying cash position of $8.3 billion in 2014‑15 and $39.6 billion over the forward estimates.
| Estimates | Projections | ||||||
|---|---|---|---|---|---|---|---|
| 2014‑15 | 2015‑16 | 2016‑17 | 2017‑18 | Total | |||
| $m | $m | $m | $m | $m | |||
| 2014‑15 Budget underlying cash balances(a) | -29,773 | -17,084 | -10,562 | -2,825 | -60,244 | ||
| Per cent of GDP | -1.8 | -1.0 | -0.6 | -0.2 | |||
| Changes from 2014‑15 Budget to 2014‑15 MYEFO | |||||||
| Effect of policy decisions(b)(c) | |||||||
| Receipts | -486 | -350 | -105 | -140 | -1,082 | ||
| Payments | 1,827 | 1,844 | 396 | -1,090 | 2,977 | ||
| Total policy decisions impact on underlying cash balance | -2,314 | -2,195 | -501 | 950 | -4,059 | ||
| Effect of parameter and other variations(c) | |||||||
| Receipts | -5,809 | -6,714 | -7,515 | -8,040 | -28,078 | ||
| Payments | 2,215 | 4,985 | 2,111 | 1,392 | 10,703 | ||
| less Net Future Fund earnings | 252 | 261 | 154 | 174 | 841 | ||
| Total parameter and other variations impact on underlying cash balance | -8,275 | -11,960 | -9,781 | -9,606 | -39,622 | ||
| 2014‑15 MYEFO underlying cash balance(a) | -40,362 | -31,239 | -20,844 | -11,480 | -103,925 | ||
| Per cent of GDP | -2.5 | -1.9 | -1.2 | -0.6 | |||
(a) Excludes expected net Future Fund earnings.
(b) Excludes secondary impacts on public debt interest of policy decisions and offsets from the Contingency Reserve for decisions taken.
(c) A positive number for receipts indicates an increase in the underlying cash balance, while a positive number for payments indicates a decrease in the underlying cash balance.
Further details of the impact of policy decisions and major variations arising from parameter and other variations on the fiscal outlook are provided in the receipt estimates and payment estimates sections below.
Receipts estimates
Total receipts are expected to be $6.3 billion lower in 2014‑15 than estimated at the 2014‑15 Budget. Tax receipts are $6.8 billion lower and non‑tax receipts are $482 million higher.
Since the 2014‑15 Budget, total receipts have been revised down by $1.1 billion over the forward estimates as a result of new policy decisions, and revised down by $28.1 billion over the forward estimates due to parameter and other variations.
| Estimates | Change on Budget | |||||
|---|---|---|---|---|---|---|
| Budget | MYEFO | |||||
| $m | $m | $m | % | |||
| Individuals and other withholding taxes | ||||||
| Gross income tax withholding | 169,400 | 166,700 | -2,700 | -1.6 | ||
| Gross other individuals | 37,100 | 37,300 | 200 | 0.5 | ||
| less: Refunds | 27,700 | 27,500 | -200 | -0.7 | ||
| Total individuals and other withholding tax | 178,800 | 176,500 | -2,300 | -1.3 | ||
| Fringe benefits tax | 4,360 | 4,350 | -10 | -0.2 | ||
| Company tax | 71,600 | 68,960 | -2,640 | -3.7 | ||
| Superannuation fund taxes | 7,680 | 7,040 | -640 | -8.3 | ||
| Minerals resource rent tax(a) | 0 | 60 | 60 | - | ||
| Petroleum resource rent tax | 1,950 | 1,890 | -60 | -3.1 | ||
| Income taxation receipts | 264,390 | 258,800 | -5,590 | -2.1 | ||
| Goods and services tax | 53,978 | 53,982 | 4 | 0.0 | ||
| Wine equalisation tax | 780 | 800 | 20 | 2.6 | ||
| Luxury car tax | 360 | 400 | 40 | 11.1 | ||
| Excise and customs duty | ||||||
| Petrol | 5,950 | 5,950 | 0 | 0.0 | ||
| Diesel | 9,250 | 8,930 | -320 | -3.5 | ||
| Other fuel products | 3,710 | 3,260 | -450 | -12.1 | ||
| Tobacco | 8,710 | 8,310 | -400 | -4.6 | ||
| Beer | 2,400 | 2,410 | 10 | 0.4 | ||
| Spirits | 1,930 | 1,970 | 40 | 2.1 | ||
| Other alcoholic beverages(b) | 980 | 950 | -30 | -3.1 | ||
| Other customs duty | ||||||
| Textiles, clothing and footwear | 600 | 590 | -10 | -1.7 | ||
| Passenger motor vehicles | 820 | 800 | -20 | -2.4 | ||
| Other imports | 1,650 | 1,570 | -80 | -4.8 | ||
| less: Refunds and drawbacks | 360 | 420 | 60 | 16.7 | ||
| Total excise and customs duty | 35,640 | 34,320 | -1,320 | -3.7 | ||
| Carbon pricing mechanism | 1,695 | 1,800 | 105 | 6.2 | ||
| Agricultural levies | 469 | 454 | -15 | -3.2 | ||
| Other taxes | 3,059 | 3,038 | -21 | -0.7 | ||
| Indirect taxation receipts | 95,982 | 94,794 | -1,187 | -1.2 | ||
| Taxation receipts | 360,372 | 353,594 | -6,777 | -1.9 | ||
| Sales of goods and services | 8,910 | 9,114 | 204 | 2.3 | ||
| Interest received | 3,657 | 3,469 | -188 | -5.1 | ||
| Dividends | 4,257 | 3,831 | -426 | -10.0 | ||
| Other non-taxation receipts | 8,583 | 9,475 | 892 | 10.4 | ||
| Non-taxation receipts | 25,407 | 25,889 | 482 | 1.9 | ||
| Total receipts | 385,778 | 379,483 | -6,295 | -1.6 | ||
| Memorandum: | ||||||
| Total excise | 26,370 | 25,260 | -1,110 | -4.2 | ||
| Total customs duty | 9,270 | 9,060 | -210 | -2.3 | ||
| Capital gains tax(c) | 9,000 | 8,900 | -100 | -1.1 | ||
| Medicare and DisabilityCare Australia levy | 14,160 | 14,130 | -30 | -0.2 | ||
(a) Net receipts from the MRRT are expected to be around $40 million in 2014‑15 which represents the net receipts impact across different revenue heads. These include the offsetting reductions in company tax (through deductibility) and interactions with other taxes. The Government has announced the MRRT will not apply beyond 30 September 2014.
(b) Other alcoholic beverages are those not exceeding 10 per cent by volume of alcohol (excluding beer, brandy and wine).
(c) Capital gains tax is part of gross other individuals, company tax and superannuation fund taxes.
| Estimates | Change on Budget | |||||
|---|---|---|---|---|---|---|
| Budget | MYEFO | |||||
| $m | $m | $m | % | |||
| Individuals and other withholding taxes | ||||||
| Gross income tax withholding | 181,500 | 178,800 | -2,700 | -1.5 | ||
| Gross other individuals | 40,700 | 41,100 | 400 | 1.0 | ||
| less: Refunds | 28,600 | 28,100 | -500 | -1.7 | ||
| Total individuals and other withholding tax | 193,600 | 191,800 | -1,800 | -0.9 | ||
| Fringe benefits tax | 4,930 | 4,890 | -40 | -0.8 | ||
| Company tax | 75,400 | 70,800 | -4,600 | -6.1 | ||
| Superannuation fund taxes | 10,380 | 9,630 | -750 | -7.2 | ||
| Minerals resource rent tax | 0 | 0 | 0 | - | ||
| Petroleum resource rent tax | 1,900 | 1,700 | -200 | -10.5 | ||
| Income taxation receipts | 286,210 | 278,820 | -7,390 | -2.6 | ||
| Goods and services tax | 57,290 | 57,468 | 178 | 0.3 | ||
| Wine equalisation tax | 810 | 830 | 20 | 2.5 | ||
| Luxury car tax | 310 | 360 | 50 | 16.1 | ||
| Excise and customs duty | ||||||
| Petrol | 6,150 | 6,150 | 0 | 0.0 | ||
| Diesel | 9,610 | 9,340 | -270 | -2.8 | ||
| Other fuel products | 3,510 | 3,150 | -360 | -10.3 | ||
| Tobacco | 9,640 | 9,560 | -80 | -0.8 | ||
| Beer | 2,470 | 2,470 | 0 | 0.0 | ||
| Spirits | 1,980 | 2,030 | 50 | 2.5 | ||
| Other alcoholic beverages(a) | 1,010 | 990 | -20 | -2.0 | ||
| Other customs duty | ||||||
| Textiles, clothing and footwear | 430 | 310 | -120 | -27.9 | ||
| Passenger motor vehicles | 610 | 520 | -90 | -14.8 | ||
| Other imports | 1,680 | 1,070 | -610 | -36.3 | ||
| less: Refunds and drawbacks | 360 | 420 | 60 | 16.7 | ||
| Total excise and customs duty | 36,730 | 35,170 | -1,560 | -4.2 | ||
| Carbon pricing mechanism | 0 | 0 | 0 | - | ||
| Agricultural levies | 474 | 478 | 4 | 0.8 | ||
| Other taxes | 3,462 | 3,477 | 15 | 0.4 | ||
| Indirect taxation receipts | 99,076 | 97,784 | -1,293 | -1.3 | ||
| Taxation receipts | 385,286 | 376,604 | -8,683 | -2.3 | ||
| Sales of goods and services | 9,121 | 9,202 | 81 | 0.9 | ||
| Interest received | 3,893 | 4,022 | 129 | 3.3 | ||
| Dividends | 2,461 | 3,407 | 946 | 38.4 | ||
| Other non-taxation receipts | 9,665 | 10,128 | 463 | 4.8 | ||
| Non-taxation receipts | 25,141 | 26,759 | 1,618 | 6.4 | ||
| Total receipts | 410,427 | 403,362 | -7,065 | -1.7 | ||
| Memorandum: | ||||||
| Total excise | 27,300 | 26,860 | -440 | -1.6 | ||
| Total customs duty | 9,430 | 8,310 | -1,120 | -11.9 | ||
| Capital gains tax(b) | 12,000 | 11,300 | -700 | -5.8 | ||
| Medicare and DisabilityCare Australia levy | 15,160 | 15,040 | -120 | -0.8 | ||
(a) Other alcoholic beverages are those not exceeding 10 per cent by volume of alcohol (excluding beer, brandy and wine).
(b) Capital gains tax is part of gross other individuals, company tax and superannuation fund taxes.
Policy decisions
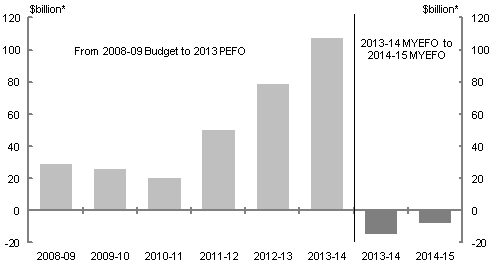
Policy decisions since the 2014‑15 Budget have reduced total receipts by $486 million in 2014‑15 and reduced total receipts by $1.1 billion over the forward estimates period, driven by the reduction in revenue associated with the Japan‑Australia Economic Partnership Agreement signed on 8 July 2014.
The Government is committed to simplifying the tax system and lowering the tax burden on individuals and business. Revenue decisions taken by this Government, up to and including the 2014‑15 MYEFO, have reduced revenue by $7.4 billion in accrual terms compared with decisions taken by the former Government.
*Cumulative value of revenue measures taken each budget year.
Parameter and other variations
Parameter and other variations have reduced total receipts since the 2014‑15 Budget by $5.8 billion in 2014‑15 and $28.1 billion over the forward estimates period.
Parameter and other variations have reduced tax receipts since the 2014‑15 Budget by $6.2 billion in 2014‑15 and $31.6 billion over the forward estimates period.
The 2014‑15 Budget made provisions for a number of measures that were still subject to finalisation at the time. The provision for the Japan‑Australia Economic Partnership Agreement has now been removed as this measure is included in the 2014‑15 MYEFO.
The 2014‑15 MYEFO includes a new provision for the China‑Australia Free Trade Agreement. As is standard practice, a measure will be published once the agreement has been formally signed.
The key economic parameters that influence tax receipts and tax revenue are shown in Table 3.10. The table shows effects on the Australian Government's main tax bases of the changed circumstances and outlook since the 2014‑15 Budget.
| Outcome | Estimates | Projections | |||||
|---|---|---|---|---|---|---|---|
| 2013‑14 | 2014‑15 | 2015‑16 | 2016‑17 | 2017‑18 | |||
| % | % | % | % | % | |||
| Revenue parameters at 2014‑15 MYEFO | |||||||
| Nominal gross domestic product | 4.0 | 1 1/2 | 4 1/2 | 5 1/4 | 5 1/4 | ||
| Change since 2014‑15 Budget | 0.1 | -1 1/2 | - 1/4 | 1/4 | 1/4 | ||
| Compensation of employees(b) | 2.9 | 3 1/2 | 4 1/4 | 4 3/4 | 5 1/4 | ||
| Change since 2014‑15 Budget | -0.4 | - 3/4 | 0 | - 1/2 | 0 | ||
| Corporate gross operating surplus(c) | 5.9 | -3 1/4 | 4 1/4 | 6 | 5 1/2 | ||
| Change since 2014‑15 Budget | 0.7 | -3 3/4 | - 3/4 | 2 | 1 1/4 | ||
| Unincorporated business income | 1.4 | 3 1/2 | 2 3/4 | 3 | 3 1/2 | ||
| Change since 2014‑15 Budget | 0.1 | 2 1/4 | 0 | -2 | -1 1/2 | ||
| Property income(d) | 2.9 | 5 1/2 | 9 1/4 | 5 1/4 | 5 1/4 | ||
| Change since 2014‑15 Budget | -7.6 | -3 1/4 | -3 | 1/4 | 1/4 | ||
| Consumption subject to GST | 4.0 | 4 | 5 3/4 | 5 1/4 | 5 1/2 | ||
| Change since 2014‑15 Budget | -0.5 | - 3/4 | 1/2 | - 1/4 | - 1/4 | ||
(a) Current prices, per cent change on previous year. Changes since the 2014‑15 Budget are percentage points and may not reconcile due to rounding.
(b) Compensation of employees measures total remuneration earned by employees.
(c) Corporate gross operating surplus is an Australian National Accounts measure of company profits, gross of depreciation.
(d) Property income measures income derived from rent, dividends and interest.
Tax receipts have been affected by the weaker outlook for nominal GDP. In particular, the downward revisions to forecasts of commodity prices have resulted in downward revisions to mining profits which have been partly offset by an improved outlook for the non‑mining economy.
Excluding policy decisions, company tax has been revised down by $2.3 billion (3.2 per cent) in 2014‑15, $4.6 billion (6.0 per cent) in 2015‑16 and $14.4 billion over the forward estimates. Of this write‑down, the impact of the sharper‑than‑anticipated fall in commodity prices, particularly the iron ore price, is around $18 billion, partly offset by the improved outlook for the non‑mining economy which has increased expected company tax by around $4 billion over the four years to 2017‑18. In addition, the lower forecast for oil prices is consistent with petroleum resource rent tax being revised down by $760 million over the four years to 2017‑18.
Further, revisions to employment and wage growth have resulted in taxes from individuals being revised down by $2.3 billion (1.3 per cent) in 2014‑15 and $8.6 billion over the four years to 2017‑18.
Excise and excise equivalent customs duty has been revised down by $1.1 billion in 2014‑15 and $3.3 billion over the forward estimates, mostly as a result of lower expected fuel excise collections.
Analysis of the sensitivity of the receipts estimates to changes in the economic outlook is provided in Attachment A to this part.
Payment estimates
Since the 2014‑15 Budget, estimated cash payments for 2014‑15 have increased by $4.0 billion, reflecting increased payments due to new policy decisions of $1.8 billion, and increased payments due to parameter and other variations of $2.2 billion.
Policy decisions
The net impact of policy decisions since the 2014‑15 Budget is expected to increase payments by $1.8 billion in 2014‑15, $1.8 billion in 2015‑16, $0.4 billion in 2016‑17 and decrease payments by $1.1 billion in 2017‑18. These decisions include:
- a range of measures associated with securing the passage of legislation to repeal the Minerals Resource Rent Tax, which is expected to increase cash payments by $1.7 billion in 2014‑15 ($6.6 billion over four years). Measures include continuing the Income Support Bonus and the Schoolkids Bonus until 31 December 2016 and delaying the repeal date of the Low Income Super Contributions scheme from 1 July 2013 to 1 July 2017;
- commencing Operation Okra, which is expected to increase cash payments by $261 million in 2014‑15 ($298 million over four years). Operation Okra is the Australian Defence Force's contribution to the international effort to disrupt and degrade the Islamic State in Iraq and the Levant threat in Iraq;
- additional funding to agencies involved in counter‑terrorism activity by providing resources and legislative powers to combat the terrorism threat, which is expected to increase cash payments by $142 million in 2014‑15 ($650 million over four years); and
- enhanced security at the Australian Parliament House, which is expected to increase cash payments by $131 million in 2014‑15 ($199 million over four years).
The impact of these policy decisions is largely offset over the four years to 2017‑18 by a number of decisions that have reduced cash payments, including:
- returning the level of Official Development Assistance (ODA) spending in real terms to the levels that applied when ODA was last funded from budget surpluses rather than debt, and then growing ODA in line with the Consumer Price Index. This measure is expected to reduce cash payments by $3.7 billion over four years;
- preserving the policy intent of the 2014‑15 Budget measure to maintain eligibility thresholds for allowances and Family Tax Benefit payment rates, by extending the end date to 1 July 2018 and 1 July 2017 respectively, as legislation was not passed in time for the start date outlined in the Budget. This measure is expected to reduce cash payments by $852 million over four years; and
- accommodating the legacy caseload of Illegal Maritime Arrivals (IMAs) in Australia in the community rather than in detention centres, where possible, while an individual's protection status is being resolved. This measure is expected to reduce cash payments by $384 million in 2014‑15 ($412 million over four years).
Parameter and other variations
Parameter and other variations since the 2014‑15 Budget have increased payments by $2.2 billion in 2014‑15 and $10.7 billion over the four years to 2017‑18.
Major increases in cash payments in 2014‑15 and over the four years to 2017‑18 as a result of parameter and other variations since the 2014‑15 Budget include:
- payments related to Family Tax Benefit, which are expected to increase by $404 million in 2014‑15 ($3.2 billion over four years), largely reflecting the impact of lower than expected wage growth driving up average payment rates and recipient numbers;
- child care rebate and benefit payments, which are expected to increase by $219 million in 2014‑15 ($2.4 billion over four years), largely reflecting higher than expected utilisation of demand driven child care services, both in terms of number of children in childcare and hours claimed, and higher than expected fees;
- payments related to Illegal Maritime Arrival (IMA) management costs, which are expected to increase by $376 million in 2014‑15 (although a reduction in payments of $209 million is expected over the three years to 2017‑18), largely reflecting the impact of slower than forecast processing of refugee claims in offshore facilities and updated estimates of the distribution of IMAs across the detention network;
- payments relating to the provision of Goods and Services Tax (GST) to the States and Territories, which are expected to increase by $370 million in 2014‑15, reflecting expenses accrued in 2013‑14 and paid in the 2014‑15 financial year;
- payments for government and non‑government schools, which are expected to increase by $313 million in 2014‑15 ($878 million over four years), largely reflecting higher than expected enrolment data and consequential changes in the Commonwealth share of base funding;
- Private Health Insurance rebates, which are expected to increase by $129 million in 2014‑15 ($606 million over four years), reflecting higher than expected growth in the number of people with subsidised health cover and a greater proportion of policy holders over 65 who attract a higher rebate;
- payments to hospitals in respect of veterans' services, which are expected to increase by $85 million in 2014‑15 ($253 million over four years), reflecting higher than expected costs for hospital services provided to veterans and the timing of cash payments; and
- payments for employment services, which are expected to increase by $74 million in 2014‑15, largely reflecting higher than expected payments from the Employment Pathway Fund and outcome payments to employment service providers.
Major reductions in cash payments in 2014‑15 and over the four years to 2017‑18 as a result of parameter and other variations since the 2014‑15 Budget, include:
- payments related to Natural Disaster Relief and Recovery Arrangements, which are expected to decrease by $1.8 billion in 2014‑15 and increase by $1.2 billion in 2015‑16, largely reflecting updated advice from Queensland that delays the timing of payments and includes an overall reduction of around $600 million in Commonwealth payments. Updated estimates also include counter‑disaster measures associated with the January 2014 bushfires in Victoria and higher than expected reconstruction costs relating to natural disasters in New South Wales;
- payments under the Low Income Superannuation Contribution (LISC) scheme, which are expected to decrease by $162 million in 2014‑15 ($629 million over four years), reflecting lower than expected LISC scheme recipients;
- payments under the Job Seeker Income Support programme, which are expected to decrease by $131 million in 2014‑15 ($517 million over four years), reflecting lower than expected customer numbers and average payment rates;
- payments under the Residential and Flexible Care programme, which are expected to decrease by $79 million in 2014‑15 ($184 million over four years), reflecting lower than expected operational residential aged care places for approved care recipients;
- payments under the Commonwealth Grant
sScheme, which are expected to decrease by $78 million in 2014‑15 ($495 million over four years), reflecting a moderation in the rate of enrolments after a period of rapid growth following the introduction of the demand driven system in 2012; - payments to permit holders for the redemption of free carbon permits under the Carbon Price Mechanism buy‑back facility, which are expected to decrease by $75 million in 2014‑15, reflecting lower than expected utilisation of the buy‑back facility;
- payments to public hospitals, which are expected to decrease by $941 million over four years to 2017‑18 (although an increase in payments of $224 million is expected in 2014‑15), reflecting lower than expected National Efficient Price projections partly ameliorated by higher activity estimates; and
- royalty payments relating to general revenue assistance, which are expected to decrease by $161 million over four years (although an increase in payments of $10 million is expected in 2014‑15), reflecting reduced pricing assumptions for commodities.
Consistent with previous budgets, the underlying cash balance has been improved by the regular draw down of the conservative bias allowance. Details of this draw down are provided at Attachment D.
Analysis of the sensitivity of the payments estimates to changes in the economic outlook is provided in Attachment A to this part.
Fiscal balance estimates
Compared with the 2014‑15 Budget, the fiscal balance is expected to be $14.0 billion lower for 2014‑15, and $46.2 billion lower over the forward estimates period.
Table 3.11 provides a reconciliation of fiscal balance estimates, including the impact of policy decisions and parameter and other variations on revenue, expense and net capital investment.
| Estimates | Projections | ||||||
|---|---|---|---|---|---|---|---|
| 2014‑15 | 2015‑16 | 2016‑17 | 2017‑18 | Total | |||
| $m | $m | $m | $m | $m | |||
| 2014‑15 Budget fiscal balance | -25,855 | -12,214 | -6,596 | 984 | -43,681 | ||
| Per cent of GDP | -1.6 | -0.7 | -0.4 | 0.1 | |||
| Changes from 2014‑15 Budget to 2014‑15 MYEFO | |||||||
| Effect of policy decisions(a)(b) | |||||||
| Revenue | -458 | -545 | -312 | -447 | -1,762 | ||
| Expenses | 2,802 | 2,288 | 253 | -1,418 | 3,925 | ||
| Net capital investment | 135 | 81 | 53 | 24 | 294 | ||
| Total policy decisions impact on fiscal balance | -3,395 | -2,914 | -618 | 946 | -5,981 | ||
| Effect of parameter and other variations(b) | |||||||
| Revenue | -5,014 | -7,385 | -8,492 | -6,772 | -27,663 | ||
| Expenses | 5,251 | 3,078 | 2,038 | 1,281 | 11,647 | ||
| Net capital investment | 290 | 1,633 | 35 | -1,087 | 871 | ||
| Total parameter and other variations impact on fiscal balance | -10,555 | -12,095 | -10,565 | -6,966 | -40,181 | ||
| 2014‑15 MYEFO fiscal balance | -39,806 | -27,223 | -17,778 | -5,035 | -89,842 | ||
| Per cent of GDP | -2.5 | -1.6 | -1.0 | -0.3 | |||
(a) Excludes secondary impacts on public debt interest of policy decisions and offsets from the Contingency Reserve for decisions taken.
(b) A positive number for revenue indicates an increase in the fiscal balance, while a positive number for expenses and net capital investment indicates a decrease in the fiscal balance.
Revenue estimates
Total revenue has been revised down by $5.5 billion in 2014‑15 since the 2014‑15 Budget.
While changes in tax revenue are generally driven by the same factors as tax receipts, there are differences as not all revenue raised in a given year is actually paid in that year. These differences exist for most revenue heads, and vary across years.
Detailed Australian Government general government sector revenue estimates for 2014‑15 and 2015‑16, compared with estimates from the 2014‑15 Budget, are provided in Tables 3.12 and 3.13 respectively.
| Estimates | Change on Budget | |||||
|---|---|---|---|---|---|---|
| Budget | MYEFO | |||||
| $m | $m | $m | % | |||
| Individuals and other withholding taxes | ||||||
| Gross income tax withholding | 171,170 | 168,430 | -2,740 | -1.6 | ||
| Gross other individuals | 40,120 | 40,470 | 350 | 0.9 | ||
| less: Refunds | 27,700 | 27,500 | -200 | -0.7 | ||
| Total individuals and other withholding tax | 183,590 | 181,400 | -2,190 | -1.2 | ||
| Fringe benefits tax | 4,440 | 4,480 | 40 | 0.9 | ||
| Company tax | 73,230 | 70,930 | -2,300 | -3.1 | ||
| Superannuation fund taxes | 7,870 | 7,130 | -740 | -9.4 | ||
| Minerals resource rent tax(a) | 0 | 60 | 60 | - | ||
| Petroleum resource rent tax | 2,060 | 1,770 | -290 | -14.1 | ||
| Income taxation revenue | 271,190 | 265,770 | -5,420 | -2.0 | ||
| Goods and services tax | 56,970 | 56,820 | -150 | -0.3 | ||
| Wine equalisation tax | 790 | 810 | 20 | 2.5 | ||
| Luxury car tax | 360 | 400 | 40 | 11.1 | ||
| Excise and customs duty | ||||||
| Petrol | 5,970 | 5,970 | 0 | 0.0 | ||
| Diesel | 9,280 | 8,960 | -320 | -3.4 | ||
| Other fuel products | 3,730 | 3,280 | -450 | -12.1 | ||
| Tobacco | 8,730 | 8,320 | -410 | -4.7 | ||
| Beer | 2,410 | 2,430 | 20 | 0.8 | ||
| Spirits | 1,930 | 1,970 | 40 | 2.1 | ||
| Other alcoholic beverages(b) | 980 | 950 | -30 | -3.1 | ||
| Other customs duty | ||||||
| Textiles, clothing and footwear | 600 | 590 | -10 | -1.7 | ||
| Passenger motor vehicles | 820 | 800 | -20 | -2.4 | ||
| Other imports | 1,650 | 1,570 | -80 | -4.8 | ||
| less: Refunds and drawbacks | 360 | 420 | 60 | 16.7 | ||
| Total excise and customs duty | 35,740 | 34,420 | -1,320 | -3.7 | ||
| Carbon pricing mechanism | 0 | 0 | 0 | - | ||
| Agricultural levies | 469 | 454 | -15 | -3.2 | ||
| Other taxes | 3,295 | 3,285 | -10 | -0.3 | ||
| Indirect taxation revenue | 97,624 | 96,190 | -1,435 | -1.5 | ||
| Taxation revenue | 368,814 | 361,959 | -6,855 | -1.9 | ||
| Sales of goods and services | 8,928 | 9,190 | 262 | 2.9 | ||
| Interest | 4,229 | 3,987 | -242 | -5.7 | ||
| Dividends | 2,570 | 3,396 | 826 | 32.1 | ||
| Other non-taxation revenue | 6,807 | 7,344 | 537 | 7.9 | ||
| Non-taxation revenue | 22,534 | 23,917 | 1,383 | 6.1 | ||
| Total revenue | 391,348 | 385,876 | -5,472 | -1.4 | ||
| Memorandum: | ||||||
| Total excise | 26,470 | 25,360 | -1,110 | -4.2 | ||
| Total customs duty | 9,270 | 9,060 | -210 | -2.3 | ||
| Capital gains tax(c) | 9,000 | 8,900 | -100 | -1.1 | ||
| Medicare and DisabilityCare Australia levy | 14,160 | 14,130 | -30 | -0.2 | ||
(a) Net revenue from the MRRT is expected to be around $40 million in 2014‑15 which represents the net revenue impact across different revenue heads. These include the offsetting reductions in company tax (through deductibility) and interactions with other taxes. The Government has announced the MRRT will not apply beyond 30 September 2014.
(b) Other alcoholic beverages are those not exceeding 10 per cent by volume of alcohol (excluding beer, brandy and wine).
(c) Capital gains tax is part of gross other individuals, company tax and superannuation fund taxes.
| Estimates | Change on Budget | |||||
|---|---|---|---|---|---|---|
| Budget | MYEFO | |||||
| $m | $m | $m | % | |||
| Individuals and other withholding taxes | ||||||
| Gross income tax withholding | 183,390 | 180,660 | -2,730 | -1.5 | ||
| Gross other individuals | 43,980 | 44,550 | 570 | 1.3 | ||
| less: Refunds | 28,600 | 28,100 | -500 | -1.7 | ||
| Total individuals and other withholding tax | 198,770 | 197,110 | -1,660 | -0.8 | ||
| Fringe benefits tax | 5,010 | 5,030 | 20 | 0.4 | ||
| Company tax | 77,170 | 72,500 | -4,670 | -6.1 | ||
| Superannuation fund taxes | 10,610 | 9,760 | -850 | -8.0 | ||
| Minerals resource rent tax | 0 | 0 | 0 | - | ||
| Petroleum resource rent tax | 1,910 | 1,700 | -210 | -11.0 | ||
| Income taxation revenue | 293,470 | 286,100 | -7,370 | -2.5 | ||
| Goods and services tax | 60,370 | 60,390 | 20 | 0.0 | ||
| Wine equalisation tax | 820 | 840 | 20 | 2.4 | ||
| Luxury car tax | 310 | 360 | 50 | 16.1 | ||
| Excise and customs duty | ||||||
| Petrol | 6,170 | 6,200 | 30 | 0.5 | ||
| Diesel | 9,640 | 9,370 | -270 | -2.8 | ||
| Other fuel products | 3,530 | 3,170 | -360 | -10.2 | ||
| Tobacco | 9,660 | 9,580 | -80 | -0.8 | ||
| Beer | 2,480 | 2,480 | 0 | 0.0 | ||
| Spirits | 1,980 | 2,030 | 50 | 2.5 | ||
| Other alcoholic beverages(a) | 1,010 | 990 | -20 | -2.0 | ||
| Other customs duty | ||||||
| Textiles, clothing and footwear | 430 | 310 | -120 | -27.9 | ||
| Passenger motor vehicles | 610 | 520 | -90 | -14.8 | ||
| Other imports | 1,680 | 1,070 | -610 | -36.3 | ||
| less: Refunds and drawbacks | 360 | 420 | 60 | 16.7 | ||
| Total excise and customs duty | 36,830 | 35,300 | -1,530 | -4.2 | ||
| Carbon pricing mechanism | 0 | 0 | 0 | - | ||
| Agricultural levies | 474 | 478 | 4 | 0.8 | ||
| Other taxes | 3,781 | 3,781 | 0 | 0.0 | ||
| Indirect taxation revenue | 102,585 | 101,149 | -1,436 | -1.4 | ||
| Taxation revenue | 396,055 | 387,249 | -8,806 | -2.2 | ||
| Sales of goods and services | 9,170 | 9,258 | 88 | 1.0 | ||
| Interest | 4,731 | 4,672 | -59 | -1.3 | ||
| Dividends | 2,520 | 3,170 | 650 | 25.8 | ||
| Other non-taxation revenue | 7,135 | 7,333 | 198 | 2.8 | ||
| Non-taxation revenue | 23,557 | 24,433 | 876 | 3.7 | ||
| Total revenue | 419,612 | 411,682 | -7,930 | -1.9 | ||
| Memorandum: | ||||||
| Total excise | 27,400 | 26,990 | -410 | -1.5 | ||
| Total customs duty | 9,430 | 8,310 | -1,120 | -11.9 | ||
| Capital gains tax(b) | 12,000 | 11,300 | -700 | -5.8 | ||
| Medicare and DisabilityCare Australia levy | 15,160 | 15,040 | -120 | -0.8 | ||
(a) Other alcoholic beverages are those not exceeding 10 per cent by volume of alcohol (excluding beer, brandy and wine).
(b) Capital gains tax is part of gross other individuals, company tax and superannuation fund taxes.
Expense and net capital investment estimates
Movements in accrual expenses and net capital investments over the forward estimates are broadly similar to the movements in cash payments. The key exceptions include:
- an increase in the accrued superannuation expenses for 2014‑15 of $2.2 billion. For budget reporting purposes, a discount rate applied by actuaries in preparing long term cost reports is used (6 per cent). At MYEFO a discount rate based on the long term government bonds at the commencement of the financial year is applied (4.1 per cent) in accordance with accounting standards. This movement has no impact on cash payments;
- cash payments of $1.8 billion under Natural Disaster Relief and Recovery Arrangements, where expenses are recognised in the financial year in which the disaster occurs, not when cash is paid; and
- the provision of Goods and Services Tax (GST) to the States and Territories, reflecting higher than estimated GST entitlements of $370 million for the 2013‑14 financial year. This amount was accrued in 2013‑14 and will be paid in 2014‑15.
Estimates of Australian Government general government sector expenses by function can be found in Attachment D.
Table 3.14 provides a reconciliation of expense estimates.
| Estimates | Projections | ||||||
|---|---|---|---|---|---|---|---|
| 2014‑15 | 2015‑16 | 2016‑17 | 2017‑18 | Total | |||
| $m | $m | $m | $m | $m | |||
| 2014‑15 Budget expenses | 414,845 | 431,118 | 453,806 | 475,447 | 1,775,216 | ||
| Changes from 2014‑15 Budget to 2014‑15 MYEFO | |||||||
| Effect of policy decisions(a) | 2,802 | 2,288 | 253 | -1,418 | 3,925 | ||
| Effect of economic parameter variations | |||||||
| Total economic parameter variations | 449 | 657 | 64 | -189 | 982 | ||
| Unemployment benefits | 280 | 270 | 184 | 232 | 966 | ||
| Prices and wages | 158 | 174 | -86 | -243 | 2 | ||
| Interest and exchange rates | 11 | 33 | 16 | 3 | 63 | ||
| GST payments to the States | 0 | 180 | -50 | -180 | -50 | ||
| Public debt interest | 25 | -118 | -212 | -436 | -742 | ||
| Program specific parameter variations | 4,802 | 3,106 | 2,621 | 3,133 | 13,662 | ||
| Other variations | -25 | -567 | -435 | -1,227 | -2,254 | ||
| Total variations | 8,053 | 5,366 | 2,291 | -137 | 15,572 | ||
| 2014‑15 MYEFO expenses | 422,898 | 436,484 | 456,097 | 475,310 | 1,790,788 | ||
(a) Excludes secondary impacts on public debt interest of policy decisions and offsets from the Contingency Reserve for decisions taken.
Table 3.15 provides a reconciliation of the net capital investment estimates.
| Estimates | Projections | ||||||
|---|---|---|---|---|---|---|---|
| 2014‑15 | 2015‑16 | 2016‑17 | 2017‑18 | Total | |||
| $m | $m | $m | $m | $m | |||
| 2014‑15 Budget net capital investment | 2,359 | 708 | 2,630 | 3,962 | 9,658 | ||
| Changes from 2014‑15 Budget to 2014‑15 MYEFO | |||||||
| Effect of policy decisions(a) | 135 | 81 | 53 | 24 | 294 | ||
| Effect of parameter and other variations | 290 | 1,633 | 35 | -1,087 | 871 | ||
| Total variations | 425 | 1,714 | 88 | -1,063 | 1,165 | ||
| 2014‑15 MYEFO net capital investment | 2,784 | 2,422 | 2,718 | 2,899 | 10,823 | ||
(a) Excludes secondary impacts on public debt interest of policy decisions and offsets from the Contingency Reserve for decisions taken.
Headline cash balance
The headline cash balance consists of the underlying cash balance, net cash flows from investments in financial assets for policy purposes (for example, the equity funding of NBN Co), and net Future Fund earnings.
Table 3.16 provides further detail between the underlying and headline cash balance estimates of the Australian Government general government sector.
| Estimates | Projections | ||||||
|---|---|---|---|---|---|---|---|
| 2014‑15 | 2015‑16 | 2016‑17 | 2017‑18 | Total | |||
| $m | $m | $m | $m | $m | |||
| 2014‑15 MYEFO underlying cash balance(a) | -40,362 | -31,239 | -20,844 | -11,480 | -103,925 | ||
| plus Net cash flows from investments in financial assets for policy purposes | |||||||
| Student loans | -6,822 | -7,978 | -9,615 | -10,907 | -35,322 | ||
| NBN investment | -5,200 | -6,420 | -6,865 | -2,597 | -21,082 | ||
| Sale of Medibank Private | 5,679 | 0 | 0 | 0 | 5,679 | ||
| Residential mortgage backed securities | 1,599 | 1,431 | 885 | 572 | 4,487 | ||
| WestConnex | 0 | -226 | -854 | -831 | -1,912 | ||
| Trade support loans | -144 | -460 | -511 | -563 | -1,677 | ||
| Asbestos removal in the ACT — Mr Fluffy loose fill asbestos remediation(b) | -750 | -250 | 125 | 125 | -750 | ||
| Net other | -1,182 | -313 | -218 | 100 | -1,614 | ||
| Total net cash flows from investments in financial assets for policy purposes | -6,821 | -14,217 | -17,053 | -14,101 | -52,191 | ||
| plus Net Future Fund earnings | 3,319 | 3,523 | 3,653 | 3,924 | 14,419 | ||
| 2014‑15 MYEFO headline cash balance | -43,863 | -41,933 | -34,244 | -21,657 | -141,697 | ||
(a) Excludes expected net Future Fund earnings.
(b) The final terms of the loan are currently being settled and repayment and interest arrangements are subject to change.
The headline cash balance for 2014‑15 is estimated to be a deficit of $43.9 billion (2.7 per cent of GDP), compared with a deficit of $33.5 billion at Budget.
The deterioration in the headline cash balance has been primarily driven by the downgrades to commodity prices, lower than expected wage growth, negotiations with the Senate and parameter and other variations that have affected the underlying cash balance. Further adding to the deterioration in the headline cash balance is increased demand for student loans.
Structural budget balance estimates
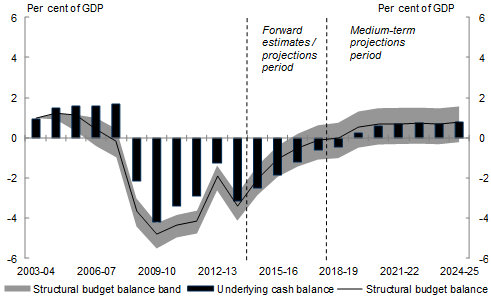
The outlook for the structural budget balance is largely unchanged from the 2014‑15 Budget, consistent with economic parameter revisions being the primary driver of the deterioration in the underlying cash balance over the forward estimates period. The structural position of the budget is forecast to improve to a surplus by 2019‑20, consistent with the underlying cash balance. Following a prolonged period of significant structural deficits, the projected improvement in the structural budget balance reflects the Government's commitment to restore the budget to a structurally sustainable position and the savings measures that build over time to achieve this.
Source: ABS cat. no. 5206.0, 5302.0, 6202.0, 6401.0 and Treasury.
Note: The grey range spans structural budget estimates using the average terms of trade between 1986‑87 and 2010‑11 (lower bound), which is the OECD's assumption for Australia's structural level of the terms of trade, and using the forecast average from 2003‑04 to 2016‑17 (upper bound). The central estimate is based on the structural level of the terms of trade in the Government's medium‑term economic projections. The methodology for producing the structural budget balance estimates was detailed in Treasury Working Paper 2013‑01.
Structural budget balance measures are sensitive to the assumptions and parameters underpinning the estimates, including identifying the structural level of the terms of trade and the relationship between tax receipts and economic activity. Due to the sensitivity of estimates to assumptions, it is best to consider a range of structural budget balance estimates based on plausible assumptions for the underlying parameters as one element of a broader assessment of fiscal sustainability.