


Part 3: Fiscal Strategy and Outlook (continued)
Attachment F: Debt Statement
The Debt Statement provides information on current and projected debt on issue and details of climate spending and the extent to which this spending has contributed to debt.
Commonwealth Government Securities issuance
The Government finances its activities either through receipts or borrowing. When receipts fall short of payments, the Government borrows by issuing Commonwealth Government Securities (CGS) to investors.
Even when CGS issuance is not required to finance the government's activities, successive governments have continued to issue CGS for policy purposes, such as to maintain a liquid CGS market. A well‑functioning CGS market supports the Treasury Bond futures markets (used by financial institutions to manage interest rate risk), supports the corporate bond market by providing a risk‑free benchmark, and provides a low‑risk investment vehicle.
The Australian Office of Financial Management (AOFM) is the agency responsible for issuing CGS and the management of the Government's financing activities. The AOFM currently issues three types of securities:
Treasury Bonds: medium‑to long‑term securities with a fixed annual rate of interest payable every six months;
Treasury Indexed Bonds (TIBs): medium‑ to long‑term securities for which the capital value of the security is adjusted for movements in the consumer price index (CPI). Interest on TIBs is paid quarterly, at a fixed rate, on the adjusted capital value; and
Treasury Notes: short‑term securities generally maturing within six months of issuance. The volume of Treasury Notes on issue will vary over the course of the year, depending on the size and profile of the within‑year funding flows.
All new CGS issuance is undertaken in Australian dollars. There is a very small amount of foreign currency denominated debt securities on issue remaining from issuance undertaken before 1988. Most of these securities mature in March 2017.
Within these three broad categories of CGS, issuance is undertaken into a limited number of maturities (known as lines). Each of these lines has a fixed maturity date (the date on which the Government repays the principal it has borrowed) and, for Treasury Bonds and TIBs, a coupon rate (the annual fixed interest rate paid on the security).
Concentrating CGS issuance into a limited number of lines (rather than issuing securities with a specific time value, such as 10 years) ensures each line is sufficiently large that it can easily be traded in the secondary market. Strong liquidity in the secondary market is attractive to investors, promotes demand for CGS, and assists in lowering borrowing costs.
Estimates and projections of CGS on issue
Estimates and projections of CGS on issue are published in both face value and market value terms in this statement.
The face value of CGS on issue is the amount that the Government pays back to investors at maturity, independent of fluctuations in market prices.1 The total face value of CGS on issue changes when new securities are issued, or when securities are repurchased or reach maturity.
The market value of CGS represents the value of securities as traded on the secondary market, which changes continuously with movements in market prices. Consistent with external reporting standards the market value of CGS on issue is reported on the Australian Government general government sector balance sheet. Changes in the market price of CGS have an impact on the value of net debt.
Table 3.37 contains projections of the face value (end‑of‑year and within‑year peak)2 and the market value (end‑of‑year) of CGS on issue.
The Commonwealth Inscribed Stock Act 1911 (CIS Act) requires the Treasurer to issue a direction to the AOFM stipulating the maximum face value of relevant CGS that may be on issue. As required by the Charter of Budget Honesty Act 1998, Table 3.37 reports projections of CGS on issue subject to the Treasurer's Direction.
When considering these projections, it is important to note that the AOFM publishes an issuance strategy for the budget year only. Projections beyond the budget year are based on a set of technical assumptions and will vary with changes to these assumptions and budget estimates and projections.
| 2014‑15 | 2015‑16 | 2016‑17 | 2017‑18 | |
|---|---|---|---|---|
| $b | $b | $b | $b | |
| Face value - end of year | 367 | 413 | 459 | 481 |
| Per cent of GDP | 22.8 | 24.6 | 26.0 | 25.9 |
| Face value - within-year peak(b) | 373 | 433 | 480 | 508 |
| Per cent of GDP(b) | 23.2 | 25.8 | 27.2 | 27.4 |
| Month of peak(b) | Apr-15 | May-16 | Feb-17 | Jan-18 |
| Market value - end of year(c) | 405 | 452 | 499 | 523 |
| Per cent of GDP | 25.2 | 26.9 | 28.3 | 28.2 |
(a) The same stock and securities that were excluded from the previous legislative limit are excluded from the current limit set by the Treasurer's Direction. These exclusions, outlined in subsection 51JA(2A) of the CIS Act, are:
- stock and securities issued in relation to money borrowed under the Loan (Temporary Revenue Deficits) Act 1953;
- stock and securities loaned by the Treasurer under a securities lending arrangement under section 5BA of the Loans Securities Act 1919, or held by or on behalf of the Treasurer for the purpose of such an arrangement;
- stock and securities invested under subsection 58 of the Public Governance, Performance and Accountability Act 2013; and
- stock and securities on issue as at the start of 13 July 2008, other than Treasury Fixed Coupon Bonds.
(b) The precise within‑year timing of cash receipts and payments is not known. Projected peaks of CGS on issue are therefore subject to considerable uncertainty.
(c) The Treasurer's Direction applies only to the face value of CGS on issue. This table shows the equivalent market value of CGS that are subject to the Treasurer's Direction. These figures will differ from the estimates and projections published in Appendix B: Australian Government Budget Financial Statements Table B2: Australian Government general government sector balance sheet that refer to total CGS on issue.
Source: Australian Office of Financial Management.
The total amount of CGS on issue and the amount of CGS on issue subject to the Treasurer's Direction is reported weekly on the AOFM website.
In 2014‑15, the end‑of‑year face value of CGS on issue subject to the Treasurer's Direction is expected to be $367 billion, compared to around $359 billion at the 2014‑15 Budget. Over the forward estimates, the end‑of year face value of CGS on issue subject to the Treasurer's Direction is expected to peak at $481 billion in 2017‑18, around $36 billion higher than the $445 billion estimated at the 2014‑15 Budget.
In 2014‑15, the face value of CGS on issue is expected to reach a within‑year peak of around $373 billion. Over the forward estimates, the face value of CGS on issue is projected to rise to a within‑year peak of around $508 billion in 2017‑18.
Changes in CGS on issue since the 2014‑15 Budget
Table 3.38 shows the change in the projected end‑of‑year face value of CGS on issue, between the 2014‑15 Budget and the 2014‑15 MYEFO.
| 2014‑15 | 2015‑16 | 2016‑17 | 2017‑18 | |
|---|---|---|---|---|
| $b | $b | $b | $b | |
| Total face value of CGS on issue subject to the Treasurer's Direction as at 2014‑15 Budget | 359 | 392 | 430 | 445 |
| Factors affecting the change in face value of CGS on issue from 2014‑15 Budget to 2014‑15 MYEFO (a) | ||||
| Cumulative receipts decisions | 0.5 | 0.8 | 0.9 | 1.1 |
| Cumulative receipts variations | 5.8 | 12.5 | 20.0 | 28.1 |
| Cumulative payment decisions | 1.8 | 3.7 | 4.1 | 3.0 |
| Cumulative payment variations | 2.2 | 7.2 | 9.3 | 10.7 |
| Cumulative change in net investments in financial assets(b) | 0.7 | 2.3 | 2.7 | 4.3 |
| Other financing | -2.2 | -5.7 | -8.3 | -10.2 |
| Other contributors | -0.3 | -0.2 | -0.5 | -0.2 |
| Total face value of CGS on issue subject to the Treasurer's Direction as at 2014‑15 MYEFO | 367 | 413 | 459 | 481 |
(a) Cumulative impact of decisions and variations from 2014‑15 to 2017‑18. Increases to payments are shown as positive, and increases to receipts are shown as negative.
(b) Change in net cash flows from investments in policy and liquidity purposes
Note: End of year data.
Note: A tax‑to‑GDP cap of 23.9 per cent is applied on 2014‑15 Budget and 2014‑15 MYEFO projections. No tax cap has been applied to 2013‑14 MYEFO projections.
Source: Australian Office of Financial Management and Treasury projections.
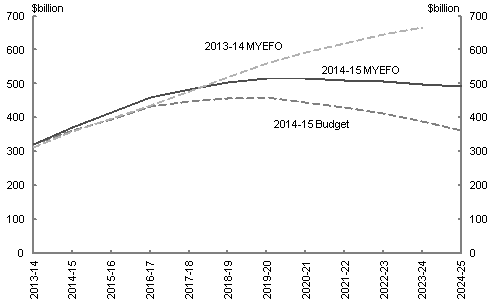
Commonwealth Government Securities (CGS) on issue are expected to reach $499 billion in 2023‑24, a fall of nearly $170 billion compared to $667 billion at the 2013‑14 MYEFO. This improvement is achieved despite allowance being included for future tax relief for which allowance was not included in the 2013‑14 MYEFO figures showing the fiscal position inherited from the previous Government. CGS on issue was projected to reach $389 billion in 2023‑24 at the time of the 2014‑15 Budget. The increase in CGS on issue since then is a result of the deterioration in the underlying cash balance across the forward estimates and the medium term.
Changes in net debt since the 2014‑15 Budget
Australian Government general government sector net debt is equal to the sum of deposits held, government securities (at market value), loans and other borrowing, minus the sum of cash and deposits, advances paid and investments, loans and placements.
| Projections | |||||
|---|---|---|---|---|---|
| 2014‑15 | 2015‑16 | 2016‑17 | 2017‑18 | ||
| $m | $m | $m | $m | ||
| Liabilities included in net debt | |||||
| Deposits held | 211 | 211 | 211 | 211 | |
| Government securities | 409,609 | 456,734 | 504,139 | 527,633 | |
| Loans | 13,693 | 13,004 | 12,957 | 12,927 | |
| Other borrowing | 1,553 | 1,424 | 1,340 | 1,280 | |
| Total liabilities included in net debt | 425,066 | 471,373 | 518,647 | 542,050 | |
| Assets included in net debt | |||||
| Cash and deposits | 3,825 | 4,163 | 3,799 | 4,404 | |
| Advances paid | 46,208 | 52,854 | 61,928 | 70,785 | |
| Investments, loans and placements | 130,197 | 134,782 | 148,537 | 151,097 | |
| Total assets included in net debt | 180,230 | 191,799 | 214,264 | 226,286 | |
| Net debt | 244,836 | 279,574 | 304,383 | 315,764 | |
Net debt in 2014‑15 is estimated to increase by $18.4 billion since the 2014‑15 Budget to $245 billion. From 2014‑15 to 2016‑17, net debt is higher compared to the 2014‑15 Budget.
This is primarily driven by higher levels of Commonwealth Government Securities, owing to changes in the financing requirement and a decrease in average yields compared to those at the 2014‑15 Budget. Decreases in average yields result in increases in the market value of Commonwealth Government Securities on issue. This is partially offset by small increases in cash and deposits and advances paid.
| 2014‑15 | 2015‑16 | 2016‑17 | 2017‑18 | |
|---|---|---|---|---|
| $b | $b | $b | $b | |
| Net debt as at 2014‑15 Budget ($b) | 226.4 | 246.4 | 261.3 | 264.2 |
| Changes in financing requirement | 8.4 | 24.9 | 36.5 | 48.9 |
| Impact of lower yields on CGS | 13.4 | 10.4 | 7.2 | 3.5 |
| Asset and other liability movements | -3.4 | -2.1 | -0.5 | -0.9 |
| Cash and deposits | -1.3 | -1.4 | -1.0 | -1.3 |
| Advances paid | -1.1 | -0.4 | -0.6 | -0.8 |
| Investments, loans and placements | -1.4 | -0.8 | 0.7 | 0.8 |
| Other movements | 0.5 | 0.5 | 0.4 | 0.4 |
| Total movements in Net Debt from | ||||
| 2014‑15 Budget to 2014‑15 MYEFO($b) | 18.4 | 33.2 | 43.1 | 51.6 |
| Net debt as at 2014‑15 MYEFO ($b) | 244.8 | 279.6 | 304.4 | 315.8 |
Breakdown of CGS currently on issue
Table 3.41 provides a breakdown of the CGS on issue by type of security as at 5 December 2014.
| On issue as at 5 December 2014 | |||
|---|---|---|---|
| Face value | Market value | ||
| $m | $m | ||
| Treasury Bonds (a) | 315,234 | 344,991 | |
| Treasury Indexed Bonds (a) | 22,916 | 30,576 | |
| Treasury Notes (a) | 7,500 | 7,460 | |
| Total CGS subject to Treasurer's Direction(a)(b) | 345,650 | 383,028 | |
| Other stock and securities | 2,535 | 4,825 | |
| Total CGS on issue | 348,185 | 387,852 | |
(a) The Treasurer's Direction applies only to the face value of CGS on issue. This table shows the equivalent market value of CGS that are subject to the Treasurer's Direction.
(b) The same stock and securities that were excluded from the previous legislative limit are excluded from the current limit set by the Treasurer's Direction. These exclusions, outlined in subsection 51JA(2A) of the CIS Act, are:
- stock and securities issued in relation to money borrowed under the Loan (Temporary Revenue Deficits) Act 1953;
- stock and securities loaned by the Treasurer under a securities lending arrangement under section 5BA of the Loans Securities Act 1919, or held by or on behalf of the Treasurer for the purpose of such an arrangement;
- stock and securities invested under subsection 58 of the Public Governance, Performance and Accountability Act 2013; and
- stock and securities on issue as at the start of 13 July 2008, other than Treasury Fixed Coupon Bonds.
Source: Australian Office of Financial Management.
Treasury Bonds
Table 3.42 lists Treasury Bonds currently on issue, as well as the annual interest rate (the coupon) and the timing of coupon payments. As at 5 December 2014, there were 20 Treasury Bond lines on issue, with a weighted average term to maturity of around 6.3 years and the longest maturity extending to April 2037. This was extended from April 2033 with the issuance of the April 2037 bond line since the 2014‑15 Budget.
| Coupon Per cent |
Maturity | On issue as at 5 December 2014 |
Timing of interest payments(a) | ||
|---|---|---|---|---|---|
| $m | |||||
| 6.25 | 15-Apr-15 | 14,797 | Twice yearly | 15 Apr | 15 Oct |
| 4.75 | 21-Oct-15 | 13,899 | Twice yearly | 21 Oct | 21 Apr |
| 4.75 | 15-Jun-16 | 21,900 | Twice yearly | 15 Jun | 15 Dec |
| 6.00 | 15-Feb-17 | 21,096 | Twice yearly | 15 Feb | 15 Aug |
| 4.25 | 21-Jul-17 | 18,900 | Twice yearly | 21 Jul | 21 Jan |
| 5.50 | 21-Jan-18 | 20,500 | Twice yearly | 21 Jan | 21 Jul |
| 3.25 | 21-Oct-18 | 11,400 | Twice yearly | 21 Oct | 21 Apr |
| 5.25 | 15-Mar-19 | 20,847 | Twice yearly | 15 Mar | 15 Sep |
| 2.75 | 21-Oct-19 | 7,600 | Twice yearly | 21 Oct | 21 Apr |
| 4.50 | 15-Apr-20 | 20,397 | Twice yearly | 15 Apr | 15 Oct |
| 5.75 | 15-May-21 | 21,599 | Twice yearly | 15 May | 15 Nov |
| 5.75 | 15-Jul-22 | 17,500 | Twice yearly | 15 Jul | 15 Jan |
| 5.50 | 21-Apr-23 | 21,300 | Twice yearly | 21 Apr | 21 Oct |
| 2.75 | 21-Apr-24 | 18,700 | Twice yearly | 21 Apr | 21 Oct |
| 3.25 | 21-Apr-25 | 13,800 | Twice yearly | 21 Apr | 21 Oct |
| 4.25 | 21-Apr-26 | 13,500 | Twice yearly | 21 Apr | 21 Oct |
| 4.75 | 21-Apr-27 | 13,000 | Twice yearly | 21 Apr | 21 Oct |
| 3.25 | 21-Apr-29 | 9,000 | Twice yearly | 21 Apr | 21 Oct |
| 4.50 | 21-Apr-33 | 8,500 | Twice yearly | 21 Apr | 21 Oct |
| 3.75 | 21-Apr-37 | 7,000 | Twice yearly | 21 Apr | 21 Oct |
(a) Where the timing of an interest payment falls on a non‑business day, the payment will occur on the following business day.
Source: Australian Office of Financial Management.
Treasury Indexed Bonds
Table 3.43 lists Treasury Indexed Bonds currently on issue, as well as the annual interest rate (the coupon) and the timing of coupon payments. As at 5 December 2014, there were 7 TIB lines on issue, with a weighted average term to maturity of around nine years and the longest maturity extending to August 2035.
| Coupon Per cent |
Maturity | On issue as at 5 December 2014 |
Timing of interest payments(a) | ||||
|---|---|---|---|---|---|---|---|
| $m | |||||||
| 4.00 | 20-Aug-15 | 1,152 | Quarterly | 20 Aug | 20 Nov | 20 Feb | 20 May |
| 1.00 | 21-Nov-18 | 3,539 | Quarterly | 21 Nov | 21 Feb | 21 May | 21 Aug |
| 4.00 | 20-Aug-20 | 4,964 | Quarterly | 20 Aug | 20 Nov | 20 Feb | 20 May |
| 1.25 | 21-Feb-22 | 4,290 | Quarterly | 21 Feb | 21 May | 21 Aug | 21 Nov |
| 3.00 | 20-Sep-25 | 5,543 | Quarterly | 20 Sep | 20 Dec | 20 Mar | 20 June |
| 2.50 | 20-Sep-30 | 3,293 | Quarterly | 20 Sep | 20 Dec | 20 Mar | 20 June |
| 2.00 | 21-Aug-35 | 2,650 | Quarterly | 21 Aug | 21 Nov | 21 Feb | 21 May |
(a) Where the timing of an interest payment falls on a non‑business day, the payment will occur on the following business day.
Source: Australian Office of Financial Management.
Treasury Notes
The face value of Treasury Notes on issue as at 5 December 2014 was $7.5 billion. Table 3.44 lists the Treasury Notes currently on issue. Treasury Notes do not pay a coupon, but they are issued at a discount — the face value received at maturity is higher than the price paid at issuance.
| Maturity | On issue as at 5 December 2014 ($m) |
Timing of interest payment | ||
|---|---|---|---|---|
| 23-Jan-15 | 3,000 | At maturity | 23 Jan | |
| 27-Feb-15 | 4,000 | At maturity | 27 Feb | |
| 24-Apr-15 | 500 | At maturity | 24 Apr | |
Source: Australian Office of Financial Management.
Non‑resident holdings of CGS on issue
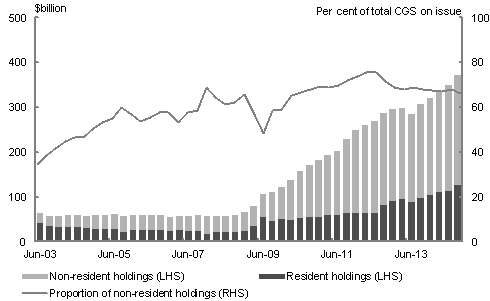
The sale of CGS is not restricted to Australian residents. As at the September quarter 2014, 66.1 per cent of total CGS on issue were held by non‑residents of Australia (Chart 3.14).
The proportion of CGS held by non‑residents has risen significantly since 2009 and remains around historically high levels. This is likely to have been driven by the build‑up of foreign currency reserves in some countries, and an increasing tendency for these reserves to be invested outside of the major currencies (such as the yen, the US dollar and the euro).
The historically high proportion of non‑resident holdings of CGS is also likely to have been driven by a rise in investor confidence in the Australian sovereign debt market, owing to the relative strength of Australia's public finances and the Australian economy more broadly.
Against a backdrop of relatively low government bond yields globally, this confidence in the Australian sovereign debt market has likely contributed to longer‑term CGS yields falling to historically low levels in recent years.
Note: Data refer to the market value of holdings.
Source: ABS Catalogue Number 5302.0 and Australian Office of Financial Management.
Interest on CGS
The interest costs related to CGS are presented in these statements in both cash and accrual accounting terms. The difference between the cash interest payments and accrual interest expense generally relates to the timing of when the interest cost is recognised.
- Interest payments are recognised in the period when they are paid during the life of the security.
- Interest expense is recognised in the period in which an expense is incurred during the life of the security, rather when they are actually paid.
Estimates of the interest payments and interest expense of CGS on issue include the cost of CGS already on issue and future CGS issuance. The cost of:
- CGS already on issue uses the actual interest rates incurred at the time of issuance; and
- the expected future issuance of CGS is based on the prevailing market rates across the yield curve at the time of a budget estimates update.
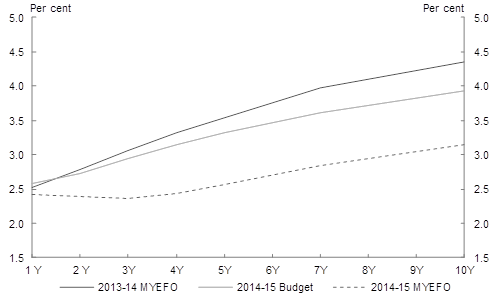
The assumed market yields at the 2014‑15 MYEFO result in a weighted average cost of borrowing of around 2.9 per cent for future issuance of Treasury Bonds in the forward estimates period, compared with around 3.7 per cent at the 2014‑15 Budget. Chart 3.15 shows the yield curve assumptions underpinning the 2013‑14 MYEFO, 2014‑15 Budget and 2014‑15 MYEFO.
Source: Australian Office of Financial Management.
The Government's interest payments and expense over the forward estimates mostly relate to the cost of servicing the stock of CGS on issue, and are expected to increase over the forward estimates as a result of the projected rise in CGS on issue.
The Government's total interest payments in 2014‑15 are estimated to be $14.2 billion, of which $13.6 billion relates to CGS on issue (Table 3.45).
| 2014‑15 | 2015‑16 | 2016‑17 | 2017‑18 | |
|---|---|---|---|---|
| $m | $m | $m | $m | |
| Interest payments on CGS(a) | 13,567 | 14,702 | 15,358 | 16,020 |
| Per cent of GDP | 0.8 | 0.9 | 0.9 | 0.9 |
| Total interest payments(a) | 14,221 | 15,354 | 16,007 | 16,676 |
| Per cent of GDP | 0.9 | 0.9 | 0.9 | 0.9 |
| Interest expense on CGS(b) | 14,720 | 16,015 | 16,943 | 17,439 |
| Per cent of GDP | 0.9 | 1.0 | 1.0 | 0.9 |
| Total interest expense(b) | 16,387 | 17,871 | 19,239 | 19,925 |
| Per cent of GDP | 1.0 | 1.1 | 1.1 | 1.1 |
(a) Interest payments are a cash measure, with the relevant amount recognised in the period in which the interest payment is made.
(b) Interest expense is an accrual measure, with the relevant amount recognised in the period in which the expense is incurred, but not necessarily paid.
The Government's interest expenses at the 2014‑15 MYEFO are estimated to be $16.4 billion in 2014‑15, of which $14.7 billion relates to CGS on issue. In the 2014‑15 Budget, interest expenses in 2014‑15 were estimated to be $15.6 billion, of which $14.7 billion related to CGS on issue. Table 3.46 shows the Government's estimated interest expense, interest income and net interest expense over the forward estimates.
| 2014‑15 | 2015‑16 | 2016‑17 | 2017‑18 | |
|---|---|---|---|---|
| $m | $m | $m | $m | |
| Interest expense | 16,387 | 17,871 | 19,239 | 19,925 |
| Per cent of GDP | 1.0 | 1.1 | 1.1 | 1.1 |
| Interest income | 3,987 | 4,672 | 5,031 | 5,322 |
| Per cent of GDP | 0.2 | 0.3 | 0.3 | 0.3 |
| Net interest expense | 12,400 | 13,199 | 14,208 | 14,603 |
| Per cent of GDP | 0.8 | 0.8 | 0.8 | 0.8 |
(a) Interest expense is an accrual measure, with the relevant amount recognised in the period in which the expense is incurred, but not necessarily paid.
Climate spending
The Government's climate spending is shown on an aggregated basis in Table 3.47.
| 2014‑15 | 2015‑16 | 2016‑17 | 2017‑18 | |
|---|---|---|---|---|
| $b | $b | $b | $b | |
| Climate spending(a) | 0.95 | 0.80 | 0.65 | 0.60 |
(a) Spending in this table is on a headline cash balance basis; that is, payments and net cash flows from investments in financial assets for policy purposes, as well as estimated interest receipts associated with Clean Energy Finance Corporation investments.
Over the forward estimates, the key components of climate spending are:
- the Emissions Reduction Fund, which will provide incentives to support abatement activities across the economy; and
- funding for the Department of Industry to support Australian Renewable Energy Agency legacy functions.
Estimates of climate spending have been updated to reflect the delay in the passage of legislation to abolish the Clean Energy Finance Corporation, and Australia's contribution of $200 million to the UN Green Climate Fund.
Impact of climate spending on debt
Receipts and debt are not specifically allocated to particular spending programmes. In this context, there are multiple approaches that could be taken to consider the extent to which climate spending has contributed to debt.
One approach is to assume that the proportion of climate spending being financed through new debt (as opposed to receipts) is equivalent to climate spending as a proportion of total spending. Table 3.48 shows the impact of climate spending on debt using this approach.
| 2014‑15 | 2015‑16 | 2016‑17 | 2017‑18 | |
|---|---|---|---|---|
| Climate spending ($b) (a) | 0.95 | 0.80 | 0.65 | 0.60 |
| Total spending ($b) (b) | 421.1 | 442.6 | 463.3 | 481.2 |
| Climate spending (per cent of total spending) | 0.2 | 0.2 | 0.1 | 0.1 |
| Change in face value of CGS from previous year ($b) (c) | 50 | 46 | 46 | 23 |
| Contribution to change in face value of CGS from climate spending ($b) | 0.11 | 0.08 | 0.06 | 0.03 |
(a) The calculation of climate spending in this table is on a headline cash balance basis; that is, payments and net cash flows from investments in financial assets for policy purposes, as well as estimated interest receipts associated with the Clean Energy Finance Corporation investments.
(b) The calculation of total spending in this table is on a headline cash balance basis; that is, total payments and net cash flows from investments in financial assets for policy purposes.
(c) Calculations of the change in the face value of CGS are calculated using total CGS on issue.
1 For TIBs, the final repayment amount paid to investors includes an additional amount owing to inflation growth over the life of the security. This amount is not included in the calculation of face value.
2 End-of-year values are estimates or projections of CGS on issue at 30 June for the particular year. The precise timing of within-year peaks of CGS on issue is not known. The timing of the within-year peak is therefore reported to the given month in the particular year.