

Statement 4 (continued)
Variations in receipts estimates
Table 3 reconciles the 2015‑16 Budget's estimates of total receipts, which include non‑tax receipts, with the 2014‑15 Budget and the 2014‑15 MYEFO estimates. These differences reflect the impact of parameter and other variations and the impact of policy decisions.
| Estimates | Projections | ||||||||||
|---|---|---|---|---|---|---|---|---|---|---|---|
| 2014‑15 $m |
2015‑16 $m |
2016‑17 $m |
2017‑18 $m |
Total $m | |||||||
| Receipts at 2014‑15 Budget | 385,778 | 410,427 | 436,849 | 467,985 | 1,701,040 | ||||||
| Changes from 2014‑15 Budget to 2014‑15 MYEFO | |||||||||||
| Effect of policy decisions | ‑486 | ‑350 | ‑105 | ‑140 | ‑1,082 | ||||||
| Effect of parameter and other variations | ‑5,809 | ‑6,714 | ‑7,515 | ‑8,040 | ‑28,078 | ||||||
| Total variations | ‑6,295 | ‑7,064 | ‑7,620 | ‑8,180 | ‑29,160 | ||||||
| Receipts at 2014‑15 MYEFO | 379,483 | 403,362 | 429,228 | 459,806 | 1,671,880 | ||||||
| Changes from 2014‑15 MYEFO to 2015‑16 Budget | |||||||||||
| Effect of policy decisions | 40 | ‑432 | 396 | 783 | 787 | ||||||
| Effect of parameter and other variations | ‑2,214 | ‑4,950 | ‑7,163 | ‑6,993 | ‑21,321 | ||||||
| Total variations | ‑2,174 | ‑5,382 | ‑6,767 | ‑6,211 | ‑20,535 | ||||||
| Receipts at 2015‑16 Budget | 377,309 | 397,980 | 422,461 | 453,595 | 1,651,345 | ||||||
(a) Includes expected Future Fund earnings.
Since the 2014‑15 MYEFO, total receipts have been revised down by around $20.5 billion in the four years to 2017‑18, reflecting a downward revision of $21.3 billion from parameter and other variations, and an increase of $0.8 billion from policy decisions. Excluding GST, total receipts have been revised down $5.2 billion in 2015‑16 and $22.1 billion over the four years to 2017‑18.
Since the 2014‑15 Budget, total receipts have been revised down by $49.7 billion over the four years to 2017‑18.
Chart 1 shows the revisions to estimates for total receipts, which includes non‑tax receipts, since the 2014‑15 MYEFO over the four years to 2017‑18. The revisions are broken down by revisions owing to policy decisions and revisions owing to parameter and other variations.
| Year | Policy decisions | Parameter and other variations | Total variations |
|---|---|---|---|
| 2014-15 | 0.040 | -2.214 | -2.174 |
| 2015-16 | -0.432 | -4.950 | -5.382 |
| 2016-17 | 0.396 | -7.163 | -6.767 |
| 2017-18 | 0.783 | -6.993 | -6.211 |
Source: Source: Treasury.
Variations in receipts can stem from either policy changes or parameter and other variations — that is, recent economic conditions, the updated economic outlook, year‑to‑date tax collections and other non‑policy factors. The key economic parameters that influence receipts are shown in Table 4. Analysis of the sensitivity of the tax receipts estimates to changes in the economic outlook is provided in Budget Statement 7.
| Estimates | Projections | |||||
|---|---|---|---|---|---|---|
| 2014‑15 | 2015‑16 | 2016‑17 | 2017‑18 | 2018‑19 | ||
| Revenue parameters at 2015‑16 Budget | ||||||
| Nominal gross domestic product (non-farm) | 1 1/2 | 3 1/4 | 5 1/2 | 5 1/4 | 5 1/2 | |
| Change since 2014‑15 MYEFO | - 1/4 | -1 1/4 | 1/4 | 0 | na | |
| Compensation of employees(b) | 3 | 3 3/4 | 4 1/2 | 4 3/4 | 5 1/4 | |
| Change since 2014‑15 MYEFO | - 1/2 | - 1/2 | - 1/4 | - 1/2 | na | |
| Corporate gross operating surplus(c) | -2 3/4 | 1/4 | 7 1/2 | 6 1/2 | 5 3/4 | |
| Change since 2014‑15 MYEFO | 1/2 | -4 | 1 1/2 | 1 | na | |
| Unincorporated business income (non-farm) | 3/4 | 1 1/2 | 4 | 5 | 5 3/4 | |
| Change since 2014‑15 MYEFO | -2 3/4 | -1 1/4 | 1 | 1 1/2 | na | |
| Property income(d) | 4 | 6 | 7 | 5 1/4 | 5 1/2 | |
| Change since 2014‑15 MYEFO | -1 1/2 | -3 1/2 | 1 3/4 | 0 | na | |
| Consumption subject to GST | 3 1/2 | 5 1/4 | 5 1/2 | 5 1/2 | 5 1/2 | |
| Change since 2014‑15 MYEFO | - 3/4 | - 1/2 | 1/4 | 0 | na | |
(a) Current prices, per cent change on previous years. Changes since the 2014‑15 MYEFO are percentage points and may not reconcile due to rounding.
(b) Compensation of employees measures total remuneration earned by employees.
(c) Corporate GOS is an Australian System of National Accounts measure of company profits, gross of depreciation.
(d) Property income measures income derived from interest, rent and dividends.
na not applicable.
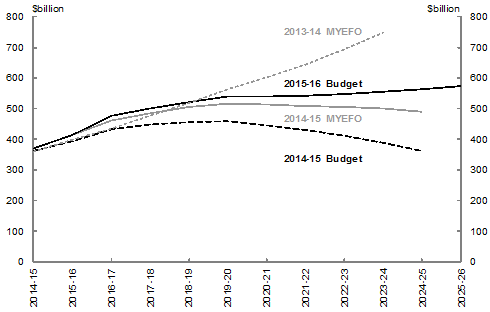
Relative to the 2014‑15 MYEFO, parameter and other variations have reduced tax receipts by $2.1 billion in 2014‑15, $5.9 billion in 2015‑16 and $20.1 billion over the four years to 2017‑18 (Chart 2). Excluding GST, parameter and other variations have reduced forecast tax receipts by $2.4 billion in 2014‑15, by around $5.8 billion in 2015‑16 and by around $20.4 billion over the four years to 2017‑18.
Source: Source: Treasury.
| Year | Personal income tax | Company tax | Other income taxes | Goods and services tax | Other indirect taxes | Total |
|---|---|---|---|---|---|---|
| 2014-15 | 0.1 | -1.0 | -1.0 | 0.3 | -0.6 | -2.1 |
| 2015-16 | -1.9 | -2.2 | -0.8 | -0.2 | -0.8 | -5.9 |
| 2016-17 | -2.6 | -1.8 | -0.4 | 0.1 | -1.4 | -6.1 |
| 2017-18 | -3.4 | -0.4 | -0.4 | 0.1 | -1.7 | -5.9 |
Source: Source: Treasury.
In aggregate, tax receipts are expected to grow by 3.9 per cent in 2014‑15 and 5.3 per cent in 2015‑16. At a disaggregated level, different heads of revenue are expected to grow at different rates, with some expected to experience negative growth.
Individuals and other withholding taxation receipts
Gross income tax withholding (ITW) receipts are forecast to grow by 6.5 per cent in 2014‑15 and 6.3 per cent in 2015‑16. Relative to the 2014‑15 MYEFO, more subdued wage growth has contributed to a downward revision to ITW receipts of around $8.6 billion over the four years to 2017‑18. This downward revision has been partly offset by new policy decisions, including the effect of the introduction of a cap for salary sacrificed meal entertainment and entertainment facility leasing expenses.
Gross receipts from other individuals (OI) are expected to grow by 8.1 per cent in 2014‑15 and 8.5 per cent in 2015‑16. Since the 2014‑15 MYEFO, OI receipts are expected to be $300 million higher in 2014‑15 but $2.4 billion lower over the four years to 2017‑18. The upward revision in 2014‑15 is a result of higher‑than‑expected collections in 2014‑15. This has been more than offset by slightly weaker expected income growth, for example interest income, over the four years to 2017‑18.
Income tax refunds for individuals, which have a negative effect on receipts, are expected to decrease by 0.4 per cent in 2014‑15 and grow by 2.6 per cent in 2015‑16. Relative to the 2014‑15 MYEFO, forecast refunds are $200 million lower (an increase in overall tax receipts) in 2014‑15 and $2.3 billion lower over the four years to 2017‑18. This downward revision has been driven by lower‑than‑expected payouts for refunds in 2014‑15, lower expected ITW receipts over the four years to 2017‑18 and new policy decisions, including better targeting the Zone Tax Offset to exclude 'fly‑in fly‑out' and 'drive‑in drive‑out' workers and modernising the methods used for calculating work related car expense deductions.
Fringe benefits tax
Receipts from fringe benefits tax (FBT) are forecast to grow by 6.7 per cent in 2014‑15 and 12.2 per cent in 2015‑16. The expected growth rate in 2015‑16 for FBT is driven by the Temporary Budget Repair Levy. Since the 2014‑15 MYEFO, FBT receipts are unchanged in 2014‑15 but are expected to be $80 million lower over the four years to 2017‑18. This downgrade to forecast FBT receipts reflects lower expected wage growth.
Company tax
Company tax receipts are forecast to grow by 1.1 per cent in 2014‑15 and by 0.3 per cent in 2015‑16. Compared to the 2014‑15 MYEFO, forecast receipts are expected to be $960 million lower in 2014‑15 owing to lower‑than‑expected collections from mining companies, consistent with a lower iron ore price since the 2014‑15 MYEFO. Over the four years to 2017‑18, company tax receipts have been revised down by $7.2 billion, reflecting lower expected corporate profitability including the impact of lower commodity prices on parts of the non‑mining corporate sector. Company tax receipts have also been affected by the tax cut for small business companies and the more generous depreciation arrangements.
Superannuation fund taxes
Receipts from superannuation funds are expected to grow by 0.6 per cent in 2014‑15 and 47.9 per cent in 2015‑16. The large growth in receipts in 2015‑16 is driven by large funds commencing monthly pay‑as‑you‑go instalments as announced in the 2013‑14 Budget and an expected continued recovery in capital gains tax receipts. Since the 2014‑15 MYEFO, receipts are expected to be around $900 million lower in 2014‑15 and $1.8 billion lower over the four years to 2017‑18, reflecting the flow on effects of lower taxable income in 2013‑14 and 2014‑15 as well as lower expected net contributions owing to weaker wages. The downward revision to superannuation fund receipts in 2014‑15 primarily reflects lower‑than‑expected collections attributable to higher‑than‑expected foreign exchange losses in the 2013‑14 income year. There are no detrimental superannuation taxation measures in this Budget.
Petroleum resource rent tax
Petroleum resource rent tax (PRRT) receipts are forecast to grow by 31.6 per cent in 2014‑15 and decline by 19.4 per cent in 2015‑16. Since the 2014‑15 MYEFO, PRRT receipts are expected to be $90 million lower in 2014‑15 and $790 million lower over the four years to 2017‑18, consistent with lower expected oil prices.
Goods and services tax
Receipts from GST are forecast to grow by 5.6 per cent in 2014‑15, underpinned by solid growth in private dwelling investment and property ownership transfer costs, and 5.6 per cent in 2015‑16 in line with expected growth in consumption subject to GST. Since the 2014‑15 MYEFO, GST receipts have been revised up $1.6 billion over the four years to 2017‑18, partly underpinned by the upward revision to the 2014‑15 estimate owing to stronger‑than‑expected collections, as well as 2015‑16 Budget measures including the extension of the GST compliance program and applying GST to digital products and services imported by consumers.
Excise and customs duty
Excise and customs duty receipts are forecast to decline by 4.3 per cent in 2014‑15 and grow by 1.5 per cent in 2015‑16. Excise and customs duty receipts have been revised down from the 2014‑15 MYEFO by $520 million in 2014‑15 and $4.5 billion over the four years to 2017‑18.
Over the four years to 2017‑18, receipts from fuel products (excluding crude oil) have been revised down, consistent with weaker forecast mining investment, economic activity and inflation. Crude oil excise has also been revised down, consistent with lower expected oil prices.
Lower forecasts for tobacco consumption have led to downward revisions to tobacco excise over the four years to 2017‑18.
Other sales taxes
Other sales taxes include the wine equalisation tax (WET) and the luxury car tax (LCT).
WET receipts are forecast to grow by 1.9 per cent in 2014‑15 and 5.1 per cent in 2015‑16. Since the 2014‑15 MYEFO, forecast WET receipts have been revised down by 1.8 per cent, or $60 million, over the four years to 2017‑18, consistent with slightly lower expected prices.
LCT receipts are forecast to grow by 7.7 per cent in 2014‑15 in line with stronger‑than‑expected sales of vehicles subject to LCT. Compared with the 2014‑15 MYEFO, over the four years to 2017‑18, LCT receipts have been revised up by $240 million.
Non‑taxation receipts
Non‑taxation receipts (including Future Fund earnings) are expected to grow by 17.8 per cent in 2014‑15 and grow by 7.7 per cent in 2015‑16. This largely relates to proceeds from the sale of spectrum licences.
Non‑taxation receipts have been revised up from the 2014‑15 MYEFO by $1.1 billion in 2015‑16 and $258 million over the four years to 2017‑18. This primarily reflects lower than expected forecasts of royalties, offset by increases in other non‑taxation receipts, including the $1.5 billion of unspent funding from the Victorian Government in relation to the East West Link project required to be returned consistent with the obligations under relevant agreements with the Commonwealth.
The changes in the individual heads of revenue relative to the 2014‑15 MYEFO are shown in Table 5 and Table 6 for 2014‑15 and 2015‑16 respectively.
Table 7 shows the Australian Government general government cash receipts from 2013‑14 to 2018‑19 by head of revenue.
| Estimates | Change on MYEFO | ||||
|---|---|---|---|---|---|
| MYEFO $m |
Budget $m |
$m | % | ||
| Individuals and other withholding taxes | |||||
| Gross income tax withholding | 166,700 | 166,300 | ‑400 | ‑0.2 | |
| Gross other individuals | 37,300 | 37,600 | 300 | 0.8 | |
| less: Refunds | 27,500 | 27,300 | ‑200 | ‑0.7 | |
| Total individuals and other withholding tax | 176,500 | 176,600 | 100 | 0.1 | |
| Fringe benefits tax | 4,350 | 4,350 | 0 | 0.0 | |
| Company tax | 68,960 | 68,000 | ‑960 | ‑1.4 | |
| Superannuation fund taxes | 7,040 | 6,140 | ‑900 | ‑12.8 | |
| Minerals resource rent tax(a) | 60 | 60 | 0 | 0.0 | |
| Petroleum resource rent tax | 1,890 | 1,800 | ‑90 | ‑4.8 | |
| Income taxation receipts | 258,800 | 256,950 | ‑1,850 | ‑0.7 | |
| Goods and services tax | 53,982 | 54,285 | 303 | 0.6 | |
| Wine equalisation tax | 800 | 780 | ‑20 | ‑2.5 | |
| Luxury car tax | 400 | 500 | 100 | 25.0 | |
| Excise and customs duty | |||||
| Petrol | 5,950 | 6,000 | 50 | 0.8 | |
| Diesel | 8,930 | 8,800 | ‑130 | ‑1.5 | |
| Other fuel products | 3,260 | 2,960 | ‑300 | ‑9.2 | |
| Tobacco | 8,310 | 8,280 | ‑30 | ‑0.4 | |
| Beer | 2,410 | 2,340 | ‑70 | ‑2.9 | |
| Spirits | 1,970 | 1,980 | 10 | 0.5 | |
| Other alcoholic beverages(b) | 950 | 910 | ‑40 | ‑4.2 | |
| Other customs duty | |||||
| Textiles, clothing and footwear | 590 | 650 | 60 | 10.2 | |
| Passenger motor vehicles | 800 | 700 | ‑100 | ‑12.5 | |
| Other imports | 1,570 | 1,600 | 30 | 1.9 | |
| less: Refunds and drawbacks | 420 | 420 | 0 | 0.0 | |
| Total excise and customs duty | 34,320 | 33,800 | ‑520 | ‑1.5 | |
| Carbon pricing mechanism | 1,800 | 1,630 | ‑170 | ‑9.4 | |
| Agricultural levies | 454 | 492 | 37 | 8.2 | |
| Other taxes | 3,038 | 3,016 | ‑23 | ‑0.7 | |
| Indirect taxation receipts | 94,794 | 94,502 | ‑292 | ‑0.3 | |
| Taxation receipts | 353,594 | 351,452 | ‑2,142 | ‑0.6 | |
| Sales of goods and services | 9,114 | 9,218 | 105 | 1.1 | |
| Interest received | 3,469 | 3,131 | ‑338 | ‑9.7 | |
| Dividends | 3,831 | 4,121 | 290 | 7.6 | |
| Other non‑taxation receipts | 9,475 | 9,386 | ‑89 | ‑0.9 | |
| Non‑taxation receipts | 25,889 | 25,856 | ‑33 | ‑0.1 | |
| Total receipts | 379,483 | 377,309 | ‑2,174 | ‑0.6 | |
| Memorandum: | |||||
| Total excise | 25,260 | 24,050 | ‑1,210 | ‑4.8 | |
| Total customs duty | 9,060 | 9,750 | 690 | 7.6 | |
| Capital gains tax(c) | 8,900 | 8,900 | 0 | 0.0 | |
| Medicare and DisabilityCare Australia levy | 14,130 | 14,050 | ‑80 | ‑0.6 | |
(a) Net receipts from the MRRT are expected to be $40 million in 2014‑15 which represents the net receipts impact across different revenue heads. This includes the offsetting reductions in company tax (through deductibility) and interactions with other taxes. The MRRT will not apply beyond 30 September 2014.
(b) Other alcoholic beverages are those not exceeding 10 per cent by volume of alcohol (excluding beer, brandy and wine).
(c) Capital gains tax is part of gross other individuals, company tax and superannuation fund taxes.
| Estimates | Change on MYEFO | ||||
|---|---|---|---|---|---|
| MYEFO $m |
Budget $m |
$m | % | ||
| Individuals and other withholding taxes | |||||
| Gross income tax withholding | 178,800 | 176,800 | ‑2,000 | ‑1.1 | |
| Gross other individuals | 41,100 | 40,800 | ‑300 | ‑0.7 | |
| less: Refunds | 28,100 | 28,000 | ‑100 | ‑0.4 | |
| Total individuals and other withholding tax | 191,800 | 189,600 | ‑2,200 | ‑1.1 | |
| Fringe benefits tax | 4,890 | 4,880 | ‑10 | ‑0.2 | |
| Company tax | 70,800 | 68,200 | ‑2,600 | ‑3.7 | |
| Superannuation fund taxes | 9,630 | 9,080 | ‑550 | ‑5.7 | |
| Minerals resource rent tax(a) | 0 | 0 | 0 | 0.0 | |
| Petroleum resource rent tax | 1,700 | 1,450 | ‑250 | ‑14.7 | |
| Income taxation receipts | 278,820 | 273,210 | ‑5,610 | ‑2.0 | |
| Goods and services tax | 57,468 | 57,316 | ‑153 | ‑0.3 | |
| Wine equalisation tax | 830 | 820 | ‑10 | ‑1.2 | |
| Luxury car tax | 360 | 450 | 90 | 25.0 | |
| Excise and customs duty | |||||
| Petrol | 6,150 | 6,100 | ‑50 | ‑0.8 | |
| Diesel | 9,340 | 9,110 | ‑230 | ‑2.5 | |
| Other fuel products | 3,150 | 2,840 | ‑310 | ‑9.8 | |
| Tobacco | 9,560 | 9,370 | ‑190 | ‑2.0 | |
| Beer | 2,470 | 2,390 | ‑80 | ‑3.2 | |
| Spirits | 2,030 | 2,030 | 0 | 0.0 | |
| Other alcoholic beverages(b) | 990 | 960 | ‑30 | ‑3.0 | |
| Other customs duty | |||||
| Textiles, clothing and footwear | 310 | 380 | 70 | 22.6 | |
| Passenger motor vehicles | 520 | 420 | ‑100 | ‑19.2 | |
| Other imports | 1,070 | 1,120 | 50 | 4.7 | |
| less: Refunds and drawbacks | 420 | 420 | 0 | 0.0 | |
| Total excise and customs duty | 35,170 | 34,300 | ‑870 | ‑2.5 | |
| Carbon pricing mechanism | 0 | 0 | 0 | 0.0 | |
| Agricultural levies | 478 | 472 | ‑6 | ‑1.3 | |
| Other taxes | 3,477 | 3,573 | 96 | 2.8 | |
| Indirect taxation receipts | 97,784 | 96,930 | ‑853 | ‑0.9 | |
| Taxation receipts | 376,604 | 370,140 | ‑6,463 | ‑1.7 | |
| Sales of goods and services | 9,202 | 9,475 | 274 | 3.0 | |
| Interest received | 4,022 | 3,334 | ‑688 | ‑17.1 | |
| Dividends | 3,407 | 4,623 | 1,216 | 35.7 | |
| Other non‑taxation receipts | 10,128 | 10,407 | 279 | 2.8 | |
| Non‑taxation receipts | 26,759 | 27,840 | 1,081 | 4.0 | |
| Total receipts | 403,362 | 397,980 | ‑5,382 | ‑1.3 | |
| Memorandum: | |||||
| Total excise | 26,860 | 24,820 | ‑2,040 | ‑7.6 | |
| Total customs duty | 8,310 | 9,480 | 1,170 | 14.1 | |
| Capital gains tax(c) | 11,300 | 11,500 | 200 | 1.8 | |
| Medicare and DisabilityCare Australia levy | 15,040 | 14,870 | ‑170 | ‑1.1 | |
(a) The MRRT will not apply beyond 30 September 2014.
(b) Other alcoholic beverages are those not exceeding 10 per cent by volume of alcohol (excluding beer, brandy and wine).
(c) Capital gains tax is part of gross other individuals, company tax and superannuation fund taxes.
| Actual | Estimates | Projections | ||||||
|---|---|---|---|---|---|---|---|---|
| 2013‑14 $m |
2014‑15 $m |
2015‑16 $m |
2016‑17 $m |
2017‑18 $m |
2018‑19 $m |
|||
| Individuals and other withholding taxes | ||||||||
| Gross income tax withholding | 156,211 | 166,300 | 176,800 | 187,600 | 199,600 | 213,800 | ||
| Gross other individuals | 34,787 | 37,600 | 40,800 | 43,900 | 48,000 | 52,600 | ||
| less: Refunds | 27,407 | 27,300 | 28,000 | 28,400 | 30,000 | 31,600 | ||
| Total individuals and other withholding tax | 163,592 | 176,600 | 189,600 | 203,100 | 217,600 | 234,800 | ||
| Fringe benefits tax | 4,077 | 4,350 | 4,880 | 5,090 | 4,920 | 5,160 | ||
| Company tax | 67,273 | 68,000 | 68,200 | 73,800 | 80,200 | 86,200 | ||
| Superannuation fund taxes | 6,101 | 6,140 | 9,080 | 10,530 | 11,210 | 11,760 | ||
| Minerals resource rent tax(a) | 143 | 60 | 0 | 0 | 0 | 0 | ||
| Petroleum resource rent tax | 1,368 | 1,800 | 1,450 | 1,450 | 1,400 | 1,400 | ||
| Income taxation receipts | 242,553 | 256,950 | 273,210 | 293,970 | 315,330 | 339,320 | ||
| Goods and services tax | 51,394 | 54,285 | 57,316 | 61,231 | 64,803 | 68,520 | ||
| Wine equalisation tax | 766 | 780 | 820 | 850 | 890 | 940 | ||
| Luxury car tax | 464 | 500 | 450 | 400 | 410 | 420 | ||
| Excise and customs duty | ||||||||
| Petrol | 6,053 | 6,000 | 6,100 | 6,250 | 6,600 | 7,000 | ||
| Diesel | 8,940 | 8,800 | 9,110 | 9,520 | 9,930 | 10,490 | ||
| Other fuel products | 3,624 | 2,960 | 2,840 | 2,840 | 2,930 | 3,050 | ||
| Tobacco | 8,498 | 8,280 | 9,370 | 10,180 | 10,410 | 10,720 | ||
| Beer | 2,348 | 2,340 | 2,390 | 2,500 | 2,640 | 2,770 | ||
| Spirits | 1,909 | 1,980 | 2,030 | 2,140 | 2,240 | 2,370 | ||
| Other alcoholic beverages(b) | 927 | 910 | 960 | 1,000 | 1,050 | 1,130 | ||
| Other customs duty | ||||||||
| Textiles, clothing and footwear | 789 | 650 | 380 | 290 | 210 | 180 | ||
| Passenger motor vehicles | 921 | 700 | 420 | 400 | 400 | 450 | ||
| Other imports | 1,631 | 1,600 | 1,120 | 1,010 | 990 | 1,090 | ||
| less: Refunds and drawbacks | 319 | 420 | 420 | 420 | 420 | 420 | ||
| Total excise and customs duty | 35,321 | 33,800 | 34,300 | 35,710 | 36,980 | 38,830 | ||
| Carbon pricing mechanism | 4,363 | 1,630 | 0 | 0 | 0 | 0 | ||
| Agricultural levies | 495 | 492 | 472 | 480 | 488 | 494 | ||
| Other taxes | 3,012 | 3,016 | 3,573 | 3,781 | 3,861 | 3,945 | ||
| Indirect taxation receipts | 95,815 | 94,502 | 96,930 | 102,452 | 107,432 | 113,149 | ||
| Taxation receipts | 338,368 | 351,452 | 370,140 | 396,422 | 422,762 | 452,469 | ||
| Sales of goods and services | 8,579 | 9,218 | 9,475 | 11,735 | 16,274 | 20,008 | ||
| Interest received | 3,128 | 3,131 | 3,334 | 3,537 | 3,692 | 4,069 | ||
| Dividends | 2,978 | 4,121 | 4,623 | 3,305 | 3,745 | 4,054 | ||
| Other non‑taxation receipts | 7,268 | 9,386 | 10,407 | 7,463 | 7,122 | 7,632 | ||
| Non‑taxation receipts | 21,954 | 25,856 | 27,840 | 26,040 | 30,833 | 35,764 | ||
| Total receipts | 360,322 | 377,309 | 397,980 | 422,461 | 453,595 | 488,233 | ||
| Memorandum: | ||||||||
| Total excise | 26,075 | 24,050 | 24,820 | 25,880 | 27,000 | 28,380 | ||
| Total customs duty | 9,246 | 9,750 | 9,480 | 9,830 | 9,980 | 10,450 | ||
| Capital gains tax(c) | 7,200 | 8,900 | 11,500 | 13,900 | 15,900 | 17,400 | ||
| Medicare and DisabilityCare Australia levy | 10,500 | 14,050 | 14,870 | 15,570 | 16,290 | 17,100 | ||
(a) Net receipts from the MRRT are expected to be $40 million in 2014‑15 which represents the net receipt impact across different revenue heads. This includes the offsetting reductions in company tax (through deductibility) and interactions with other taxes. The MRRT will not apply beyond 30 September 2014.
(b) Other alcoholic beverages are those not exceeding 10 per cent by volume of alcohol (excluding beer, brandy and wine).
(c) Capital gains tax is part of gross other individuals, company tax and superannuation fund taxes. The 2013‑14 reported figure is an estimate.