

Statement 7 (continued)
Forecasting performance
Macroeconomic forecasting performance
The Government's macroeconomic forecasts are prepared using a range of modelling techniques, including structural macroeconometric models and equations, spreadsheet analyses and accounting frameworks. These are supplemented by survey data, business liaison, expert opinion and judgment.
The differences between forecasts and outcomes (forecast errors) can arise for a range of reasons, for example differences between the assumed path of key variables and the outcome, or the relationship between different parts of the economy.
Confidence intervals are based on observed historical patterns of forecast errors. Confidence intervals show that there is a range of plausible outcomes around any given point estimate forecast. They are a guide to the degree of uncertainty around the forecast and, typically, span a wide range of outcomes.
Real GDP forecasts
Real GDP forecasts in the Budget are based on assumptions about the exchange rate, interest rates and oil prices. The forecasts incorporate judgments about how developments in one part of the Australian economy affect other parts, and how the domestic economy is affected by events in the international economy. The accuracy of the forecasts depends on the extent to which the assumptions and judgments underpinning them prove to be correct.
For example, a lower exchange rate than assumed would be expected to result in higher growth in Australia's export volumes, including in tourism and manufacturing. At the same time, import prices would be higher, resulting in lower growth in import volumes. Overall, this would lead to a larger contribution of net exports to economic growth, although there would be some mitigating effect on real GDP from the impact of higher import prices on real household income.
Forecast errors for real GDP can also result from unexpected shifts in economic activity between forecast years. For instance, economic growth can suddenly gain pace in an upswing, supported by a mutually reinforcing pick‑up in consumer spending, employment and investment.
A faster pick‑up in Australia's economic growth in 2015‑16 could be driven by stronger than forecast household consumption in response to rising housing and stock market wealth. Rising consumer spending could lead to higher employment growth, capacity utilisation and stronger investment. Stronger than expected growth in Australia's major trading partners could provide a fillip to exports and in turn boost incomes and demand throughout the economy.
More persistent shifts in the economy's supply side through changes in population, productivity or participation can also give rise to forecast errors. An illustrative scenario of the macroeconomic and fiscal effects of a one per cent increase in real GDP driven by an increase in labour productivity and labour force participation is presented later in this statement.
Over the past 20 years, Treasury's forecasts of real GDP growth have exhibited little evidence of bias, and accuracy has generally remained within a range of ½ to 1 percentage point (Chart 1). While forecasts of real GDP growth were less accurate in the years during and immediately after the global financial crisis (GFC), forecast errors have since returned to the usual range.
While National Accounts data are not yet available for the whole of 2014‑15, information to date suggests that real GDP growth is evolving broadly in line with last year's Budget forecast. This reflects some offsetting results at the component level, with stronger growth in export volumes, including non‑rural commodities, and lower growth in import volumes expected to balance slightly lower growth in household consumption. Other components of GDP, including business investment, have so far evolved largely as expected in 2014‑15.
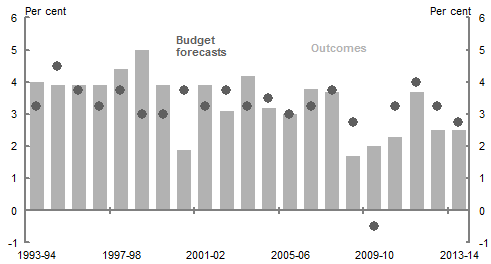
Note: Outcome is as published in the December quarter 2014 National Accounts. Forecast is that published in the Budget for that year.
Source: ABS cat. no. 5206.0 and Treasury.
Chart 2 shows that the average annualised growth rate in real GDP in the two years to 2015‑16 is expected to be around 2½ per cent, with the 70 per cent confidence interval ranging from 1¾ to 3½ per cent. In other words, if forecast errors are similar to those made over recent years, there is a 70 per cent probability that the growth rate will lie in this range.
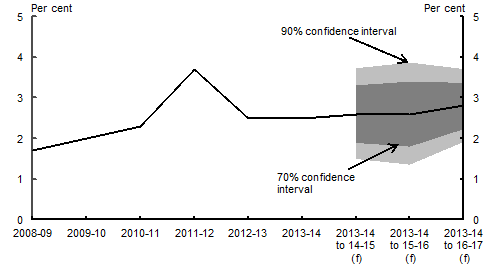
Note: The central line shows the outcomes and the 2015‑16 Budget forecasts. Annual growth rates are reported for the outcomes. Average annualised growth rates from 2013‑14 are reported for 2014‑15 onwards. (f) are forecasts. Confidence intervals are based on the root mean squared errors (RMSEs) of Budget forecasts from 1998‑99 onwards, with outcomes based on December quarter 2014 National Accounts data.
Source: ABS cat. no. 5206.0, Budget papers and Treasury.
Nominal GDP forecasts
Compared with real GDP forecasts, nominal GDP forecasts are subject to additional sources of uncertainty from the evolution of domestic prices and wages, and world prices for commodities.
Over the past decade, nominal GDP forecast errors have reflected the difficulties in predicting movements in global commodity prices (Chart 3). Faster than anticipated declines in the prices of key commodities in recent years, particularly iron ore, has meant that nominal GDP was overestimated.
In 2014‑15, nominal GDP growth is expected to be lower than forecast in last year's Budget. This primarily reflects the steeper than anticipated decline in key commodity prices over the past year, which has contributed to lower than forecast outcomes for the terms of trade and GDP deflator.
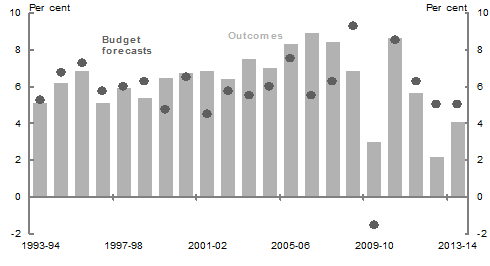
Note: Outcome is as published in the December quarter 2014 National Accounts. Forecast is that published in the Budget for that year.
Source: ABS cat. no. 5206.0 and Treasury.
The confidence intervals around nominal GDP forecasts are wider than those around the real GDP forecasts, reflecting both the uncertainty over the outlook for real GDP and the added uncertainty about the outlook for domestic prices and the terms of trade. Chart 4 suggests that the average annualised growth rate in nominal GDP growth in the two years to 2015‑16 is expected to be around 2¼ per cent, with the 70 per cent confidence interval ranging from 1 to 3¾ per cent.
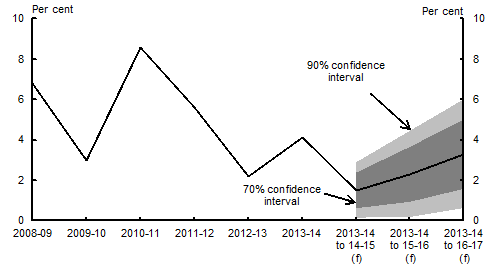
Note: See note to Chart 2.
Source: ABS cat. no. 5206.0, Budget papers and Treasury.
Fiscal forecasting performance
The fiscal estimates contained in the 2015‑16 Budget are based on forecasts of the economic outlook. Changes to the economic forecasts underpinning the estimates, for example, inflation, profits, wages growth, population and unemployment, will affect receipts, payments and therefore the profile of both the underlying cash balance and government debt. Even small movements in economic parameters can result in large changes to the budget estimates, for example, decreasing payments or increasing receipts with flow‑on effects to the underlying cash balance.
Major taxes such as company and individuals income taxes fluctuate significantly with economic activity. Capital gains tax (CGT) is particularly volatile and is affected by both the level of gains in asset markets and the timing of when those gains are realised. Similarly, superannuation fund taxes are affected by investment market returns.
Receipts forecasts are also affected by errors in translating the impact that changes in the economy have on tax collections, and other factors. Factors such as the timing of tax payments and enforcement activity can affect outcomes compared with forecasts.
The estimates and projections of receipts are subject to a number of general risks that can affect tax collections. These general risks include failure of the tax system to keep pace with changes in the business environment, tax avoidance, court decisions, Australian Taxation Office rulings and enforcement efforts. These pressures may result in a shift in the composition of taxation collected from the various tax bases and/or a change in the size of the tax base.
There are also a number of risks that may affect the payments estimates and projections. In particular, demand‑driven programmes, which form the bulk of the Government's payments, can fluctuate significantly with economic and social conditions. If changes to these conditions are not anticipated this can have major effects on payments levels. For example, an unexpected increase in the number of persons unemployed in the population could lead to additional welfare‑related payments.
Fiscal risks also include emergency foreign aid and natural disasters. Such occurrences have in the past resulted in unexpected increases in payments and may do so again. Specific fiscal risks to the budget and forward estimates are detailed in Budget Statement 8: Statement of Risks.
Receipts forecasts
The Government's tax receipts estimates are generally prepared using a 'base plus growth' methodology. The last known outcome (2013‑14 for the 2015‑16 Budget) is used as the base to which estimated growth rates are applied, resulting in tax receipts estimates for the current and future years.
Most of the indirect heads of revenue, such as GST and fuel excise, are forecast by mapping the growth rate of an appropriate economic parameter directly to the tax growth rate in the relevant head of revenue. A number of income taxes also involve determining whether this tax will be paid in the year the income is earned, such as for pay‑as‑you‑go withholding tax, or in future years, such as for individuals' refunds.
Over the past two decades, receipts forecasts have both under‑ and over‑predicted outcomes (Chart 5).
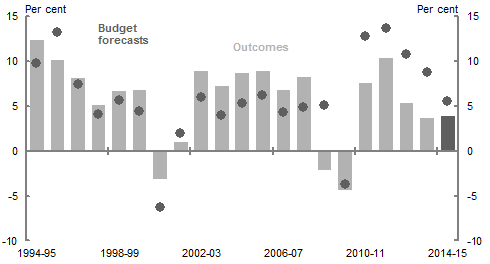
Note: Forecast error for 2014‑15 is an estimate.
Source: ABS cat. no. 5206.0, Budget papers and Treasury.
Generally, there is a strong correlation between the accuracy of the forecasts of the nominal economy and the forecasts for tax receipts. On average, economic forecasting errors will be magnified in receipts forecasting errors, owing to the progressive nature of personal income tax. Chart 6 plots the forecast errors for nominal non-farm GDP against the errors for tax receipts. It shows where there has been an underestimate of nominal non‑farm GDP growth, tax receipts tend to be underestimated and vice versa.
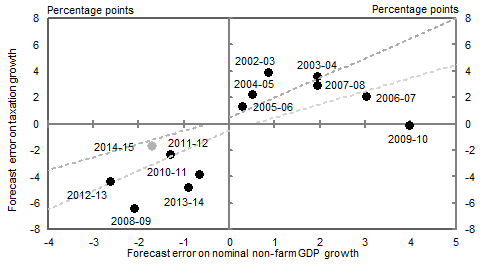
Note: The lower and upper lines are based on aggregate elasticities (of receipts with respect to nominal non‑farm GDP) of 1.0 and 1.5 respectively, assuming an error of plus or minus 0.5 per cent if there is zero error on the economic forecasts. Forecasting errors outside this range could be a result of factors such as timing of tax receipts. Forecast error for 2014‑15 is an estimate.
Source: ABS cat. no. 5206.0, Budget papers and Treasury.
The forecast for 2014‑15 tax receipts (excluding CGT) in the 2014‑15 Budget is expected to be an over‑estimate of around 1.7 percentage points, compared to an over‑estimate of around 1¾ percentage points for nominal non‑farm GDP growth.
The largest contributor to the expected forecasting error in 2014‑15 is from the shortfall in company tax. In 2014‑15, company tax is estimated to be $3.6 billion (5.0 percent) lower than in the 2014‑15 Budget. This overestimate of company tax is largely a result of lower than expected commodity prices, particularly iron ore.
Another significant contributor to the expected forecasting error for 2014‑15 is from gross income tax withholding which is estimated to be $3.1 billion (1.8 per cent) below the forecast of the 2014‑15 Budget as a result of lower than expected wage growth. Discussions of earlier years' forecast performance can be found in previous budgets.
From 2008‑09, forecasting errors in tax receipts have been affected significantly by the economic downturn following the GFC, particularly with regards to CGT (Chart 7).
tax receipts growth)
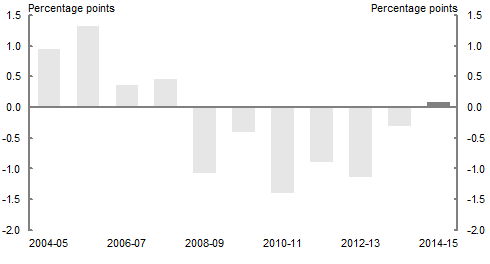
Note: Forecast error for 2014‑15 is an estimate.
Source: ABS cat. no. 5206.0, Budget papers and Treasury.
Forecasting CGT, in particular, is very difficult. First, unexpected price movements may cause CGT to be significantly different from the forecast. Secondly, CGT only applies to realised gains, so even in the absence of unexpected price movements, there may be more or less gains realised than was assumed.
Following the GFC, a large stock of capital losses were carried forward (see Box 2 of Statement 5 of the 2010‑11 Budget), and the utilisation of these losses continues to generate large uncertainty in both the timing and magnitude of the forecasts.
Chart 8 shows confidence intervals around the forecasts for receipts (excluding GST1 and including Future Fund earnings). Impacts of future policy decisions are beyond the scope of these forecasts. To account for this, confidence intervals constructed around the receipts forecasts exclude historical variations caused by subsequent policy decisions. These intervals take into account errors caused by parameter and other variations in isolation.
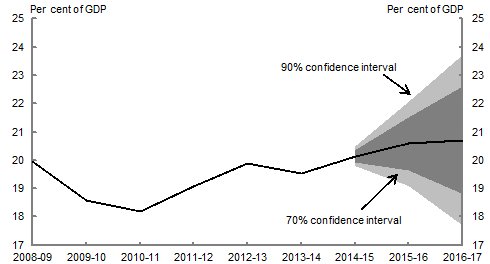
Note: The central line shows the outcomes and the 2015‑16 Budget point estimate forecasts. Confidence intervals use RMSEs for Budget forecasts from the 1998‑99 Budget onwards.
Source: Treasury.
The chart shows that there is considerable uncertainty around receipts forecasts and that this uncertainty increases over the estimates period. It suggests that in 2015‑16, the width of the 70 per cent confidence interval for the 2015‑16 Budget receipts forecast is approximately 1.9 per cent of GDP ($30 billion) and the 90 per cent confidence interval is approximately 3.0 per cent of GDP ($50 billion).
Payments
The Government's payments estimates are prepared by Australian Government agencies which comprise the Australian Government general government sector. An assessment of payments forecast performance is not included in this Statement, however, historical errors have been incorporated in estimated confidence intervals.
Chart 9 shows confidence intervals around payments forecasts (excluding GST). As with the receipts estimates, historical policy decisions are excluded,2 and future policy decisions are out of scope. The estimates include the public debt interest impact of policy decisions.3
The chart shows that there is moderate uncertainty around payments forecasts. In 2015‑16 the width of the 70 per cent confidence interval for the 2015‑16 Budget payments forecast is approximately 0.8 per cent of GDP ($15 billion) and the 90 per cent confidence interval is approximately 1.3 per cent of GDP ($20 billion).
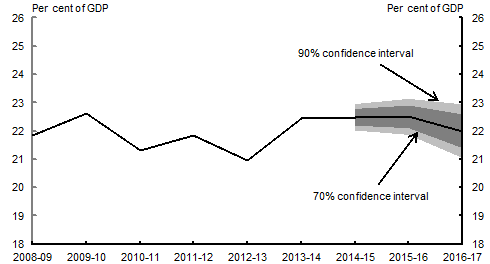
Note: See note to Chart 8.
Source: Treasury.
Payments outcomes can differ from forecasts for a number of reasons. Demand driven programs such as payments to individuals and some social services, form the bulk of Government expenditure. Forecasts of payments associated with a number of these government programs depend on forecasts of economic conditions. For example, higher than forecast unemployment levels will mean that expenditure on related services, including allowances, will be higher than anticipated.
Underlying cash balance
The underlying cash balance estimates are sensitive to the same forecasting errors that affect estimates of receipts and payments. Confidence interval analysis shows that there is considerable uncertainty around the underlying cash balance forecasts (see Chart 10).
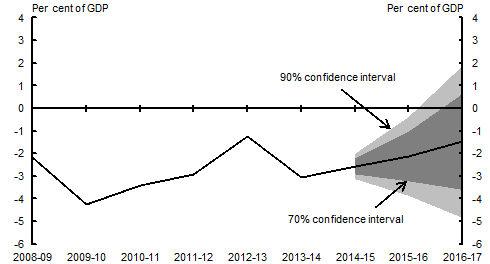
Note: See note to Chart 8.
Source: Treasury.
In 2015‑16, the width of the 70 per cent confidence interval for the 2015‑16 Budget underlying cash balance forecast is approximately 2.2 per cent of GDP ($35 billion) and the 90 per cent confidence interval is approximately 3.5 per cent of GDP ($60 billion). In line with receipts forecasts, uncertainty increases over the estimates period.
1 GST was not reported as a Commonwealth tax in budget documents prior to the 2008‑09 Budget. As a result, GST data have been removed from historical receipts and payments data to abstract from any error associated with this change in accounting treatment.
2 Excluding historical variations stemming from policy decisions does not exclude cases that are classified in budget documentation as parameter and other variations, but have more in common with decisions of government. For example, decisions to re‐profile spending due to changes in timing of projects are captured for reporting purposes as parameter and other variations, as are new and often substantial spending decisions to provide assistance for the impacts of natural disasters. Such variations contribute to the size of the confidence intervals around payments.
3 The impacts of past policy decisions on historical public debt interest through time cannot be readily identified or estimated. For this reason, no adjustment has been made to exclude these impacts from the analysis.