

Statement 7 (continued)
Scenario and sensitivity analysis
Small movements in economic parameters can result in large changes to the budget estimates, for example, increasing payments or reducing receipts can lead to wider deficits and ultimately changes in gross and net debt.
Consideration of particular scenarios and sensitivity analysis demonstrates the potential impact of these changes. This analysis highlights the trade‑offs that governments face should risks eventuate, for example, in choices about budget funding or meeting fiscal targets.
Fiscal sensitivity to permanent changes in key economic variables
The scenarios examine the effect on receipts and payments of altering some of the key economic assumptions. The economic scenarios provide a rule of thumb indication of the impact on receipts, payments and the underlying cash balance of changes in the economic outlook.
Scenario 1: One per cent reduction in nominal GDP
The following sensitivity analysis considers the consequences of a permanent fall in world prices of non‑rural commodity exports in 2015‑16 to examine the fiscal consequences of a reduction in nominal GDP. The price fall examined is consistent with a fall in the terms of trade of around 4 per cent, which causes a 1 per cent fall in nominal GDP by 2016‑17. The sensitivity analysis evaluates the flow-on effects on the economy, the labour market and prices. The impacts in Table 1 are stylised and refer to per cent deviations from the baseline levels of the economic parameters.
| 2015‑16 per cent |
2016‑17 per cent | |
|---|---|---|
| Real GDP | 0 | ‑ 1/4 |
| Non‑farm GDP deflator | ‑ 3/4 | ‑ 3/4 |
| Employment | ‑ 1/4 | ‑ 1/2 |
| Wages | 0 | ‑ 1/4 |
| CPI | 0 | ‑ 1/4 |
| Company profits | ‑3 | ‑3 |
| Consumption | ‑ 1/4 | ‑ 1/2 |
Assuming no change in exchange rates or interest rates, the fall in export prices leads directly to a lower non‑farm GDP deflator (from the export component of GDP) and lower domestic incomes. Lower domestic incomes cause both consumption and investment to fall, resulting in lower real GDP, employment and wages. The fall in aggregate demand puts downward pressure on domestic prices.
Given these assumptions, the overall impact of the fall in the terms of trade is a decrease in the underlying cash balance of around $2.9 billion in 2015‑16 and around $5.8 billion in 2016‑17 (see Table 2).
| 2015‑16 $b |
2016‑17 $b | |
|---|---|---|
| Receipts | ||
| Individuals and other withholding taxes | ‑0.6 | ‑1.7 |
| Superannuation fund taxes | ‑0.1 | ‑0.3 |
| Company tax | ‑1.8 | ‑3.3 |
| Goods and services tax | ‑0.1 | ‑0.3 |
| Excise and customs duty | ‑0.1 | ‑0.1 |
| Other taxes | ‑0.1 | ‑0.1 |
| Total receipts | ‑2.8 | ‑5.8 |
| Payments | ||
| Income support | ‑0.2 | ‑0.3 |
| Other payments | 0.0 | 0.1 |
| Goods and services tax | 0.1 | 0.3 |
| Total payments | ‑0.1 | 0.1 |
| Public debt interest | 0.0 | ‑0.1 |
| Underlying cash balance impact(a) | ‑2.9 | ‑5.8 |
(a) Estimated impacts fall within the 70 per cent confidence intervals for years 2015‑16 and 2016‑17, as shown in Charts 8 to 10.
On the receipts side, a fall in nominal GDP reduces tax collections. The largest impact is on company tax receipts as the fall in export income decreases company profits. Owing to lags in tax collections, the effect on company tax is larger in 2016‑17. Lower company profits are assumed to flow through to lower Australian equity prices, therefore reducing capital gains tax from individuals, companies and superannuation funds.
The weaker economy results in lower aggregate demand, which flows through to lower employment and wages, reducing individuals income tax receipts. The decrease in disposable incomes leads to lower consumption, which in turn results in a decrease in GST receipts (decreasing GST payments to the states by the same amount) and other indirect taxes.
On the payments side, a significant proportion of government expenditure is partially indexed to movements in costs (as reflected in various price and wage measures). Some forms of expenditure, in particular income support payments, are also driven by the number of beneficiaries.
The overall estimated expenditure on income support payments (including pensions and allowances) increases in both years because of a higher number of unemployment benefit recipients. The increase in spending on unemployment benefits in 2016‑17 is partly offset by reduced expenditure on pensions and allowances reflecting lower growth in benefit rates resulting from lower wages growth and lower inflation. At the same time other payments linked to inflation fall in line with the reduced growth in prices.
The reduction in the underlying cash balance results in a higher borrowing requirement and a higher public debt interest cost.
While not taken into account in this scenario, under a floating exchange rate, a fall in the terms of trade would be expected to lead to a fall in the exchange rate. This would likely dampen the effects on real GDP, meaning the impact on the fiscal position could be substantially more subdued. Also, to the extent that the fall in the terms of trade is temporary rather than permanent, the impact on the economic and fiscal position would be more subdued.
Scenario 2: One per cent increase in real GDP driven by an increase in labour productivity and labour force participation with each contributing equally
As discussed above, the budget forecasts also depend on assumptions about the economy's supply side. If the outcomes for population, productivity and participation differ from what was assumed, then so may the budget outcomes.
This scenario involves a permanent 0.5 per cent increase in both the participation rate and labour productivity, resulting in a 1 per cent increase in real GDP from 2015‑16. Once again, the sensitivity analysis evaluates the flow‑on effects on the economy, the labour market and prices. The impacts in Table 3 are stylised and refer to per cent deviations from the baseline levels of the parameters.
| 2015‑16 per cent |
2016‑17 per cent | |
|---|---|---|
| Nominal GDP | 3/4 | 3/4 |
| Non‑farm GDP deflator | ‑ 1/4 | ‑ 1/4 |
| Employment | 1/2 | 1/2 |
| Wages | 1/4 | 1/4 |
| CPI | ‑ 1/4 | ‑ 1/4 |
| Company profits | 1 3/4 | 1 3/4 |
| Consumption | 1 | 1 |
The one per cent increase in real GDP increases nominal GDP by slightly less but the magnitude of the effects on receipts, payments and the underlying cash balance differ from the first scenario because different parts of the economy are affected in different ways.
The increases in labour force participation and labour productivity have the same impact on output, but different impacts on the labour market. Higher productivity leads to higher real GDP and higher real wages, while an increase in the participation rate increases employment and real GDP. Imports are higher in this scenario, reflecting higher domestic incomes.
Since the supply side of the economy expands, inflation temporarily falls relative to the baseline. The lower domestic prices make exports more attractive to foreigners, with the resulting increase in exports offsetting higher imports, leaving the trade balance unchanged. The exchange rate is assumed to be unchanged.
The overall impact of the increase in labour productivity and participation is an increase in the underlying cash balance of around $3.7 billion in 2015‑16 and around $4.5 billion in 2016‑17 (see Table 4).
| 2015‑16 $b |
2016‑17 $b | |
|---|---|---|
| Receipts | ||
| Individuals and other withholding taxes | 1.9 | 1.7 |
| Superannuation fund taxes | 0.1 | 0.2 |
| Company tax | 1.2 | 1.8 |
| Goods and services tax | 0.5 | 0.6 |
| Excise and customs duty | 0.4 | 0.4 |
| Other taxes | 0.0 | 0.0 |
| Total receipts | 4.1 | 4.7 |
| Payments | ||
| Income support | 0.0 | 0.2 |
| Other payments | 0.1 | 0.1 |
| Goods and services tax | ‑0.5 | ‑0.6 |
| Total payments | ‑0.4 | ‑0.3 |
| Public debt interest | 0.0 | 0.1 |
| Underlying cash balance impact(a) | 3.7 | 4.5 |
(a) Estimated impacts fall within the 70 per cent confidence intervals for years 2015‑16 and 2016‑17, as shown in Charts 8 to 10.
On the receipts side, individuals income tax collections increase because of the rise in the number of wage earners and, additionally, higher real wages. The stronger labour market also increases tax collections from superannuation funds because contributions (including compulsory contributions) are higher. The increase in personal incomes leads to higher consumption which results in an increase in GST receipts (with the corresponding receipts passed on in higher GST payments to the states). In addition, the stronger economy results in higher levels of corporate profitability, increasing company taxes.
On the payments side, overall estimated expenditure on income support payments (including pensions, unemployment benefits and other allowances) is lower, reflecting lower growth in benefit rates through indexation due to lower inflation (as measured by the Consumer Price Index).6 This effect is partly offset by growth in the number of unemployment benefit recipients (as higher labour force participation increases both employment and the number unemployed).
On balance, the rise in estimated tax collections is only partially offset by increased payments. This improves the underlying cash position, which results in a lower borrowing requirement and lower public debt interest cost.
The impacts shown in the Tables 1 to 4 above are broadly symmetrical. That is, impacts of around the same magnitude, but in the opposite direction, would apply if the terms of trade were to increase or if real GDP were to decrease.
Impact on the balance sheet of economic and fiscal developments
This section outlines in broad terms the impact on the balance sheet of economic and fiscal shocks.
The impact of a terms of trade shock was outlined earlier in this statement (see Tables 1 and 2). In these circumstances, receipts fall and payments increase, leading to a decline in the budget position. To fund a higher deficit, assets would need to be run down or borrowings would need to increase through the issuance of more Commonwealth Government Securities (CGS). This would increase the CGS liability, and interest payments would be higher until the Government repaid this debt.
A weaker economic environment also increases the likelihood of contingent liabilities (for example, guarantees) crystallising or defaults on loans, resulting in higher liabilities and an increase in payments. Details of contingent liabilities are set out in Statement 8.
Alternatively, an improvement in economic conditions would see receipts improve and payments fall, as outlined earlier in this statement, strengthening the budget position. In these circumstances, borrowings could be reduced, and with reduced borrowings, interest payments would be lower.
Some balance sheet items are required to be recorded at market value, for example, the investments of the Future Fund. The market valuation of these items is therefore susceptible to price fluctuations. Market movements may therefore have a temporary impact on the strength of the balance sheet. Movements in interest rates affect the recorded market value of the Government's CGS liability, even though interest rates payable are determined at the time of issuance. For example, lower interest rates that may be used to stimulate the economy will contribute to a higher market value of the liability.
Medium‑term projections scenarios
The medium‑term projections set out in this Budget are not equivalent to forecasts. The medium‑term projections use the forward estimates as a base. They are therefore subject to similar risks and uncertainties that affect the fiscal aggregates discussed above, although the longer timeframes mean even greater uncertainty.
Beyond the forward estimates, a range of simplifying assumptions are used to project government payments, with the main drivers being movements in prices, economic growth, the size and structure of the population and the expected per person costs (in each age bracket) of major government programs based on current Government policy. In this context, it is important to note that the projections are very unlikely to unfold exactly as outlined. There will be changes over the projection period that are not anticipated in the underlying assumptions, and government policy will change.
Relatively small changes to assumptions underpinning these projections can have a significant effect on projections of the key fiscal aggregates including the underlying cash balance and CGS on issue (otherwise known as gross debt) by the end of the projection period.
This section outlines the impact on the underlying cash balance and CGS on issue of two alternative assumptions. The first scenario considers the impact on public debt interest costs of higher interest rate assumptions than adopted in the 2015‑16 Budget estimates. The second considers the impact of slower than expected payments growth after the end of the forward estimates.
Scenario 1: Higher yield assumptions
Future borrowing costs are determined by interest rates on Government bonds (that is, bond yields) at the time of issuance. Significant levels of CGS are expected to be issued in current years. This is both to finance projected cash deficits, as well as to refinance maturing debt.
This debt issuance requirement means that an increase in yields from current rates would lead to an increase in public debt interest costs.
Government bond yields have recently been at historically low levels. On 30 April 2015, the yield on 10‑year Treasury bonds was 2.6 per cent, compared with 3.1 per cent at the time of the 2014‑15 Mid‑Year Economic and Fiscal Outlook (MYEFO). At the 2008‑09 Budget, the interest rate on 10‑year Treasury bonds was over 6 per cent.
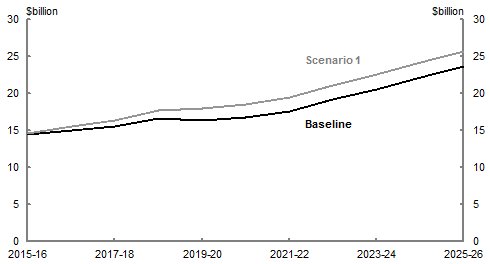
Chart 11 shows public debt interest costs to 2025‑26 under the yield assumptions for the 2015‑16 Budget, compared with the higher yield assumptions at the 2014‑15 MYEFO. The chart shows that if the 2014‑15 MYEFO yield assumption were applied to borrowings estimated in the 2015‑16 Budget, public debt interest costs would be $1.1 billion higher by 2018‑19, and $2.1 billion higher by 2025‑26.
the medium term
Source: Treasury projections.
The increase in public debt interest costs would increase payments, and therefore lead to a deterioration in the underlying cash balance. This would flow through to further borrowings, increasing CGS on issue and net debt. A return of the yield curve to levels closer to historical averages would be expected to lead to even larger increases in public debt interest costs.
Scenario 2: Slower than anticipated payments growth
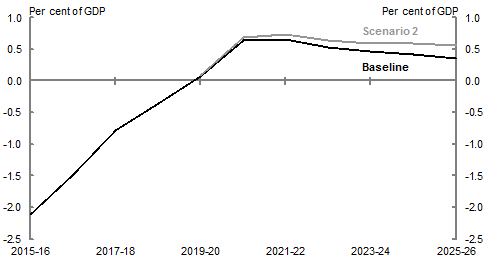
The rate of payments growth affects the underlying cash balance over time. This may be driven by changes in demand for particular programs, or changes in the cost of those programs, for example, wages growth. This scenario shows the impact of 10 per cent of total government payments growing 1 per cent slower than expected, after the end of the forward estimates. The impact of this scenario on the underlying cash balance is illustrated in Chart 12.
the medium‑term
Source: Treasury projections.
Chart 12 shows that the underlying cash balance would improve, and be higher by 0.2 per cent of GDP by 2025‑26, compared with the baseline scenario. This incorporates the benefits from lower public debt interest costs, projected to be $1.1 billion lower in 2025‑26 compared with the baseline scenario.
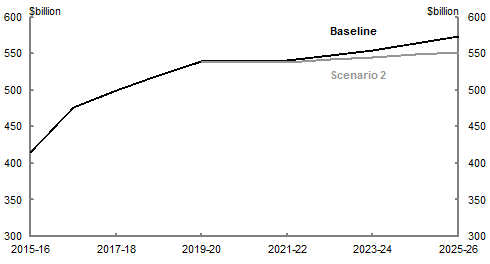
The improvement in the underlying cash balance as a result of slower payments growth would also have an effect on the total face value of CGS on issue (see Chart 13). This scenario would be projected to lead to a decrease in the total face value of CGS on issue of $21 billion compared with the baseline scenario.
growth over the medium term
Source: Treasury projections.
The impact of a scenario in which a proportion of government payments grows faster than currently projected is broadly symmetrical. That is, the impact is around the same magnitude, but in the opposite direction.
4 These results represent a partial economic analysis only and do not attempt to capture all the economic feedback and other policy responses related to changed economic conditions, and assume no change in the exchange rate, interest rates or policy over the forecast period.
5 See footnote 4.
6 Under existing indexation arrangements, the growth in wages (average weekly earnings) has historically been the key driver of the growth in benefit rates for pensions and similar payments. However, with recent subdued wages growth, the key driver is currently indexation of benefit rates to growth in the CPI.