
Statement 2: Economic Outlook (continued)
Outlook for the international economy
Australia is still a relatively small, open economy and trade and foreign investment continue to be very important to our economic outlook. Exports and imports, which together represent around 40 per cent of GDP, tangibly demonstrate the importance of global markets to future economic growth. The Australian economy has also always relied on capital from overseas to take full advantage of its resources.
Expectations for global growth have moderated over the course of 2016 and are lower than at the 2015‑16 MYEFO, with lower growth forecast for the United States and economic difficulties in a number of commodity exporting countries weighing on the outlook.
Monetary policy settings remain accommodative in advanced economies reflecting low inflation and a weaker growth outlook. The Bank of Japan moved to supplement its quantitative easing programme with negative interest rates on excess bank reserves in early 2016, while the European Central Bank has recently expanded its easing measures. By contrast, the United States Federal Reserve raised interest rates in December 2015 for the first time in more than nine years. A divergence of monetary policy stances across major advanced economies may pose challenges for emerging market economies, with any downward pressure on their currencies making servicing foreign debt more costly. That said, since the United States Federal Reserve's initial step to normalise its monetary policy settings, markets have scaled back expectations for a further rate rise in 2016. The longer‑term impact of negative interest rates remains uncertain.
Significant shifts are underway in the international economy. The output of emerging market economies has exceeded advanced economies since 2008. China's share of world GDP has grown continuously from 4 per cent in 1990 to 17 per cent in 2015. India is the world's fastest growing major economy and its share of world GDP is expected to continue to grow, driven by a rising working‑age population.
The International Monetary Fund (IMF) has reduced its estimates of medium‑term potential growth for both advanced and emerging economies. The softer outlook reflects unresolved crisis legacies, low productivity growth and unfavourable demographics (particularly in advanced economies).
Commodity prices have recovered somewhat since the 2015‑16 MYEFO, but remain well below recent peaks. Increases in supply and lower growth in demand, particularly from China, will continue to place downward pressure on prices. Global growth is expected to be supported by continued low energy prices, but the consumer and business response to lower petrol prices has so far been more muted than in the past.
Lower commodity prices and moderating growth in China are having a significant impact on global investment and trade. Investment growth in China is slowing, while lower commodity prices are also contributing to reduced investment in mining projects and exploration globally. The IMF estimates that investment spending in the oil and gas sector in major energy exporting economies has fallen 24 per cent in 2015 relative to a year earlier in US dollar terms. Investment is typically more import intensive than consumption, and slower investment growth has put downward pressure on global trade. Since the 2015‑16 MYEFO, global trade is showing signs of a pick up, although growth remains relatively low.
Inflation remains low globally reflecting, in part, the impact of low energy costs and excess capacity in many countries. In major advanced economies, inflation remains below policy targets, and this is expected to remain the case for at least the near term. Low wage growth has also contributed to low inflation in major advanced economies. In some countries, including the United States and the United Kingdom, wage growth has been relatively low despite robust employment growth.
The risks to growth are broadening and are evident in both advanced and emerging economies. The uncertainties around the implications of the transition task ahead of the Chinese economy from investment‑led to consumption‑led growth are particularly significant for Australia given the exposure both Australia and its major trading partners have to China.
There is also a risk that the low inflation, low wage growth and low productivity growth being experienced in many advanced economies could become embedded in lower potential growth over time.
Globally, banks are better capitalised than they were prior to the global financial crisis. But a number of major economies continue to face financial challenges, particularly the euro area, Japan and a range of emerging market economies. Additionally, there are risks if the renewed volatility in financial markets seen at the start of 2016 were to re‑emerge. There are concerns in equity and credit markets as to whether global growth will be strong enough to drive corporate earnings and maintain low default rates in order to sustain current valuations.
| Outcomes | Forecasts | ||||
|---|---|---|---|---|---|
| 2015 | 2016 | 2017 | 2018 | ||
| China | 6.9 | 6 1/2 | 6 1/4 | 6 | |
| India | 7.3 | 7 1/2 | 7 1/2 | 7 3/4 | |
| Japan | 0.5 | 1/2 | 1/4 | 1/2 | |
| United States | 2.4 | 2 | 2 1/4 | 2 1/4 | |
| Euro area | 1.6 | 1 1/2 | 1 1/2 | 1 1/2 | |
| Other East Asia(a) | 3.7 | 4 | 4 | 4 1/4 | |
| Major trading partners | 4.0 | 4 | 4 | 4 | |
| World | 3.1 | 3 1/4 | 3 1/2 | 3 3/4 | |
(a) Other East Asia comprises the newly industrialised economies of Hong Kong, South Korea, Singapore and Taiwan and the Association of Southeast Asian Nations group of five (ASEAN‑5), comprising Indonesia, Malaysia, the Philippines, Thailand and Vietnam.
Note: World, euro area and other East Asia growth rates are calculated using GDP weights based on purchasing power parity (PPP), while growth rates for major trading partners are calculated using export trade weights.
Source: National Statistical Agencies, IMF World Economic Outlook April 2016, Thomson Reuters and Treasury.
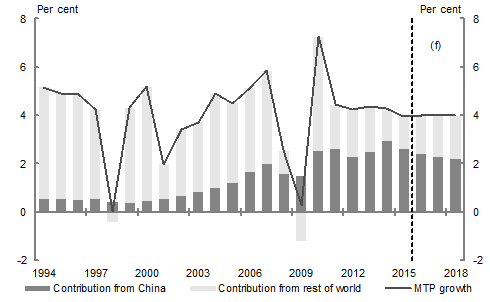
The outlook for growth in Australia's major trading partners is of particular importance to domestic economic activity. Australia's major trading partner growth is forecast to remain higher than global growth, at 4 per cent across the forecast period (Chart 1). This reflects Australia's trade links to Asia, where growth remains relatively strong.
Source: ABS cat. no. 5368.0, IMF April 2016 World Economic Outlook and Treasury.
Note: MTP growth aggregated using Australia's export shares.
| MTP growth | Contribution from China | Contribution from rest of world | |
|---|---|---|---|
| 1994 | 5.2 | 0.6 | 4.6 |
| 1995 | 4.9 | 0.5 | 4.4 |
| 1996 | 4.9 | 0.5 | 4.4 |
| 1997 | 4.2 | 0.5 | 3.7 |
| 1998 | 0.0 | 0.4 | -0.4 |
| 1999 | 4.3 | 0.4 | 3.9 |
| 2000 | 5.2 | 0.5 | 4.7 |
| 2001 | 2.0 | 0.5 | 1.4 |
| 2002 | 3.4 | 0.7 | 2.8 |
| 2003 | 3.7 | 0.8 | 2.9 |
| 2004 | 4.9 | 1.0 | 3.9 |
| 2005 | 4.5 | 1.2 | 3.3 |
| 2006 | 5.1 | 1.7 | 3.5 |
| 2007 | 5.9 | 2.0 | 3.8 |
| 2008 | 2.5 | 1.6 | 1.0 |
| 2009 | 0.3 | 1.5 | -1.2 |
| 2010 | 7.3 | 2.5 | 4.7 |
| 2011 | 4.4 | 2.6 | 1.8 |
| 2012 | 4.2 | 2.3 | 1.9 |
| 2013 | 4.4 | 2.5 | 1.9 |
| 2014 | 4.3 | 2.9 | 1.3 |
| 2015 | 4.0 | 2.6 | 1.4 |
| 2016 | 4.0 | 2.5 | 1.5 |
| 2017 | 4.0 | 2.3 | 1.8 |
| 2018 | 4.0 | 2.3 | 1.8 |
Growth in China is moderating as the economy transitions towards a more balanced growth model that is increasingly reliant on consumption and services and less on investment (see Box 1). The Chinese authorities are targeting growth of between 6½ and 7 per cent for 2016, down from a target of around 7 per cent for 2015. China is forecast to grow at 6½ per cent in 2016, 6¼ per cent in 2017 and 6 per cent in 2018.
Despite moderating growth, China is expected to continue to make a sizeable contribution to global growth. The Chinese economy is now more than twice the size it was in 2006 and as a result, growth of just below 7 per cent in 2015 equates to growth of more than 13 per cent in 2006.
A key risk to the global economy is that China's transition does not proceed smoothly. China is one of the main trading partners for more than 100 economies. These economies account for about 80 per cent of world GDP, and a larger‑than‑expected slowdown in China's economy would have a significant impact globally.
Box 1: Economic transitions — China and Australia
A period of extraordinary growth has made China one of the largest economies in the world. Australia benefited significantly as demand for Australia's commodities surged, leading to a record increase in mining investment in order to expand capacity. Australia is now benefiting from increasing commodity exports.
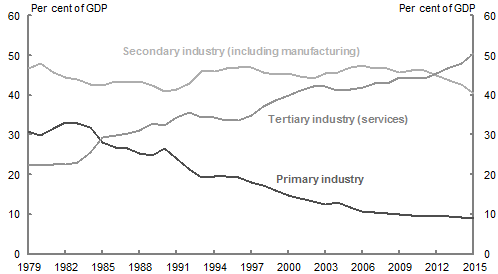
China is entering a new stage of development, which the authorities have characterised as the 'new normal'. The Chinese economy now faces the task of transitioning to a more balanced growth model. Unlike recent decades, growth will increasingly be driven by consumption and services, and be less reliant on investment.
Since 2011, nominal consumption growth has outstripped nominal GDP growth and, in a country that has traditionally been an important global manufacturing producer, the service sectors now contribute over 50 per cent of GDP (Chart A).
Source: CEIC China database.
| Year | Primary Industry | Secondary Industry | Tertiary Industry |
|---|---|---|---|
| 1979 | 30.9 | 46.8 | 22.3 |
| 1980 | 29.9 | 47.9 | 22.2 |
| 1981 | 31.6 | 45.8 | 22.6 |
| 1982 | 33.0 | 44.5 | 22.5 |
| 1983 | 32.8 | 44.1 | 23.1 |
| 1984 | 31.8 | 42.8 | 25.5 |
| 1985 | 28.1 | 42.6 | 29.3 |
| 1986 | 26.8 | 43.4 | 29.8 |
| 1987 | 26.5 | 43.2 | 30.3 |
| 1988 | 25.4 | 43.4 | 31.2 |
| 1989 | 24.7 | 42.4 | 32.9 |
| 1990 | 26.7 | 40.9 | 32.4 |
| 1991 | 24.2 | 41.4 | 34.5 |
| 1992 | 21.4 | 43.0 | 35.6 |
| 1993 | 19.4 | 46.1 | 34.5 |
| 1994 | 19.5 | 46.1 | 34.4 |
| 1995 | 19.7 | 46.7 | 33.7 |
| 1996 | 19.4 | 47.0 | 33.6 |
| 1997 | 18.0 | 47.0 | 35.0 |
| 1998 | 17.2 | 45.7 | 37.1 |
| 1999 | 16.1 | 45.3 | 38.6 |
| 2000 | 14.7 | 45.4 | 39.8 |
| 2001 | 14.1 | 44.7 | 41.3 |
| 2002 | 13.4 | 44.3 | 42.3 |
| 2003 | 12.4 | 45.5 | 42.1 |
| 2004 | 13.0 | 45.8 | 41.2 |
| 2005 | 11.7 | 46.9 | 41.4 |
| 2006 | 10.7 | 47.4 | 41.9 |
| 2007 | 10.4 | 46.7 | 42.9 |
| 2008 | 10.3 | 46.8 | 42.9 |
| 2009 | 9.9 | 45.7 | 44.4 |
| 2010 | 9.6 | 46.2 | 44.2 |
| 2011 | 9.5 | 46.1 | 44.3 |
| 2012 | 9.5 | 45.0 | 45.5 |
| 2013 | 9.4 | 43.7 | 46.9 |
| 2014 | 9.2 | 42.7 | 48.1 |
| 2015 | 9.0 | 40.5 | 50.5 |
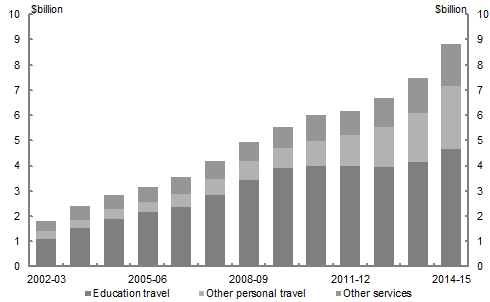
China's economic transition presents significant opportunities for Australia. Demand for Australian goods and services is expected to benefit from China's rising middle class, which according to some estimates is expected to grow to more than 850 million people by 2030. Australia's service exports have seen a substantial rise, with China now Australia's largest service export destination. China is also Australia's second largest source of overseas visitors, with the number of tourists exceeding one million for the first time in 2015.
The growing investment relationship between Australia and China is also bringing opportunities. Continued Chinese investment into Australia will be a key enabler of the ongoing trade relationship as Australia's export base broadens.
Through the China‑Australia Free Trade Agreement, China will further open its economy to Australian businesses by removing or reducing market access barriers in a range of sectors, including health, financial and legal services (Chart B).
Source: ABS cat. no. 5368.0.55.003.
| Education travel ($million) | Other personal travel ($million) | Other services ($million) | |
|---|---|---|---|
| 2002-03 | 1,110 | 297 | 424 |
| 2003-04 | 1,528 | 333 | 558 |
| 2004-05 | 1,894 | 403 | 565 |
| 2005-06 | 2,172 | 414 | 585 |
| 2006-07 | 2,383 | 495 | 688 |
| 2007-08 | 2,836 | 660 | 708 |
| 2008-09 | 3,440 | 762 | 732 |
| 2009-10 | 3,911 | 813 | 813 |
| 2010-11 | 3,995 | 1,008 | 1,028 |
| 2011-12 | 3,992 | 1,222 | 980 |
| 2012-13 | 3,958 | 1,587 | 1,146 |
| 2013-14 | 4,175 | 1,909 | 1,426 |
| 2014-15 | 4,694 | 2,477 | 1,662 |
China's economic transition is expected to contribute to more sustainable growth over the longer term. But in the near to medium term, increasing consumption and rising service sectors are unlikely to fully offset the decline in investment and a slowing industrial sector. The key risks to China's transition are its current industrial overcapacity and domestic debt challenges. Effectively managing these risks will be important in ensuring a smooth rebalancing of the economy.
India was the fastest growing major economy in 2015 and is expected to remain so over the forecast period. Growth is forecast to be 7½ per cent in 2016 and 2017, rising to 7¾ per cent in 2018, supported by low commodity prices and strengthening domestic demand. Inflation has halved since 2012, assisted by weak global inflation, falling commodity prices and the adoption of inflation targeting by the Reserve Bank of India. Other reforms to improve business conditions are also in progress, including the removal of some subsidies (including for fuel), more efficient delivery of other subsidies and relaxation of foreign investment rules.
Already the world's third largest economy in purchasing power parity terms, India will benefit from the largest and youngest workforce in history, with a working age population projected to reach one billion by 2030. This demographic dividend will drive growth and expand India's demand for imports, including from Australia.
Growth in the United States is forecast to remain moderate. The United States recovery will continue to be led by the household sector, supported by lower energy costs. Business investment is soft, in part due to a drag from energy sector investment, and a high US dollar is weighing on exports. Following a slow start to this year, the United States is forecast to grow at 2 per cent in 2016, with growth rising to 2¼ per cent in both 2017 and 2018, lower than at the 2015‑16 MYEFO. Despite a slowing in GDP growth, and recent job losses in the manufacturing sector, the labour market is expected to continue to absorb discouraged or underutilised workers.
The recovery in the euro area is forecast to remain modest. Growth will be supported by accommodative monetary policy and lower energy prices. Relatively low levels of investment and weaker global growth are weighing on growth prospects. Euro area growth is forecast to be 1½ per cent in 2016, 2017 and 2018.
Geopolitical tensions and political risk will also weigh on the outlook for the euro area and recent migration flows into Europe are presenting challenges. The expansionary fiscal policy needed to accommodate migrants, and their gradual integration into the labour market, may support growth in the shorter term. The possibility that the United Kingdom may exit the European Union, with the vote on 'Brexit' scheduled for June 2016, is adding to economic uncertainty in the euro area given the deep trade and financial links between the bloc and the United Kingdom.
Growth in Japan is expected to be subdued through to 2018. Weaker growth in the second half of 2015 and sluggish increases in wages are weighing on the outlook. Further, the recent appreciation of the yen, coinciding with slower global growth, is also weighing on prospects for Japanese exports.
The impact of the Bank of Japan's move to supplement its quantitative easing programme with negative interest rates on excess bank reserves is still unclear. While consumption growth is expected to be lifted by low energy prices, the scheduled increase in the consumption tax rate is expected to detract from growth in 2017.
Growth in the ASEAN‑5 grouping has been relatively slow by historical standards, partly reflecting changes to its external environment, including China's transition and lower regional trade growth. In Indonesia, the largest economy of the ASEAN‑5 grouping, growth in 2015 was affected by softer external demand and lower commodity prices. From 2016 domestic consumption coupled with higher public infrastructure spending is expected to support growth.