
Statement 2: Economic Outlook (continued)
Outlook for the domestic economy
Outlook for real GDP growth
The Australian economy continues its transition to broader‑based growth. In 2011‑12 mining investment contributed 2.8 percentage points to GDP growth. In 2015‑16 it is expected to detract 1½ percentage points from growth. Household consumption, dwelling investment and exports are supporting near‑term economic activity, and there has been strong employment growth, particularly in the service sectors.
The Australian economy is expected to grow at 2½ per cent in both 2015‑16 and 2016‑17 before strengthening to 3 per cent growth in 2017‑18 as the detraction from falling mining investment eases (Chart 2).
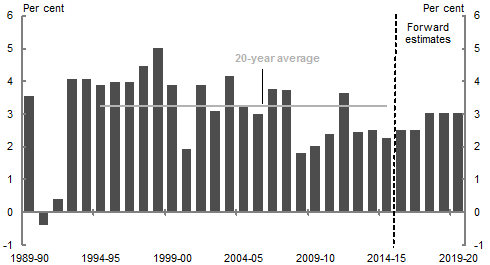
Source: ABS cat. no. 5206.0 and Treasury.
| Year average growth | 20-year average | |
|---|---|---|
| 1989-90 | 3.5 | |
| 1990-91 | -0.4 | |
| 1991-92 | 0.4 | |
| 1992-93 | 4.1 | |
| 1993-94 | 4.0 | |
| 1994-95 | 3.9 | 3.2 |
| 1995-96 | 3.9 | 3.2 |
| 1996-97 | 3.9 | 3.2 |
| 1997-98 | 4.4 | 3.2 |
| 1998-99 | 5.0 | 3.2 |
| 1999-00 | 3.9 | 3.2 |
| 2000-01 | 1.9 | 3.2 |
| 2001-02 | 3.9 | 3.2 |
| 2002-03 | 3.1 | 3.2 |
| 2003-04 | 4.1 | 3.2 |
| 2004-05 | 3.2 | 3.2 |
| 2005-06 | 3.0 | 3.2 |
| 2006-07 | 3.8 | 3.2 |
| 2007-08 | 3.7 | 3.2 |
| 2008-09 | 1.8 | 3.2 |
| 2009-10 | 2.0 | 3.2 |
| 2010-11 | 2.4 | 3.2 |
| 2011-12 | 3.6 | 3.2 |
| 2012-13 | 2.4 | 3.2 |
| 2013-14 | 2.5 | 3.2 |
| 2014-15 | 2.2 | 3.2 |
| 2015-16 | 2.5 | |
| 2016-17 | 2.5 | |
| 2017-18 | 3.0 | |
| 2018-19 | 3.0 | |
| 2019-20 | 3.0 |
Growth is being supported by historically low interest rates, with the Reserve Bank of Australia's official cash rate set at a record low since May 2015. The accommodative stance of monetary policy is supporting the economy by lowering borrowing costs for businesses and households. The weighted average lending rates faced by businesses are around their lowest levels in at least two decades, while the standard variable mortgage rate is close to its lowest level since the late 1960s.
The depreciation of the Australian dollar is also assisting the transition away from resources investment‑led growth to more diverse sources, by improving the competitiveness of Australia's export and import‑competing businesses. While the Australian dollar has risen somewhat against the US dollar and on a trade weighted basis since the 2015‑16 MYEFO, it remains around 30 per cent lower than its 2011 peak against the US dollar. Since the 2015‑16 MYEFO, the Australian dollar has returned to a similar level as at the 2015‑16 Budget, both against the US dollar and on a trade weighted basis.
Box 2: Supporting the economic transition
The transition of the Australian economy from the mining investment boom to broader‑based growth is well underway.
Flexibility within the economy has allowed it to perform well and minimised the negative effects of the uneven growth and underutilisation of resources that can accompany commodity price booms. Unlike the terms of trade boom in the 1970s, there has been relatively limited volatility in output, employment and domestic inflation.
The agility of the economy to respond to changing drivers of growth reflects, in part, the ability of three key prices to adjust: the exchange rate, interest rates and wages.
Flexible prices direct resources to where they are most valued so that the economy's resources are used most efficiently.
During the mining boom price movements helped allocate resources to the mining sector while reducing overheating.
The higher Australian dollar freed up resources from other sectors to make way for the mining expansion while higher interest rates helped to cool aggregate demand.
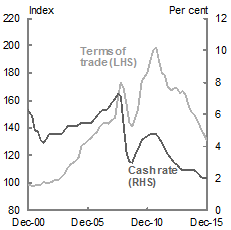
Source: ABS cat. no. 5206.0, Reserve Bank of Australia and Treasury.
Note: September 2002 = 100 for the terms of trade.
| Terms of trade | Cash rate | |
|---|---|---|
| Dec 2000 | 98.30 | 6.23 |
| Mar 2001 | 98.18 | 5.87 |
| Jun 2001 | 97.71 | 5.01 |
| Sep 2001 | 99.08 | 4.91 |
| Dec 2001 | 98.79 | 4.42 |
| Mar 2002 | 101.00 | 4.24 |
| Jun 2002 | 99.91 | 4.47 |
| Sep 2002 | 100.00 | 4.75 |
| Dec 2002 | 100.93 | 4.75 |
| Mar 2003 | 101.94 | 4.75 |
| Jun 2003 | 102.26 | 4.75 |
| Sep 2003 | 104.18 | 4.75 |
| Dec 2003 | 106.37 | 4.99 |
| Mar 2004 | 110.47 | 5.25 |
| Jun 2004 | 113.51 | 5.25 |
| Sep 2004 | 114.66 | 5.25 |
| Dec 2004 | 115.96 | 5.25 |
| Mar 2005 | 119.19 | 5.33 |
| Jun 2005 | 127.02 | 5.50 |
| Sep 2005 | 128.60 | 5.50 |
| Dec 2005 | 131.20 | 5.50 |
| Mar 2006 | 132.97 | 5.50 |
| Jun 2006 | 135.39 | 5.66 |
| Sep 2006 | 137.25 | 5.91 |
| Dec 2006 | 140.79 | 6.15 |
| Mar 2007 | 143.48 | 6.25 |
| Jun 2007 | 144.14 | 6.25 |
| Sep 2007 | 142.96 | 6.40 |
| Dec 2007 | 145.09 | 6.65 |
| Mar 2008 | 147.39 | 6.98 |
| Jun 2008 | 162.22 | 7.25 |
| Sep 2008 | 172.82 | 7.17 |
| Dec 2008 | 169.21 | 5.29 |
| Mar 2009 | 157.38 | 3.62 |
| Jun 2009 | 144.09 | 3.02 |
| Sep 2009 | 141.36 | 3.00 |
| Dec 2009 | 147.03 | 3.48 |
| Mar 2010 | 153.56 | 3.83 |
| Jun 2010 | 174.80 | 4.40 |
| Sep 2010 | 177.32 | 4.50 |
| Dec 2010 | 181.13 | 4.66 |
| Mar 2011 | 189.43 | 4.75 |
| Jun 2011 | 196.64 | 4.75 |
| Sep 2011 | 199.13 | 4.75 |
| Dec 2011 | 189.31 | 4.52 |
| Mar 2012 | 179.71 | 4.25 |
| Jun 2012 | 178.60 | 3.85 |
| Sep 2012 | 170.32 | 3.50 |
| Dec 2012 | 167.26 | 3.18 |
| Mar 2013 | 169.26 | 3.00 |
| Jun 2013 | 169.09 | 2.85 |
| Sep 2013 | 165.48 | 2.60 |
| Dec 2013 | 166.89 | 2.50 |
| Mar 2014 | 163.89 | 2.50 |
| Jun 2014 | 156.63 | 2.50 |
| Sep 2014 | 151.49 | 2.50 |
| Dec 2014 | 149.21 | 2.50 |
| Mar 2015 | 144.56 | 2.34 |
| Jun 2015 | 138.98 | 2.10 |
| Sep 2015 | 135.55 | 2.00 |
| Dec 2015 | 131.25 | 2.00 |
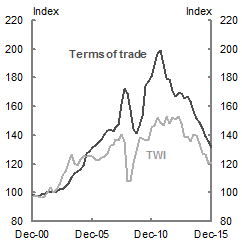
Source: ABS cat. no. 5206.0 and 5302.0.
Note: September 2002 = 100, TWI is the quarterly average Trade Weighted Index.
| Terms of trade | TWI | |
|---|---|---|
| Dec 2000 | 98.30 | 97.45 |
| Mar 2001 | 98.18 | 98.23 |
| Jun 2001 | 97.71 | 97.45 |
| Sep 2001 | 99.08 | 96.86 |
| Dec 2001 | 98.79 | 97.45 |
| Mar 2002 | 101.00 | 100.20 |
| Jun 2002 | 99.91 | 103.73 |
| Sep 2002 | 100.00 | 100.00 |
| Dec 2002 | 100.93 | 102.16 |
| Mar 2003 | 101.94 | 105.70 |
| Jun 2003 | 102.26 | 112.38 |
| Sep 2003 | 104.18 | 114.93 |
| Dec 2003 | 106.37 | 121.22 |
| Mar 2004 | 110.47 | 126.92 |
| Jun 2004 | 113.51 | 120.24 |
| Sep 2004 | 114.66 | 119.06 |
| Dec 2004 | 115.96 | 123.38 |
| Mar 2005 | 119.19 | 125.15 |
| Jun 2005 | 127.02 | 125.34 |
| Sep 2005 | 128.60 | 126.13 |
| Dec 2005 | 131.20 | 125.34 |
| Mar 2006 | 132.97 | 123.18 |
| Jun 2006 | 135.39 | 122.59 |
| Sep 2006 | 137.25 | 124.36 |
| Dec 2006 | 140.79 | 125.34 |
| Mar 2007 | 143.48 | 127.11 |
| Jun 2007 | 144.14 | 132.61 |
| Sep 2007 | 142.96 | 133.79 |
| Dec 2007 | 145.09 | 136.94 |
| Mar 2008 | 147.39 | 136.35 |
| Jun 2008 | 162.22 | 140.86 |
| Sep 2008 | 172.82 | 135.36 |
| Dec 2008 | 169.21 | 108.06 |
| Mar 2009 | 157.38 | 108.45 |
| Jun 2009 | 144.09 | 121.22 |
| Sep 2009 | 141.36 | 129.27 |
| Dec 2009 | 147.03 | 137.72 |
| Mar 2010 | 153.56 | 138.11 |
| Jun 2010 | 174.80 | 136.74 |
| Sep 2010 | 177.32 | 136.94 |
| Dec 2010 | 181.13 | 145.38 |
| Mar 2011 | 189.43 | 146.95 |
| Jun 2011 | 196.64 | 152.26 |
| Sep 2011 | 199.13 | 149.12 |
| Dec 2011 | 189.31 | 146.95 |
| Mar 2012 | 179.71 | 153.05 |
| Jun 2012 | 178.60 | 148.33 |
| Sep 2012 | 170.32 | 152.46 |
| Dec 2012 | 167.26 | 150.88 |
| Mar 2013 | 169.26 | 153.44 |
| Jun 2013 | 169.09 | 148.33 |
| Sep 2013 | 165.48 | 138.51 |
| Dec 2013 | 166.89 | 139.49 |
| Mar 2014 | 163.89 | 135.56 |
| Jun 2014 | 156.63 | 140.67 |
| Sep 2014 | 151.49 | 140.08 |
| Dec 2014 | 149.21 | 134.18 |
| Mar 2015 | 144.56 | 127.11 |
| Jun 2015 | 138.98 | 126.33 |
| Sep 2015 | 135.55 | 120.63 |
| Dec 2015 | 131.27 | 131.83 |
Wages in the mining sector grew strongly, which helped attract labour to the sector. Non‑mining wages also rose reflecting the overall scarcity of labour resources. This reduced the demand for labour in other sectors and helped to attract higher overseas migration to meet the labour supply shortfall.
Prices also adjust to changes in government spending. For example, when governments increase their spending, flexible prices will adjust to draw resources away from the private sector.
When economic activity is weak, this can draw on spare capacity from the private sector but when the economy is growing it can result in higher interest rates or higher wages, which can crowd out productive private sector activity.
Just as the earlier adjustments during the mining boom helped the economy avoid overheating, they are now helping the economy adjust to lower commodity prices and less investment in the resources sector.
The effect of the exchange rate depreciation over the past year is evident in the improved conditions and prospects for a number of industries, including tourism, education, agriculture and parts of manufacturing.
The effect of low interest rates is most clearly evident in residential construction activity, which increased by 10 per cent over 2015. This strong growth is having positive spillovers to other parts of the economy, for instance in engineering and legal services. A buoyant housing market has also supported consumption through expenditure on related items such as furnishings.
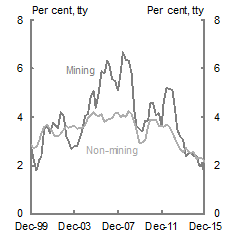
Source: ABS cat. no. 6345.0 and Treasury.
Note: Wage growth rates are those of the Wage Price Index.
| Mining | Non-mining | |
|---|---|---|
| Dec-99 | 2.88 | 2.89 |
| Mar-00 | 2.26 | 2.70 |
| Jun-00 | 1.79 | 2.75 |
| Sep-00 | 2.22 | 3.03 |
| Dec-00 | 2.36 | 3.32 |
| Mar-01 | 3.53 | 3.60 |
| Jun-01 | 3.65 | 3.66 |
| Sep-01 | 3.33 | 3.53 |
| Dec-01 | 3.75 | 3.35 |
| Mar-02 | 3.69 | 3.21 |
| Jun-02 | 3.53 | 3.18 |
| Sep-02 | 4.20 | 3.31 |
| Dec-02 | 4.03 | 3.48 |
| Mar-03 | 3.15 | 3.62 |
| Jun-03 | 3.00 | 3.55 |
| Sep-03 | 2.69 | 3.58 |
| Dec-03 | 2.80 | 3.63 |
| Mar-04 | 2.79 | 3.51 |
| Jun-04 | 3.17 | 3.55 |
| Sep-04 | 3.40 | 3.55 |
| Dec-04 | 4.03 | 3.66 |
| Mar-05 | 4.13 | 3.94 |
| Jun-05 | 4.87 | 4.09 |
| Sep-05 | 5.06 | 4.20 |
| Dec-05 | 4.37 | 4.09 |
| Mar-06 | 4.96 | 4.04 |
| Jun-06 | 5.87 | 4.11 |
| Sep-06 | 5.78 | 3.79 |
| Dec-06 | 6.34 | 3.89 |
| Mar-07 | 6.15 | 3.93 |
| Jun-07 | 5.54 | 3.96 |
| Sep-07 | 5.47 | 4.14 |
| Dec-07 | 5.06 | 4.15 |
| Mar-08 | 5.90 | 3.99 |
| Jun-08 | 6.67 | 4.09 |
| Sep-08 | 6.37 | 4.01 |
| Dec-08 | 6.32 | 4.24 |
| Mar-09 | 5.78 | 4.14 |
| Jun-09 | 4.21 | 3.77 |
| Sep-09 | 3.65 | 3.46 |
| Dec-09 | 3.52 | 2.90 |
| Mar-10 | 3.38 | 2.97 |
| Jun-10 | 3.84 | 3.03 |
| Sep-10 | 3.82 | 3.62 |
| Dec-10 | 4.57 | 3.88 |
| Mar-11 | 4.62 | 3.87 |
| Jun-11 | 4.08 | 3.86 |
| Sep-11 | 4.15 | 3.63 |
| Dec-11 | 3.63 | 3.64 |
| Mar-12 | 4.60 | 3.59 |
| Jun-12 | 5.19 | 3.66 |
| Sep-12 | 5.16 | 3.58 |
| Dec-12 | 5.12 | 3.36 |
| Mar-13 | 4.22 | 3.09 |
| Jun-13 | 3.46 | 2.93 |
| Sep-13 | 3.19 | 2.68 |
| Dec-13 | 3.07 | 2.55 |
| Mar-14 | 2.36 | 2.71 |
| Jun-14 | 2.51 | 2.57 |
| Sep-14 | 2.50 | 2.53 |
| Dec-14 | 2.40 | 2.54 |
| Mar-15 | 2.39 | 2.27 |
| Jun-15 | 1.96 | 2.31 |
| Sep-15 | 2.12 | 2.27 |
| Dec-15 | 1.54 | 2.15 |
Wage rises due to strong demand for labour during the resources boom have eased and are re‑adjusting in response to the changing demand for employment in other sectors.
Moderate wage growth is also supporting employment growth in the non‑mining economy, particularly in the service sectors.
Households
Household consumption is growing steadily, underpinned by strong employment growth, a fall in petrol prices of around 15 per cent over the past year, and a declining household saving rate. A buoyant housing market has also been supporting consumption through rising household wealth, as well as through expenditure on housing-related items such as furnishings.
Steady growth is expected to continue with household consumption forecast to grow by 3 per cent each year across the forecast period. In 2015‑16, consumption is expected to be supported by low petrol prices and a still strong housing market. Labour market conditions are expected to remain strong and together with low interest rates will continue to sustain consumption growth as support from the housing sector eases in 2016‑17.
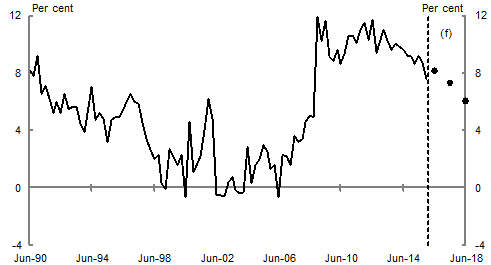
A falling household saving rate is also supporting consumption growth. The share of household income saved rose strongly during the period of rapid income growth that accompanied the terms of trade boom, and then more sharply during the global financial crisis. The household saving rate has declined since the recovery from the global financial crisis, providing support to consumption. The household saving rate is expected to decline further at a moderate pace, but remain well above pre‑crisis lows (Chart 3). Uncertainty around the pace of decline in the household saving rate poses a risk to the rate of consumption growth.
Source: ABS cat. no. 5206.0 and Treasury.
| Household savings rate | |
|---|---|
| Jun-90 | 8.20 |
| Sep-90 | 7.80 |
| Dec-90 | 9.20 |
| Mar-91 | 6.50 |
| Jun-91 | 7.10 |
| Sep-91 | 6.20 |
| Dec-91 | 5.20 |
| Mar-92 | 6.00 |
| Jun-92 | 5.20 |
| Sep-92 | 6.50 |
| Dec-92 | 5.50 |
| Mar-93 | 5.60 |
| Jun-93 | 5.60 |
| Sep-93 | 4.40 |
| Dec-93 | 3.90 |
| Mar-94 | 5.60 |
| Jun-94 | 7.00 |
| Sep-94 | 4.70 |
| Dec-94 | 5.20 |
| Mar-95 | 4.80 |
| Jun-95 | 3.20 |
| Sep-95 | 4.70 |
| Dec-95 | 4.90 |
| Mar-96 | 4.90 |
| Jun-96 | 5.50 |
| Sep-96 | 6.00 |
| Dec-96 | 6.50 |
| Mar-97 | 6.00 |
| Jun-97 | 5.80 |
| Sep-97 | 4.50 |
| Dec-97 | 3.40 |
| Mar-98 | 2.60 |
| Jun-98 | 2.00 |
| Sep-98 | 2.30 |
| Dec-98 | 0.30 |
| Mar-99 | -0.10 |
| Jun-99 | 2.70 |
| Sep-99 | 2.10 |
| Dec-99 | 1.60 |
| Mar-00 | 2.30 |
| Jun-00 | -0.70 |
| Sep-00 | 4.60 |
| Dec-00 | 1.10 |
| Mar-01 | 1.70 |
| Jun-01 | 2.20 |
| Sep-01 | 4.00 |
| Dec-01 | 6.20 |
| Mar-02 | 4.80 |
| Jun-02 | -0.50 |
| Sep-02 | -0.50 |
| Dec-02 | -0.60 |
| Mar-03 | 0.40 |
| Jun-03 | 0.70 |
| Sep-03 | -0.20 |
| Dec-03 | -0.40 |
| Mar-04 | -0.30 |
| Jun-04 | 2.80 |
| Sep-04 | 0.30 |
| Dec-04 | 1.60 |
| Mar-05 | 2.00 |
| Jun-05 | 3.00 |
| Sep-05 | 2.50 |
| Dec-05 | 1.30 |
| Mar-06 | 1.60 |
| Jun-06 | -0.70 |
| Sep-06 | 2.30 |
| Dec-06 | 2.20 |
| Mar-07 | 1.60 |
| Jun-07 | 3.60 |
| Sep-07 | 3.20 |
| Dec-07 | 3.40 |
| Mar-08 | 4.60 |
| Jun-08 | 5.00 |
| Sep-08 | 4.90 |
| Dec-08 | 11.90 |
| Mar-09 | 10.20 |
| Jun-09 | 11.60 |
| Sep-09 | 9.10 |
| Dec-09 | 8.80 |
| Mar-10 | 9.60 |
| Jun-10 | 8.60 |
| Sep-10 | 9.30 |
| Dec-10 | 10.60 |
| Mar-11 | 10.60 |
| Jun-11 | 10.10 |
| Sep-11 | 11.00 |
| Dec-11 | 11.50 |
| Mar-12 | 10.30 |
| Jun-12 | 11.70 |
| Sep-12 | 9.40 |
| Dec-12 | 10.10 |
| Mar-13 | 11.00 |
| Jun-13 | 10.20 |
| Sep-13 | 9.60 |
| Dec-13 | 10.00 |
| Mar-14 | 9.80 |
| Jun-14 | 9.60 |
| Sep-14 | 9.20 |
| Dec-14 | 9.10 |
| Mar-15 | 8.60 |
| Jun-15 | 9.20 |
| Sep-15 | 8.70 |
| Dec-15 | 7.60 |
| Mar-16 | |
| Jun-16 | 8.25 |
| Sep-16 | |
| Dec-16 | |
| Mar-17 | |
| Jun-17 | 7.25 |
| Sep-17 | |
| Dec-17 | |
| Mar-18 | |
| Jun-18 | 6.00 |
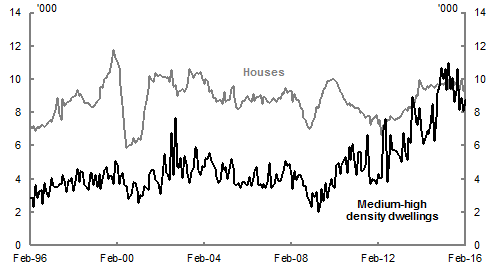
Dwelling investment grew by 7.9 per cent in 2014‑15 — the largest growth seen over the past decade, partly driven by a significant shift towards medium‑high density dwellings (Chart 4). Dwelling investment in 2015‑16 has remained strong, supported by low interest rates and an elevated level of work under construction. While the level of investment is expected to remain high, growth is expected to ease to 2 per cent in 2016‑17 and 1 per cent in 2017‑18 as a record number of dwellings reach completion.
Source: ABS cat. no. 8731.0.
| Houses | Medium-high density dwellings | |
|---|---|---|
| Feb-96 | 7.13 | 2.82 |
| Mar-96 | 7.06 | 2.82 |
| Apr-96 | 7.17 | 2.30 |
| May-96 | 6.87 | 3.60 |
| Jun-96 | 7.11 | 2.84 |
| Jul-96 | 7.06 | 3.25 |
| Aug-96 | 7.24 | 3.31 |
| Sep-96 | 7.24 | 2.47 |
| Oct-96 | 7.12 | 3.70 |
| Nov-96 | 7.22 | 3.20 |
| Dec-96 | 7.40 | 2.91 |
| Jan-97 | 7.51 | 3.54 |
| Feb-97 | 7.42 | 4.06 |
| Mar-97 | 7.76 | 3.56 |
| Apr-97 | 8.16 | 3.48 |
| May-97 | 8.86 | 3.47 |
| Jun-97 | 7.82 | 3.67 |
| Jul-97 | 7.55 | 3.66 |
| Aug-97 | 8.82 | 4.20 |
| Sep-97 | 8.41 | 3.85 |
| Oct-97 | 8.57 | 3.21 |
| Nov-97 | 8.61 | 3.89 |
| Dec-97 | 8.67 | 3.87 |
| Jan-98 | 8.87 | 4.03 |
| Feb-98 | 8.90 | 3.24 |
| Mar-98 | 8.97 | 3.85 |
| Apr-98 | 9.36 | 4.60 |
| May-98 | 9.00 | 3.79 |
| Jun-98 | 9.11 | 4.45 |
| Jul-98 | 8.85 | 4.40 |
| Aug-98 | 8.59 | 3.60 |
| Sep-98 | 8.56 | 3.49 |
| Oct-98 | 8.60 | 3.32 |
| Nov-98 | 8.38 | 4.33 |
| Dec-98 | 8.31 | 4.32 |
| Jan-99 | 8.34 | 3.64 |
| Feb-99 | 8.53 | 4.21 |
| Mar-99 | 8.71 | 3.49 |
| Apr-99 | 8.79 | 4.28 |
| May-99 | 9.51 | 3.35 |
| Jun-99 | 9.47 | 3.98 |
| Jul-99 | 10.03 | 4.49 |
| Aug-99 | 10.10 | 4.68 |
| Sep-99 | 10.38 | 3.97 |
| Oct-99 | 10.40 | 4.14 |
| Nov-99 | 10.99 | 4.18 |
| Dec-99 | 11.79 | 3.69 |
| Jan-00 | 11.28 | 5.06 |
| Feb-00 | 11.06 | 4.81 |
| Mar-00 | 10.71 | 3.70 |
| Apr-00 | 9.60 | 4.09 |
| May-00 | 8.41 | 4.34 |
| Jun-00 | 6.93 | 3.62 |
| Jul-00 | 5.86 | 3.55 |
| Aug-00 | 5.96 | 2.76 |
| Sep-00 | 6.01 | 2.88 |
| Oct-00 | 6.01 | 3.09 |
| Nov-00 | 6.47 | 3.77 |
| Dec-00 | 6.16 | 3.72 |
| Jan-01 | 6.33 | 3.26 |
| Feb-01 | 6.43 | 2.52 |
| Mar-01 | 6.34 | 2.98 |
| Apr-01 | 6.95 | 2.93 |
| May-01 | 8.15 | 3.53 |
| Jun-01 | 8.70 | 3.42 |
| Jul-01 | 9.39 | 3.28 |
| Aug-01 | 10.18 | 4.30 |
| Sep-01 | 9.97 | 4.53 |
| Oct-01 | 9.83 | 4.49 |
| Nov-01 | 10.35 | 3.92 |
| Dec-01 | 10.18 | 3.82 |
| Jan-02 | 10.18 | 3.66 |
| Feb-02 | 10.24 | 3.06 |
| Mar-02 | 10.13 | 4.15 |
| Apr-02 | 10.16 | 5.50 |
| May-02 | 10.06 | 4.35 |
| Jun-02 | 10.11 | 4.30 |
| Jul-02 | 9.84 | 3.89 |
| Aug-02 | 10.58 | 6.74 |
| Sep-02 | 9.53 | 4.23 |
| Oct-02 | 9.65 | 7.67 |
| Nov-02 | 9.00 | 4.70 |
| Dec-02 | 9.23 | 4.66 |
| Jan-03 | 9.31 | 5.23 |
| Feb-03 | 9.42 | 4.01 |
| Mar-03 | 9.22 | 5.34 |
| Apr-03 | 9.45 | 4.89 |
| May-03 | 9.71 | 4.30 |
| Jun-03 | 10.61 | 3.73 |
| Jul-03 | 10.40 | 4.41 |
| Aug-03 | 10.06 | 4.64 |
| Sep-03 | 10.33 | 5.89 |
| Oct-03 | 10.38 | 5.78 |
| Nov-03 | 10.31 | 4.43 |
| Dec-03 | 10.44 | 4.24 |
| Jan-04 | 10.02 | 4.76 |
| Feb-04 | 9.70 | 4.71 |
| Mar-04 | 10.00 | 5.22 |
| Apr-04 | 9.90 | 5.19 |
| May-04 | 9.25 | 5.53 |
| Jun-04 | 9.37 | 5.08 |
| Jul-04 | 8.89 | 4.79 |
| Aug-04 | 8.89 | 4.60 |
| Sep-04 | 8.61 | 4.07 |
| Oct-04 | 8.67 | 3.72 |
| Nov-04 | 8.76 | 3.89 |
| Dec-04 | 8.53 | 4.95 |
| Jan-05 | 9.24 | 4.50 |
| Feb-05 | 8.61 | 4.70 |
| Mar-05 | 8.76 | 3.95 |
| Apr-05 | 8.74 | 4.58 |
| May-05 | 9.39 | 5.16 |
| Jun-05 | 9.57 | 4.65 |
| Jul-05 | 8.86 | 3.70 |
| Aug-05 | 8.26 | 3.63 |
| Sep-05 | 8.21 | 3.71 |
| Oct-05 | 8.31 | 3.40 |
| Nov-05 | 8.67 | 3.81 |
| Dec-05 | 8.71 | 3.78 |
| Jan-06 | 8.82 | 3.70 |
| Feb-06 | 9.01 | 3.62 |
| Mar-06 | 8.72 | 4.08 |
| Apr-06 | 8.64 | 3.53 |
| May-06 | 9.13 | 4.02 |
| Jun-06 | 8.67 | 4.48 |
| Jul-06 | 8.94 | 4.70 |
| Aug-06 | 8.93 | 3.61 |
| Sep-06 | 9.07 | 3.64 |
| Oct-06 | 8.49 | 3.42 |
| Nov-06 | 8.94 | 3.67 |
| Dec-06 | 8.86 | 3.42 |
| Jan-07 | 8.61 | 3.81 |
| Feb-07 | 8.54 | 4.97 |
| Mar-07 | 8.70 | 3.45 |
| Apr-07 | 8.87 | 3.62 |
| May-07 | 8.79 | 3.65 |
| Jun-07 | 8.65 | 4.26 |
| Jul-07 | 8.88 | 3.83 |
| Aug-07 | 8.79 | 3.84 |
| Sep-07 | 9.17 | 4.27 |
| Oct-07 | 9.08 | 4.47 |
| Nov-07 | 9.45 | 5.05 |
| Dec-07 | 9.17 | 4.77 |
| Jan-08 | 9.32 | 4.90 |
| Feb-08 | 9.29 | 4.19 |
| Mar-08 | 8.64 | 3.38 |
| Apr-08 | 9.12 | 4.48 |
| May-08 | 8.77 | 3.90 |
| Jun-08 | 8.76 | 4.24 |
| Jul-08 | 8.31 | 4.20 |
| Aug-08 | 8.14 | 3.92 |
| Sep-08 | 7.69 | 3.55 |
| Oct-08 | 7.56 | 3.53 |
| Nov-08 | 7.18 | 2.87 |
| Dec-08 | 7.00 | 2.63 |
| Jan-09 | 7.20 | 2.28 |
| Feb-09 | 7.41 | 3.10 |
| Mar-09 | 7.63 | 2.86 |
| Apr-09 | 8.32 | 3.18 |
| May-09 | 8.28 | 1.96 |
| Jun-09 | 8.78 | 2.53 |
| Jul-09 | 8.93 | 3.35 |
| Aug-09 | 9.38 | 2.66 |
| Sep-09 | 9.54 | 3.73 |
| Oct-09 | 9.89 | 2.83 |
| Nov-09 | 9.87 | 3.52 |
| Dec-09 | 9.97 | 3.97 |
| Jan-10 | 10.03 | 3.62 |
| Feb-10 | 9.98 | 3.41 |
| Mar-10 | 9.82 | 4.80 |
| Apr-10 | 9.55 | 4.94 |
| May-10 | 9.25 | 4.27 |
| Jun-10 | 9.14 | 4.79 |
| Jul-10 | 8.89 | 5.08 |
| Aug-10 | 8.71 | 5.32 |
| Sep-10 | 8.44 | 4.33 |
| Oct-10 | 8.58 | 5.89 |
| Nov-10 | 8.38 | 5.09 |
| Dec-10 | 8.47 | 6.06 |
| Jan-11 | 8.28 | 5.06 |
| Feb-11 | 8.29 | 4.24 |
| Mar-11 | 8.24 | 5.59 |
| Apr-11 | 7.97 | 5.62 |
| May-11 | 8.01 | 4.48 |
| Jun-11 | 7.93 | 4.49 |
| Jul-11 | 7.69 | 4.80 |
| Aug-11 | 7.77 | 6.62 |
| Sep-11 | 7.78 | 4.08 |
| Oct-11 | 7.21 | 3.68 |
| Nov-11 | 7.63 | 3.98 |
| Dec-11 | 7.68 | 3.91 |
| Jan-12 | 7.82 | 3.67 |
| Feb-12 | 7.33 | 4.26 |
| Mar-12 | 7.57 | 4.05 |
| Apr-12 | 6.64 | 4.02 |
| May-12 | 7.27 | 6.94 |
| Jun-12 | 7.31 | 7.58 |
| Jul-12 | 7.54 | 3.78 |
| Aug-12 | 7.52 | 5.45 |
| Sep-12 | 7.77 | 6.65 |
| Oct-12 | 7.68 | 5.71 |
| Nov-12 | 7.56 | 5.74 |
| Dec-12 | 7.61 | 5.70 |
| Jan-13 | 7.66 | 5.40 |
| Feb-13 | 7.67 | 5.34 |
| Mar-13 | 7.84 | 5.01 |
| Apr-13 | 8.06 | 6.76 |
| May-13 | 8.20 | 5.56 |
| Jun-13 | 8.10 | 5.11 |
| Jul-13 | 8.35 | 6.43 |
| Aug-13 | 8.27 | 6.18 |
| Sep-13 | 8.47 | 8.93 |
| Oct-13 | 8.55 | 8.25 |
| Nov-13 | 9.06 | 7.35 |
| Dec-13 | 8.96 | 7.26 |
| Jan-14 | 9.95 | 8.24 |
| Feb-14 | 9.65 | 6.89 |
| Mar-14 | 9.41 | 6.10 |
| Apr-14 | 9.37 | 6.44 |
| May-14 | 9.60 | 6.88 |
| Jun-14 | 9.48 | 6.67 |
| Jul-14 | 9.67 | 7.30 |
| Aug-14 | 9.58 | 8.53 |
| Sep-14 | 9.49 | 6.26 |
| Oct-14 | 9.67 | 7.71 |
| Nov-14 | 9.72 | 9.16 |
| Dec-14 | 9.59 | 9.59 |
| Jan-15 | 9.69 | 10.69 |
| Feb-15 | 9.68 | 10.04 |
| Mar-15 | 9.82 | 10.65 |
| Apr-15 | 10.53 | 9.34 |
| May-15 | 9.43 | 11.00 |
| Jun-15 | 9.91 | 9.40 |
| Jul-15 | 9.34 | 10.06 |
| Aug-15 | 9.82 | 8.63 |
| Sep-15 | 9.65 | 9.32 |
| Oct-15 | 9.47 | 10.64 |
| Nov-15 | 9.32 | 8.12 |
| Dec-15 | 9.93 | 8.85 |
| Jan-16 | 9.29 | 8.11 |
| Feb-16 | 9.18 | 8.72 |
Business investment
As the economy transitions from the investment phase of the mining boom to the production phase, the outlook for business investment continues to be dominated by steep falls in mining investment as resource projects are completed. This contraction is expected to lessen by 2017‑18. At the same time the transition to broader‑based sources of growth is expected to drive investment in the non‑mining sectors. Overall, business investment is forecast to fall by 5 per cent in 2016‑17, then remain flat in 2017‑18, driven by mining investment that is forecast to fall by 25½ per cent in 2016‑17 and 14 per cent in 2017‑18.
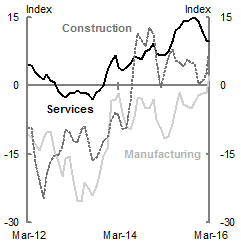
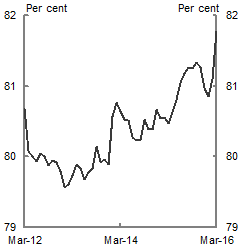
Conditions are in place for non‑mining investment to pick up. Borrowing costs are low, and domestic demand is forecast to strengthen. There are positive signs of bolstered activity in the service sectors and business surveys are showing improving conditions in the non‑mining sector (Chart 5). Non‑mining capacity utilisation is at its highest level since the global financial crisis (Chart 6).
To date, however, the recovery of non‑mining investment has been slower than expected and leading indicators remain mixed, with some business expectations surveys suggesting the delay may continue into 2016‑17. The ABS Private New Capital Expenditure and Expected Expenditure Survey (CAPEX) and Treasury's business liaison programme suggest that non‑mining businesses have yet to commit to significant new investment plans, which is offsetting some of the more positive indicators.
Note: Figures represent the 3‑month moving average.
Source: NAB Monthly Business Survey.
| Services | Manufacturing | Construction | Capacity Utilisation | |
|---|---|---|---|---|
| Mar-12 | 5 | -11 | -9 | 80.7 |
| Apr-12 | 5 | -11 | -9 | 80.1 |
| May-12 | 3 | -13 | -17 | 80.0 |
| Jun-12 | 2 | -14 | -21 | 79.9 |
| Jul-12 | 1 | -12 | -25 | 80.0 |
| Aug-12 | 3 | -10 | -20 | 80.0 |
| Sep-12 | 1 | -10 | -17 | 79.9 |
| Oct-12 | 1 | -14 | -15 | 79.9 |
| Nov-12 | -1 | -17 | -15 | 79.9 |
| Dec-12 | -2 | -20 | -13 | 79.8 |
| Jan-13 | -3 | -16 | -10 | 79.6 |
| Feb-13 | -2 | -16 | -10 | 79.6 |
| Mar-13 | -2 | -21 | -12 | 79.7 |
| Apr-13 | -1 | -25 | -13 | 79.9 |
| May-13 | -2 | -25 | -10 | 79.8 |
| Jun-13 | -2 | -21 | -9 | 79.7 |
| Jul-13 | -2 | -23 | -12 | 79.8 |
| Aug-13 | -3 | -24 | -16 | 79.8 |
| Sep-13 | -2 | -22 | -16 | 80.1 |
| Oct-13 | -1 | -19 | -14 | 79.9 |
| Nov-13 | 0 | -15 | -12 | 80.0 |
| Dec-13 | 3 | -14 | -11 | 79.9 |
| Jan-14 | 5 | -3 | -7 | 80.6 |
| Feb-14 | 7 | -3 | -6 | 80.8 |
| Mar-14 | 4 | -2 | -7 | 80.6 |
| Apr-14 | 3 | -6 | -10 | 80.5 |
| May-14 | 4 | -9 | -9 | 80.5 |
| Jun-14 | 5 | -10 | -3 | 80.3 |
| Jul-14 | 6 | -7 | 7 | 80.2 |
| Aug-14 | 6 | -3 | 11 | 80.2 |
| Sep-14 | 6 | -3 | 10 | 80.5 |
| Oct-14 | 8 | -5 | 9 | 80.4 |
| Nov-14 | 8 | -5 | 13 | 80.4 |
| Dec-14 | 9 | -3 | 11 | 80.7 |
| Jan-15 | 7 | -8 | 6 | 80.5 |
| Feb-15 | 7 | -9 | 0 | 80.6 |
| Mar-15 | 7 | -12 | 3 | 80.5 |
| Apr-15 | 8 | -11 | 6 | 80.6 |
| May-15 | 10 | -8 | 8 | 80.8 |
| Jun-15 | 12 | -5 | 6 | 81.1 |
| Jul-15 | 13 | -2 | 5 | 81.2 |
| Aug-15 | 14 | -4 | 4 | 81.3 |
| Sep-15 | 14 | -5 | 6 | 81.3 |
| Oct-15 | 15 | -5 | 5 | 81.3 |
| Nov-15 | 15 | -4 | 5 | 81.3 |
| Dec-15 | 14 | -2 | 1 | 81.0 |
| Jan-16 | 12 | -2 | 1 | 80.9 |
| Feb-16 | 10 | -2 | 3 | 81.1 |
| Mar-16 | 10 | 2 | 9 | 81.8 |
Note: Figures represent the 3‑month moving average.
Source: NAB Monthly Business Survey.
| Services | Manufacturing | Construction | Capacity Utilisation | |
|---|---|---|---|---|
| Mar-12 | 5 | -11 | -9 | 80.7 |
| Apr-12 | 5 | -11 | -9 | 80.1 |
| May-12 | 3 | -13 | -17 | 80.0 |
| Jun-12 | 2 | -14 | -21 | 79.9 |
| Jul-12 | 1 | -12 | -25 | 80.0 |
| Aug-12 | 3 | -10 | -20 | 80.0 |
| Sep-12 | 1 | -10 | -17 | 79.9 |
| Oct-12 | 1 | -14 | -15 | 79.9 |
| Nov-12 | -1 | -17 | -15 | 79.9 |
| Dec-12 | -2 | -20 | -13 | 79.8 |
| Jan-13 | -3 | -16 | -10 | 79.6 |
| Feb-13 | -2 | -16 | -10 | 79.6 |
| Mar-13 | -2 | -21 | -12 | 79.7 |
| Apr-13 | -1 | -25 | -13 | 79.9 |
| May-13 | -2 | -25 | -10 | 79.8 |
| Jun-13 | -2 | -21 | -9 | 79.7 |
| Jul-13 | -2 | -23 | -12 | 79.8 |
| Aug-13 | -3 | -24 | -16 | 79.8 |
| Sep-13 | -2 | -22 | -16 | 80.1 |
| Oct-13 | -1 | -19 | -14 | 79.9 |
| Nov-13 | 0 | -15 | -12 | 80.0 |
| Dec-13 | 3 | -14 | -11 | 79.9 |
| Jan-14 | 5 | -3 | -7 | 80.6 |
| Feb-14 | 7 | -3 | -6 | 80.8 |
| Mar-14 | 4 | -2 | -7 | 80.6 |
| Apr-14 | 3 | -6 | -10 | 80.5 |
| May-14 | 4 | -9 | -9 | 80.5 |
| Jun-14 | 5 | -10 | -3 | 80.3 |
| Jul-14 | 6 | -7 | 7 | 80.2 |
| Aug-14 | 6 | -3 | 11 | 80.2 |
| Sep-14 | 6 | -3 | 10 | 80.5 |
| Oct-14 | 8 | -5 | 9 | 80.4 |
| Nov-14 | 8 | -5 | 13 | 80.4 |
| Dec-14 | 9 | -3 | 11 | 80.7 |
| Jan-15 | 7 | -8 | 6 | 80.5 |
| Feb-15 | 7 | -9 | 0 | 80.6 |
| Mar-15 | 7 | -12 | 3 | 80.5 |
| Apr-15 | 8 | -11 | 6 | 80.6 |
| May-15 | 10 | -8 | 8 | 80.8 |
| Jun-15 | 12 | -5 | 6 | 81.1 |
| Jul-15 | 13 | -2 | 5 | 81.2 |
| Aug-15 | 14 | -4 | 4 | 81.3 |
| Sep-15 | 14 | -5 | 6 | 81.3 |
| Oct-15 | 15 | -5 | 5 | 81.3 |
| Nov-15 | 15 | -4 | 5 | 81.3 |
| Dec-15 | 14 | -2 | 1 | 81.0 |
| Jan-16 | 12 | -2 | 1 | 80.9 |
| Feb-16 | 10 | -2 | 3 | 81.1 |
| Mar-16 | 10 | 2 | 9 | 81.8 |
The pace and timing of a pick up in non‑mining business investment continues to be a key source of uncertainty for the outlook. Along with mixed indicators, a change in the composition of investment creates uncertainty for the forecasts. As mining investment declines and the economy transitions to broader‑based growth, business investment will be underpinned by a greater number of smaller investments, such as investments by small businesses and businesses in the service sectors. The lead times for these kinds of investments are typically shorter than those for large mining projects. This adds to the difficulty in estimating both the timing and scale of the expected pick up in business investment. The sensitivity of the forecasts to a different outlook for business investment is discussed in Statement 7.
Public final demand
The average annual pace of fiscal consolidation in the 2016‑17 Budget across the forward estimates is 0.4 per cent of GDP. This is unchanged from the 2015‑16 MYEFO.
Public final demand, which captures the direct economic impact of consumption and investment across all levels of government, is forecast to grow modestly as most governments remain focused on budget consolidation. As a result, public final demand is forecast to rise by 2¼ per cent in 2016‑17 and 2 per cent 2017‑18.
Exports
Total exports are expected to increase by 6 per cent in 2015‑16, 5 per cent in 2016‑17 and 5½ per cent in 2017‑18. While forecast growth in 2015‑16 is significantly higher than expected at the 2015‑16 MYEFO, forecast growth in 2016‑17, while still strong, is lower than at the 2015‑16 MYEFO. This primarily reflects a higher exchange rate and a weaker outlook for base metal exports.
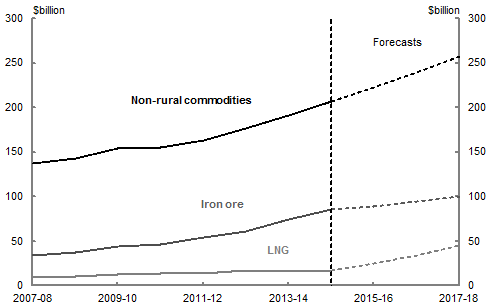
That said, the resource sector continues to underpin growth in total exports with iron ore and LNG production continuing to ramp up after the investment phase of the mining boom. Mining exports are expected to increase by 7 per cent in 2016‑17 and 7½ per cent in 2017‑18.
In 2015, Australia exported over 760 million tonnes of iron ore, with 625 million tonnes exported to China. This compares with 240 million tonnes of iron ore exported in 2005, with almost 120 million tonnes exported to China. In 2015, China's imports of Australian iron ore increased by around 11 per cent with Australia increasing its share of the Chinese iron ore market.
Over the forecast period iron ore exports are expected to increase by around 16 per cent, while LNG exports are expected to continue to grow strongly, with the Department of Industry, Innovation and Science forecasting exports to triple between 2014‑15 and 2020‑21 (Chart 7).1
Source: ABS cat. no. 5302.0, ABS Trade Data and Treasury.
| Non-rural commodities exports ($billion) | Iron ore exports ($billion) | LNG exports ($billion) | |
|---|---|---|---|
| 2007-08 | 137.35 | 33.74 | 9.61 |
| 2008-09 | 142.68 | 37.12 | 10.87 |
| 2009-10 | 153.75 | 44.58 | 12.52 |
| 2010-11 | 155.31 | 46.63 | 14.06 |
| 2011-12 | 163.43 | 53.89 | 13.56 |
| 2012-13 | 176.11 | 60.44 | 16.72 |
| 2013-14 | 191.17 | 74.73 | 16.32 |
| 2014-15 | 206.70 | 85.72 | 17.65 |
| 2015-16 | 223.00 | 89.00 | 25.00 |
| 2016-17 | 239.00 | 95.00 | 34.00 |
| 2017-18 | 257.00 | 100.00 | 45.00 |
Box 3: LNG production increasing
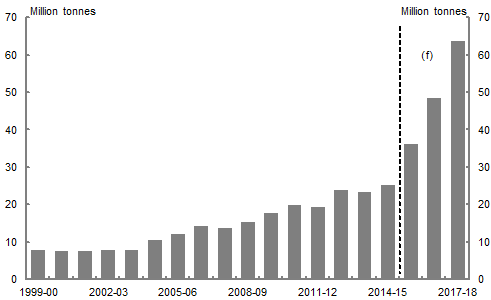
More than $200 billion has been invested in Australia's LNG projects in the past decade. As these projects come online, production will ramp up. Export volumes of LNG from Australia are expected to increase substantially over the forecast period, with Australia expected to become one of the world's largest exporters of LNG in the next five years. Increasing LNG export volumes will also contribute to both real and nominal GDP growth (Chart A).
While the sustained drop in oil prices is benefiting many parts of the Australian economy, it has had a negative impact on LNG prices. Much of Australia's LNG exports are produced under long‑term contracts, which broadly link the price of LNG to the price of oil. This means that low oil prices, if sustained, will weigh on the price of Australia's LNG exports going forward and increasingly offset the positive impact on nominal GDP.
Source: ABS Trade Data and Treasury.
| LNG exports (million tonnes) | |
|---|---|
| 1999-00 | 7.89 |
| 2000-01 | 7.56 |
| 2001-02 | 7.59 |
| 2002-03 | 7.87 |
| 2003-04 | 7.97 |
| 2004-05 | 10.61 |
| 2005-06 | 12.17 |
| 2006-07 | 14.40 |
| 2007-08 | 13.70 |
| 2008-09 | 15.50 |
| 2009-10 | 17.85 |
| 2010-11 | 20.05 |
| 2011-12 | 19.33 |
| 2012-13 | 23.83 |
| 2013-14 | 23.27 |
| 2014-15 | 25.17 |
| 2015-16 | 36.00 |
| 2016-17 | 49.00 |
| 2017-18 | 64.00 |
Additionally, as LNG projects are very capital intensive, the sector is expected to have deductions (such as depreciation) that reduce their tax liabilities in the short to medium term. This, and the high level of foreign ownership in the sector, will reduce the impact that any profits would have on Australia's national income.
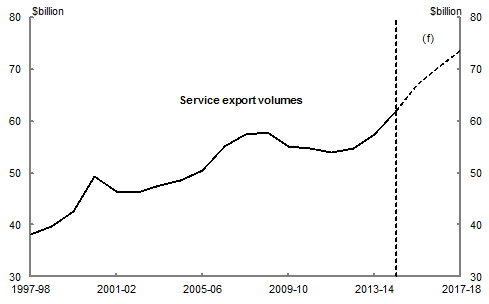
Strong service sector exports have been supported over the past year by a lower exchange rate and rising demand from Asia. Service export volumes are expected to grow by 5 per cent in 2016‑17 and 4½ per cent in 2017‑18 (Chart 8). More than half of service exports are made up of travel services — business, education and tourism travel. Since 2011 visitor arrivals have increased by almost 30 per cent, while Chinese visitors have almost doubled.
Source: ABS cat. no. 5302.0 and Treasury.
Note: 2013‑14 prices.
| Date | Service export volumes ($billion) |
|---|---|
| 1997-98 | 38.06 |
| 1998-99 | 39.78 |
| 1999-00 | 42.67 |
| 2000-01 | 49.28 |
| 2001-02 | 46.46 |
| 2002-03 | 46.26 |
| 2003-04 | 47.52 |
| 2004-05 | 48.51 |
| 2005-06 | 50.57 |
| 2006-07 | 55.19 |
| 2007-08 | 57.45 |
| 2008-09 | 57.89 |
| 2009-10 | 55.12 |
| 2010-11 | 54.76 |
| 2011-12 | 53.98 |
| 2012-13 | 54.81 |
| 2013-14 | 57.37 |
| 2014-15 | 62.02 |
| 2015-16 | 67.00 |
| 2016-17 | 70.00 |
| 2017-18 | 74.00 |
A lower Australian dollar since its peak in 2011 and streamlining of student visa policy arrangements have made Australian education exports more attractive over the past two years, with export volumes reaching $18.5 billion in 2015. Asia's economic growth and rising middle class are expected to continue to drive demand for Australia's high quality education sector.
Other service exports have also been growing strongly, albeit from a much lower base. Financial service exports have experienced double‑digit growth for the past five years, and computer and information services exports grew strongly in 2015.
Rural exports are expected to fall in 2016‑17. Beef exports are forecast to fall as a result of strong domestic restocking which is expected to more than offset the modest growth in Australian wheat exports. Export volumes are forecast to improve in 2017‑18 as beef production recovers in response to higher herd numbers and slaughter rates. A higher exchange rate since the 2015‑16 MYEFO is expected to weigh on prices for rural goods in 2016‑17 and 2017‑18.
Imports continue to reflect the transition of the economy to broader‑based growth. Total capital imports are falling as investment in the mining sector winds down, while other imports are rising in line with growth in the broader economy and the appreciation in the Australian dollar since the 2015‑16 MYEFO. Total imports are expected to grow by 2½ per cent in 2016‑17 and 3 per cent in 2017‑18.
The labour market
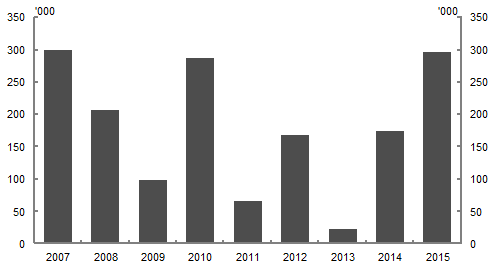
The transition of the economy towards broader‑based drivers of growth has been most evident in the labour market. Employment grew strongly over the past two and a half years and with GDP growth picking up to 3 per cent over the year to the December quarter of 2015, employment growth has accelerated. In 2015, there was an almost 300,000 increase in employment, the highest in a calendar year since 2007 (Chart 9). The unemployment rate fell by 0.4 percentage points to 5.7 per cent over the year to March 2016.
Source: ABS cat. no. 6202.0.
| Calendar year | Jobs growth |
|---|---|
| 2007 | 298 |
| 2008 | 205.6 |
| 2009 | 98.4 |
| 2010 | 286.4 |
| 2011 | 66.6 |
| 2012 | 166.2 |
| 2013 | 22.6 |
| 2014 | 172.2 |
| 2015 | 296.1 |
Employment growth has been supported by moderate wage increases and the transition to more labour‑intensive sectors of the economy. The highest level of employment growth over the past year has been in retail trade and health care and social assistance industries (see Box 4).
While the number of people employed has been rising, the average number of hours worked has been falling. This is in line with an increase in part‑time work in the service sectors and increased participation of females in the workforce, who have higher rates of part‑time employment. The reduction in average hours worked means that total hours worked is spread amongst a larger group of workers, allowing greater employment for a given level of output.
Looking forward, leading indicators such as job advertisements and business survey measures of hiring intentions suggest strong growth in employment will continue. Consistent with the economy's transition, the continuation of strong growth in the labour‑intensive service sectors and moderate wage growth are expected to support a further decline in the unemployment rate.
The unemployment rate is forecast to be 5¾ per cent in the June quarter of 2016 before falling to 5½ per cent by the June quarter of 2017. The unemployment rate peaked earlier than forecast at the 2015‑16 MYEFO and is now at a lower level over the forecast period.
The participation rate is expected to remain around recent levels over the forward estimates. The improvement in labour market conditions is expected to continue to encourage job seekers back into the labour force to resume their search for work. Growth in the more flexible service sectors may also increase female participation. These positive effects on workforce participation will be somewhat offset by the ongoing effect of population ageing.
The current strength of the labour market is also being reflected in the opportunities provided to and taken up by Australia's youth. The youth unemployment rate has declined significantly to 12.0 per cent in March 2016, down 2.5 percentage points since its recent peak of 14.5 per cent in November 2014. It is now at its lowest level since July 2013.
Moderate wage growth is supporting employment and facilitating the economy's transition. Wage growth has been low by historical standards in both the public and private sectors. The Wage Price Index, which measures changes over time in wages and salaries and is unaffected by compositional change in employment, grew by 2.2 per cent through the year to the December quarter of 2015. Wage growth is expected to remain constrained and has been revised down since the 2015‑16 MYEFO. It is now forecast to grow by 2¼ per cent through the year to the June quarter of 2016 and 2½ per cent through the year to the June quarter of 2017.
Box 4: Services — a source of strong employment growth
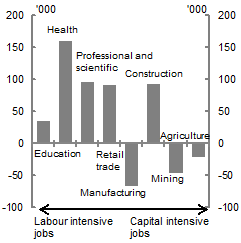
The transition in the economy from the capital‑intensive mining sector to the more labour‑intensive service sectors has been evident in the strength and composition of employment growth.
Strong growth in labour‑intensive service sectors are expected to continue to support strong employment growth over the forecast period.
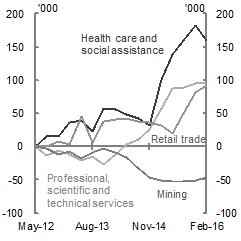
During the resources investment boom, mining employment increased substantially but almost 50,000 jobs have moved out of mining since its peak in May 2012. The mining investment boom also generated demand for construction jobs, however demand for construction jobs is now being generated by dwelling and non‑dwelling investment. Since May 2012 total employment has increased by over 500,000 jobs. Most of this growth has been in the service sectors.
Service sectors accounted for 90 per cent of employment growth over the past year.
Within services, retail and health care and social assistance have been the largest contributors, each growing by around 60,000 jobs over the past year. Professional, scientific and technical services has also been contributing strongly to employment growth, driven by the growth in high‑skilled consultancy jobs.
The high labour intensity of the service sectors has allowed employment to grow strongly over a period when output has been growing at a little below potential.
Source: ABS cat. no. 6291.0.55.003 and Treasury.
| Change in employment since May 2012 |
|
|---|---|
| Education | 35.37 |
| Health | 160.29 |
| Professional and scientific | 95.44 |
| Retail trade | 92.13 |
| Manufacturing | -66.23 |
| Construction | 92.77 |
| Mining | -45.80 |
| Agriculture | -20.92 |
Source: ABS cat. no. 6291.055.003.
| Health | Professional and scientific | Retail trade | Mining | |
|---|---|---|---|---|
| May-2012 | 0.00 | 0.00 | 0.00 | 0.00 |
| Aug-2012 | 15.27 | -13.16 | 0.77 | -2.96 |
| Nov-2012 | 14.83 | -4.97 | 7.48 | -11.81 |
| Feb-2013 | 36.54 | -11.46 | 3.95 | -6.64 |
| May-2013 | 39.78 | -20.09 | 45.49 | -17.30 |
| Aug-2013 | 22.86 | -14.63 | 5.93 | -9.23 |
| Nov-2013 | 56.78 | -26.82 | 38.40 | -2.57 |
| Feb-2014 | 56.52 | -11.49 | 40.59 | -9.10 |
| May-2014 | 48.77 | 3.15 | 41.82 | -16.33 |
| Aug-2014 | 42.56 | 10.57 | 37.80 | -32.11 |
| Nov-2014 | 31.71 | 26.21 | 36.67 | -45.86 |
| Feb-2015 | 100.72 | 57.93 | 31.41 | -51.06 |
| May-2015 | 139.12 | 88.15 | 19.21 | -51.61 |
| Aug-2015 | 160.18 | 89.36 | 50.64 | -52.21 |
| Nov-2015 | 182.54 | 95.65 | 81.98 | -51.14 |
| Feb-2016 | 160.29 | 95.44 | 92.13 | -45.80 |
Consumer prices grew by 1.3 per cent over the year to the March quarter of 2016. This weak result was driven primarily by falls in petrol prices, competition in the retail sector and moderate wage growth. Moderate wage growth is expected to continue to weigh on price growth over the forecast period, which has been downgraded since the 2015‑16 MYEFO. CPI inflation is forecast to be 1¼ per cent through the year to the June quarter of 2016 and 2 per cent through the year to the June quarter of 2017. A strengthening economy and increases in tobacco excise are expected to support an increase in inflation to 2¼ per cent through the year to the June quarter of 2018.
Outlook for nominal GDP
Nominal GDP growth is forecast to be a little lower than at the 2015‑16 MYEFO, reflecting weaker forecast inflation in 2015‑16 and slightly lower forecast growth in real GDP in 2016‑17. The level of nominal GDP is expected to be lower than at the 2015‑16 MYEFO over the forward estimates, reflecting weaker wages and inflation. This has contributed to lower tax receipts, excluding new policy, of $13.5 billion over the four years to 2018‑19 compared with the 2015‑16 MYEFO (see Statement 4: Revenue).
Low commodity prices continue to weigh on Australia's terms of trade but some renewed strength since the beginning of 2016 has led to some upward revisions to the forecast terms of trade since the 2015‑16 MYEFO. The terms of trade are now forecast to fall by 8¾ per cent in 2015‑16, before increasing by 1¼ per cent in 2016‑17 compared with falls of 10½ per cent and 2¼ per cent respectively at the 2015‑16 MYEFO.
Continuing the approach taken at the 2015‑16 Budget, the price of oil and key commodity export prices that underpin the forecasts are based on a recent average.
Iron ore prices have risen recently in US dollar terms. The iron ore price underpinning the forecasts is $US55 per tonne Free on Board (FOB), compared with $US39 per tonne FOB at the 2015‑16 MYEFO. Metallurgical coal is also a key input into steel production. The metallurgical coal price is $US91 per tonne FOB compared with $US73 per tonne at the 2015‑16 MYEFO. The price of thermal coal remains unchanged in US dollar terms since the 2015‑16 MYEFO.
Although prices for some key commodities have increased in US dollar terms since the 2015‑16 MYEFO, the overall impact on nominal GDP has been partly offset by an appreciation in the Australian dollar. Australia's key commodities are traded in US dollars and a higher exchange rate has reduced the price exporters receive in Australian dollar terms. The exchange rate is now assumed to be 77 cents against the US dollar compared with 72 cents at the 2015‑16 MYEFO.
A key risk to the nominal GDP forecast is the volatility and uncertainty around movements in commodity prices. The inherent uncertainty around both supply and demand factors means the outlook for the price of iron ore is subject to considerable risk.
The impact of iron ore prices being US$10 per tonne lower/higher, based on the sensitivity analysis presented in Statement 7 is set out in Table 3. A US$10 per tonne reduction/increase in the iron ore price results in just over a $6 billion reduction/increase in nominal GDP in 2016‑17. These illustrative impacts differ from those presented in the 2015‑16 Budget due to a more comprehensive analysis presented in this year's Statement 7. In particular, the sensitivity analysis now assumes that export commodity prices fall/rise over the course of a year rather than an immediate movement. The effect of this is to reduce the impact in the first year of the analysis. The effect in the second year is in line with the earlier sensitivity analysis. For purposes of comparison an immediate fall/rise in the iron ore price would have a direct effect in the first year of around an $11 billion reduction/increase in nominal GDP in that year.
| US$45/tonne FOB(b) spot price | US$65/tonne FOB spot price | ||||
|---|---|---|---|---|---|
| 2016‑17(c) | 2017‑18 | 2016‑17(c) | 2017‑18 | ||
| Nominal GDP ($billion) | -6.1 | -13.4 | 6.1 | 13.4 | |
| Tax Receipts ($billion) | -1.4 | -3.9 | 1.4 | 3.9 | |
(a) Key aggregates are shown relative to the 2016‑17 Budget iron ore price forecast of US$55/tonne and based on an exchange rate assumption of 77 US cents.
(b) FOB is the free‑on‑board price which excludes freight costs.
(c) This is the price by the end of 2016‑17.
Source: Treasury.
Box 5: Lower oil prices to support economic growth
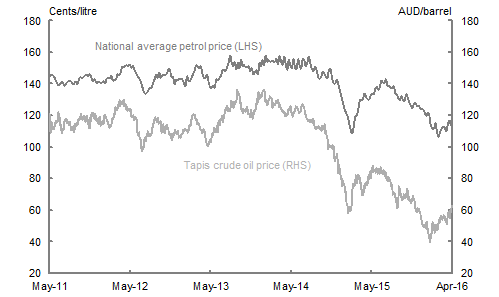
The price of oil (Tapis crude) has fallen around 50 per cent in Australian dollar terms over the past two years. There have been significant developments in the supply of oil in recent years, including increased production by OPEC members, the US and most recently by Iran following the recent lifting of sanctions. Slower than expected global growth has also contributed to demand for oil being lower than it otherwise would have been.
Oil remains one of the major inputs into the global production process. For this reason, a sustained supply‑driven fall in the price of oil in the past has supported global economic growth. During 2015, however, global growth does not appear to have responded as strongly as might have been expected based on historical experience. Factors likely to be muting the positive net impact of lower oil prices on global growth include cutbacks in public expenditure in oil producing nations, detracting from their economic growth; detraction from global economic growth from lower energy investment; and a smaller than expected increase in global private consumption, perhaps as consumers save part of the windfall from lower oil prices.
Australia is currently a net importer of oil and petroleum products, and Australian households and many businesses are benefiting from the fall in oil prices, primarily through lower prices for automotive fuel which fell around 25 per cent over the past two years (Chart A). Lower oil prices also reduce the input costs for a number of consumer and other goods, putting downward pressure on prices. Further, lower travel costs may contribute to a further strengthening in demand for Australia's tourism exports.
Source: Bloomberg and Australian Institute of Petroleum.
| AIP petrol price | TAPIS oil price | ||
|---|---|---|---|
| 2/01/2011 | 127.9 | 4/01/2011 | 96.13 |
| 9/01/2011 | 130.5 | 5/01/2011 | 92.7 |
| 16/01/2011 | 131.7 | 6/01/2011 | 95.6 |
| 23/01/2011 | 133.3 | 7/01/2011 | 100.22 |
| 30/01/2011 | 135.0 | 10/01/2011 | 100.19 |
| 6/02/2011 | 135.2 | 11/01/2011 | 102.3 |
| 13/02/2011 | 134.8 | 12/01/2011 | 104.88 |
| 20/02/2011 | 135.1 | 13/01/2011 | 104.81 |
| 27/02/2011 | 136.3 | 14/01/2011 | 105.49 |
| 6/03/2011 | 139.2 | 17/01/2011 | 104.53 |
| 13/03/2011 | 142.7 | 18/01/2011 | 104.19 |
| 20/03/2011 | 143.2 | 19/01/2011 | 104.16 |
| 27/03/2011 | 143.0 | 20/01/2011 | 105.35 |
| 3/04/2011 | 143.6 | 21/01/2011 | 104.52 |
| 10/04/2011 | 143.9 | 24/01/2011 | 101.45 |
| 17/04/2011 | 144.6 | 25/01/2011 | 101.11 |
| 24/04/2011 | 144.1 | 26/01/2011 | 100.68 |
| 1/05/2011 | 144.6 | 27/01/2011 | 102.42 |
| 8/05/2011 | 145.9 | 28/01/2011 | 101.26 |
| 15/05/2011 | 145.7 | 31/01/2011 | 102.04 |
| 22/05/2011 | 144.7 | 1/02/2011 | 102.02 |
| 29/05/2011 | 142.2 | 2/02/2011 | 104.03 |
| 5/06/2011 | 140.4 | 7/02/2011 | 101.62 |
| 12/06/2011 | 139.1 | 8/02/2011 | 99.66 |
| 19/06/2011 | 140.2 | 9/02/2011 | 102.03 |
| 26/06/2011 | 141.4 | 10/02/2011 | 103.93 |
| 3/07/2011 | 140.2 | 11/02/2011 | 104.57 |
| 10/07/2011 | 138.9 | 14/02/2011 | 104.77 |
| 17/07/2011 | 140.7 | 15/02/2011 | 107.5 |
| 24/07/2011 | 141.8 | 16/02/2011 | 105.38 |
| 31/07/2011 | 142.0 | 17/02/2011 | 106.51 |
| 7/08/2011 | 141.5 | 18/02/2011 | 104.66 |
| 14/08/2011 | 140.1 | 21/02/2011 | 106.31 |
| 21/08/2011 | 140.2 | 22/02/2011 | 110.88 |
| 28/08/2011 | 141.5 | 23/02/2011 | 110.5 |
| 4/09/2011 | 139.8 | 24/02/2011 | 119.35 |
| 11/09/2011 | 142.8 | 25/02/2011 | 114.14 |
| 18/09/2011 | 144.5 | 28/02/2011 | 114.64 |
| 25/09/2011 | 143.6 | 1/03/2011 | 112.95 |
| 2/10/2011 | 144.6 | 2/03/2011 | 116.49 |
| 9/10/2011 | 145.3 | 3/03/2011 | 116.83 |
| 16/10/2011 | 145.8 | 4/03/2011 | 117.64 |
| 23/10/2011 | 145.0 | 7/03/2011 | 118.31 |
| 30/10/2011 | 146.3 | 8/03/2011 | 116.8 |
| 6/11/2011 | 144.1 | 9/03/2011 | 116 |
| 13/11/2011 | 141.6 | 10/03/2011 | 118.74 |
| 20/11/2011 | 143.0 | 11/03/2011 | 115.86 |
| 27/11/2011 | 141.5 | 14/03/2011 | 113.89 |
| 4/12/2011 | 140.7 | 15/03/2011 | 116.12 |
| 11/12/2011 | 141.7 | 16/03/2011 | 116.18 |
| 18/12/2011 | 140.7 | 17/03/2011 | 119.04 |
| 25/12/2011 | 140.9 | 18/03/2011 | 121.46 |
| 1/01/2012 | 141.7 | 21/03/2011 | 119.7 |
| 8/01/2012 | 140.3 | 22/03/2011 | 117.9 |
| 15/01/2012 | 143.4 | 23/03/2011 | 119.29 |
| 22/01/2012 | 144.0 | 24/03/2011 | 118.31 |
| 29/01/2012 | 143.5 | 25/03/2011 | 118.04 |
| 5/02/2012 | 145.1 | 28/03/2011 | 117.19 |
| 12/02/2012 | 142.4 | 29/03/2011 | 116.65 |
| 19/02/2012 | 142.2 | 30/03/2011 | 117.48 |
| 26/02/2012 | 142.9 | 31/03/2011 | 118.37 |
| 4/03/2012 | 146.0 | 1/04/2011 | 119.23 |
| 11/03/2012 | 145.8 | 4/04/2011 | 121.11 |
| 18/03/2012 | 147.1 | 5/04/2011 | 122.41 |
| 25/03/2012 | 150.7 | 6/04/2011 | 123.65 |
| 1/04/2012 | 150.6 | 7/04/2011 | 122.66 |
| 8/04/2012 | 151.6 | 8/04/2011 | 123.73 |
| 15/04/2012 | 151.7 | 11/04/2011 | 125.59 |
| 22/04/2012 | 151.6 | 12/04/2011 | 125.1 |
| 29/04/2012 | 152.2 | 13/04/2011 | 122.09 |
| 6/05/2012 | 150.2 | 14/04/2011 | 122.58 |
| 13/05/2012 | 151.4 | 15/04/2011 | 121.5 |
| 20/05/2012 | 148.9 | 18/04/2011 | 122.96 |
| 27/05/2012 | 146.8 | 19/04/2011 | 120.37 |
| 3/06/2012 | 145.1 | 20/04/2011 | 121.26 |
| 10/06/2012 | 143.6 | 21/04/2011 | 121.45 |
| 17/06/2012 | 141.6 | 25/04/2011 | 122.18 |
| 24/06/2012 | 138.6 | 26/04/2011 | 121.52 |
| 1/07/2012 | 135.3 | 27/04/2011 | 121.34 |
| 8/07/2012 | 133.9 | 28/04/2011 | 121.35 |
| 15/07/2012 | 134.4 | 29/04/2011 | 120.44 |
| 22/07/2012 | 136.2 | 3/05/2011 | 120.37 |
| 29/07/2012 | 137.7 | 4/05/2011 | 120.86 |
| 5/08/2012 | 137.6 | 5/05/2011 | 119.31 |
| 12/08/2012 | 140.3 | 6/05/2011 | 109.12 |
| 19/08/2012 | 142.9 | 9/05/2011 | 110.57 |
| 26/08/2012 | 145.8 | 10/05/2011 | 112.68 |
| 2/09/2012 | 144.0 | 11/05/2011 | 115.96 |
| 9/09/2012 | 147.4 | 12/05/2011 | 111.33 |
| 16/09/2012 | 143.9 | 13/05/2011 | 114.03 |
| 23/09/2012 | 145.7 | 16/05/2011 | 112.6 |
| 30/09/2012 | 145.6 | 18/05/2011 | 111.42 |
| 7/10/2012 | 145.7 | 19/05/2011 | 112.18 |
| 14/10/2012 | 146.5 | 20/05/2011 | 111.79 |
| 21/10/2012 | 149.4 | 23/05/2011 | 111.76 |
| 28/10/2012 | 148.8 | 24/05/2011 | 113.43 |
| 4/11/2012 | 144.4 | 25/05/2011 | 114.98 |
| 11/11/2012 | 144.4 | 26/05/2011 | 115.79 |
| 18/11/2012 | 139.9 | 27/05/2011 | 115.39 |
| 25/11/2012 | 142.7 | 30/05/2011 | 115.16 |
| 2/12/2012 | 142.4 | 31/05/2011 | 116.9 |
| 9/12/2012 | 143.4 | 1/06/2011 | 116.8 |
| 16/12/2012 | 143.2 | 2/06/2011 | 115.3 |
| 23/12/2012 | 143.0 | 3/06/2011 | 115.75 |
| 30/12/2012 | 141.0 | 6/06/2011 | 115.86 |
| 6/01/2013 | 138.6 | 7/06/2011 | 116.1 |
| 13/01/2013 | 144.9 | 8/06/2011 | 118.12 |
| 20/01/2013 | 141.9 | 9/06/2011 | 119.88 |
| 27/01/2013 | 141.9 | 10/06/2011 | 122.09 |
| 3/02/2013 | 144.0 | 13/06/2011 | 119.67 |
| 10/02/2013 | 146.2 | 14/06/2011 | 119.44 |
| 17/02/2013 | 148.6 | 15/06/2011 | 119.67 |
| 24/02/2013 | 152.0 | 16/06/2011 | 116.14 |
| 3/03/2013 | 150.9 | 17/06/2011 | 114.31 |
| 10/03/2013 | 149.9 | 20/06/2011 | 113.63 |
| 17/03/2013 | 151.2 | 21/06/2011 | 114.08 |
| 24/03/2013 | 146.8 | 22/06/2011 | 112.66 |
| 31/03/2013 | 143.9 | 23/06/2011 | 114.41 |
| 7/04/2013 | 143.8 | 24/06/2011 | 110.43 |
| 14/04/2013 | 146.1 | 27/06/2011 | 108.7 |
| 21/04/2013 | 141.5 | 28/06/2011 | 109.89 |
| 28/04/2013 | 137.9 | 29/06/2011 | 110.36 |
| 5/05/2013 | 137.8 | 30/06/2011 | 111.8 |
| 12/05/2013 | 139.0 | 1/07/2011 | 111.89 |
| 19/05/2013 | 137.5 | 4/07/2011 | 111.27 |
| 26/05/2013 | 142.9 | 5/07/2011 | 112.2 |
| 2/06/2013 | 142.4 | 6/07/2011 | 112.8 |
| 9/06/2013 | 143.7 | 7/07/2011 | 113.92 |
| 16/06/2013 | 145.2 | 8/07/2011 | 116.6 |
| 23/06/2013 | 148.6 | 11/07/2011 | 117.35 |
| 30/06/2013 | 148.8 | 12/07/2011 | 116.79 |
| 7/07/2013 | 148.1 | 13/07/2011 | 117.23 |
| 14/07/2013 | 150.8 | 14/07/2011 | 118.21 |
| 21/07/2013 | 153.5 | 15/07/2011 | 116.4 |
| 28/07/2013 | 158.0 | 18/07/2011 | 117.83 |
| 4/08/2013 | 153.5 | 19/07/2011 | 116.85 |
| 11/08/2013 | 151.2 | 20/07/2011 | 115.77 |
| 18/08/2013 | 153.7 | 21/07/2011 | 115.12 |
| 25/08/2013 | 149.2 | 22/07/2011 | 116.09 |
| 1/09/2013 | 153.3 | 25/07/2011 | 115.88 |
| 8/09/2013 | 150.0 | 26/07/2011 | 115.12 |
| 15/09/2013 | 155.6 | 27/07/2011 | 114.59 |
| 22/09/2013 | 151.7 | 28/07/2011 | 114.67 |
| 29/09/2013 | 151.9 | 29/07/2011 | 113.95 |
| 6/10/2013 | 150.7 | 1/08/2011 | 116.18 |
| 13/10/2013 | 150.9 | 2/08/2011 | 114.91 |
| 20/10/2013 | 151.0 | 3/08/2011 | 115.65 |
| 27/10/2013 | 148.0 | 4/08/2011 | 114.88 |
| 3/11/2013 | 149.9 | 5/08/2011 | 111.58 |
| 10/11/2013 | 146.2 | 8/08/2011 | 110.58 |
| 17/11/2013 | 147.2 | 10/08/2011 | 111.63 |
| 24/11/2013 | 148.7 | 11/08/2011 | 111.61 |
| 1/12/2013 | 146.1 | 12/08/2011 | 112.57 |
| 8/12/2013 | 153.4 | 15/08/2011 | 110.94 |
| 15/12/2013 | 151.3 | 16/08/2011 | 111.71 |
| 22/12/2013 | 155.2 | 17/08/2011 | 112.65 |
| 29/12/2013 | 152.1 | 18/08/2011 | 113.32 |
| 5/01/2014 | 158.1 | 19/08/2011 | 109.53 |
| 12/01/2014 | 154.1 | 22/08/2011 | 110.31 |
| 19/01/2014 | 155.1 | 23/08/2011 | 112.06 |
| 26/01/2014 | 154.1 | 24/08/2011 | 113.03 |
| 2/02/2014 | 154.6 | 25/08/2011 | 114.69 |
| 9/02/2014 | 154.3 | 26/08/2011 | 112.99 |
| 16/02/2014 | 154.0 | 29/08/2011 | 113.36 |
| 23/02/2014 | 156.0 | 31/08/2011 | 115.21 |
| 2/03/2014 | 152.6 | 1/09/2011 | 113.52 |
| 9/03/2014 | 157.6 | 2/09/2011 | 114.25 |
| 16/03/2014 | 154.0 | 5/09/2011 | 114.17 |
| 23/03/2014 | 152.3 | 6/09/2011 | 114.4 |
| 30/03/2014 | 157.3 | 7/09/2011 | 114.27 |
| 6/04/2014 | 152.3 | 8/09/2011 | 116.44 |
| 13/04/2014 | 149.1 | 9/09/2011 | 117.73 |
| 20/04/2014 | 155.4 | 12/09/2011 | 116.81 |
| 27/04/2014 | 151.6 | 13/09/2011 | 117.11 |
| 4/05/2014 | 150.2 | 14/09/2011 | 118.03 |
| 11/05/2014 | 155.9 | 15/09/2011 | 119.08 |
| 18/05/2014 | 150.2 | 16/09/2011 | 118.7 |
| 25/05/2014 | 149.5 | 19/09/2011 | 119.7 |
| 1/06/2014 | 155.7 | 20/09/2011 | 117.44 |
| 8/06/2014 | 151.7 | 21/09/2011 | 119.21 |
| 15/06/2014 | 149.9 | 22/09/2011 | 121.16 |
| 22/06/2014 | 155.7 | 23/09/2011 | 119.61 |
| 29/06/2014 | 155.3 | 26/09/2011 | 118.81 |
| 6/07/2014 | 151.3 | 27/09/2011 | 117.36 |
| 13/07/2014 | 153.7 | 28/09/2011 | 118.84 |
| 20/07/2014 | 157.3 | 29/09/2011 | 117.84 |
| 27/07/2014 | 152.6 | 30/09/2011 | 118.28 |
| 3/08/2014 | 149.3 | 3/10/2011 | 118.7 |
| 10/08/2014 | 148.3 | 4/10/2011 | 119.59 |
| 17/08/2014 | 151.1 | 5/10/2011 | 117.56 |
| 24/08/2014 | 148.8 | 6/10/2011 | 118.61 |
| 31/08/2014 | 144.4 | 7/10/2011 | 119.56 |
| 7/09/2014 | 143.2 | 10/10/2011 | 115.97 |
| 14/09/2014 | 144.8 | 11/10/2011 | 118.25 |
| 21/09/2014 | 147.6 | 12/10/2011 | 119.21 |
| 28/09/2014 | 146.5 | 13/10/2011 | 119.13 |
| 5/10/2014 | 144.7 | 14/10/2011 | 118.83 |
| 12/10/2014 | 143.8 | 17/10/2011 | 119.93 |
| 19/10/2014 | 149.0 | 18/10/2011 | 116.34 |
| 26/10/2014 | 149.6 | 19/10/2011 | 116.61 |
| 2/11/2014 | 143.9 | 20/10/2011 | 116.38 |
| 9/11/2014 | 140.5 | 21/10/2011 | 115.02 |
| 16/11/2014 | 140.3 | 24/10/2011 | 114.19 |
| 23/11/2014 | 142.8 | 25/10/2011 | 117.37 |
| 30/11/2014 | 140.0 | 27/10/2011 | 113.45 |
| 7/12/2014 | 136.2 | 28/10/2011 | 111.92 |
| 14/12/2014 | 132.4 | 31/10/2011 | 111.9 |
| 21/12/2014 | 128.4 | 1/11/2011 | 114.51 |
| 28/12/2014 | 124.2 | 2/11/2011 | 118.68 |
| 4/01/2015 | 121.9 | 3/11/2011 | 116.12 |
| 11/01/2015 | 119.7 | 4/11/2011 | 118.71 |
| 18/01/2015 | 115.7 | 8/11/2011 | 121.42 |
| 25/01/2015 | 111.0 | 9/11/2011 | 121.94 |
| 1/02/2015 | 108.6 | 10/11/2011 | 120.55 |
| 8/02/2015 | 112.6 | 11/11/2011 | 120.43 |
| 15/02/2015 | 119.5 | 14/11/2011 | 121.64 |
| 22/02/2015 | 119.8 | 15/11/2011 | 119.67 |
| 1/03/2015 | 124.1 | 16/11/2011 | 119.61 |
| 8/03/2015 | 129.8 | 17/11/2011 | 120.46 |
| 15/03/2015 | 129.7 | 18/11/2011 | 119.9 |
| 22/03/2015 | 130.1 | 21/11/2011 | 118.02 |
| 29/03/2015 | 134.0 | 22/11/2011 | 118.22 |
| 5/04/2015 | 131.7 | 23/11/2011 | 121.42 |
| 12/04/2015 | 130.3 | 24/11/2011 | 120.67 |
| 19/04/2015 | 130.1 | 25/11/2011 | 120.44 |
| 26/04/2015 | 132.6 | 28/11/2011 | 119.27 |
| 3/05/2015 | 133.6 | 29/11/2011 | 118.44 |
| 10/05/2015 | 133.5 | 30/11/2011 | 116.8 |
| 17/05/2015 | 136.9 | 1/12/2011 | 117.15 |
| 24/05/2015 | 138.3 | 2/12/2011 | 116.26 |
| 31/05/2015 | 136.1 | 5/12/2011 | 117.53 |
| 7/06/2015 | 138.4 | 6/12/2011 | 116.67 |
| 14/06/2015 | 142.1 | 7/12/2011 | 117.72 |
| 21/06/2015 | 140.9 | 8/12/2011 | 118.12 |
| 28/06/2015 | 140.9 | 9/12/2011 | 114.84 |
| 5/07/2015 | 143 | 12/12/2011 | 116.11 |
| 12/07/2015 | 138.6 | 13/12/2011 | 116.03 |
| 19/07/2015 | 138.9 | 14/12/2011 | 119.38 |
| 26/07/2015 | 137.1 | 15/12/2011 | 116.26 |
| 2/08/2015 | 137.7 | 16/12/2011 | 114.75 |
| 9/08/2015 | 138.5 | 19/12/2011 | 114.6 |
| 16/08/2015 | 134.2 | 20/12/2011 | 113.47 |
| 23/08/2015 | 133.4 | 21/12/2011 | 115.58 |
| 30/08/2015 | 130.9 | 22/12/2011 | 115.68 |
| 6/09/2015 | 129.8 | 23/12/2011 | 115.27 |
| 13/09/2015 | 132.2 | 27/12/2011 | 115.58 |
| 20/09/2015 | 129.70 | 28/12/2011 | 116.65 |
| 27/09/2015 | 129.20 | 29/12/2011 | 115.83 |
| 4/10/2015 | 133.60 | 30/12/2011 | 114.59 |
| 11/10/2015 | 131.30 | 3/01/2012 | 115.37 |
| 18/10/2015 | 128.30 | 4/01/2012 | 117.66 |
| 25/10/2015 | 126.20 | 5/01/2012 | 120.33 |
| 1/11/2015 | 124.70 | 6/01/2012 | 120.57 |
| 8/11/2015 | 127.30 | 9/01/2012 | 120.16 |
| 15/11/2015 | 127.70 | 10/01/2012 | 118.73 |
| 22/11/2015 | 126.20 | 11/01/2012 | 119.7 |
| 29/11/2015 | 126.30 | 12/01/2012 | 119.17 |
| 6/12/2015 | 124.70 | 13/01/2012 | 118.32 |
| 13/12/2015 | 124.20 | 16/01/2012 | 117.28 |
| 20/12/2015 | 123.90 | 17/01/2012 | 117.54 |
| 27/12/2015 | 122.20 | 18/01/2012 | 116.74 |
| 3/01/2016 | 119.80 | 19/01/2012 | 116.05 |
| 10/01/2016 | 121.90 | 20/01/2012 | 116.1 |
| 17/01/2016 | 120.00 | 25/01/2012 | 113.54 |
| 24/01/2016 | 113.70 | 26/01/2012 | 112.31 |
| 31/01/2016 | 111.90 | 27/01/2012 | 112.36 |
| 7/02/2016 | 111.60 | 30/01/2012 | 113.28 |
| 14/02/2016 | 115.10 | 31/01/2012 | 113.39 |
| 21/02/2016 | 109.30 | 1/02/2012 | 112.65 |
| 28/02/2016 | 106.50 | 2/02/2012 | 113.08 |
| 6/03/2016 | 109.50 | 3/02/2012 | 112.71 |
| 13/03/2016 | 111.80 | 6/02/2012 | 114.42 |
| 20/03/2016 | 112.70 | 7/02/2012 | 115.48 |
| 27/03/2016 | 112.30 | 8/02/2012 | 115.92 |
| 3/04/2016 | 110.30 | 9/02/2012 | 116.02 |
| 10/04/2016 | 114.40 | 10/02/2012 | 118.2 |
| 13/02/2012 | 117.49 | ||
| 14/02/2012 | 117.87 | ||
| 15/02/2012 | 118.76 | ||
| 16/02/2012 | 118.67 | ||
| 17/02/2012 | 121.23 | ||
| 20/02/2012 | 121.21 | ||
| 21/02/2012 | 120.72 | ||
| 22/02/2012 | 122.69 | ||
| 23/02/2012 | 124.45 | ||
| 24/02/2012 | 125.21 | ||
| 27/02/2012 | 124.74 | ||
| 28/02/2012 | 124.3 | ||
| 29/02/2012 | 123.26 | ||
| 1/03/2012 | 123.4 | ||
| 2/03/2012 | 125.3 | ||
| 5/03/2012 | 125.02 | ||
| 6/03/2012 | 126.16 | ||
| 7/03/2012 | 124.59 | ||
| 8/03/2012 | 126.07 | ||
| 9/03/2012 | 127.3 | ||
| 12/03/2012 | 128.65 | ||
| 13/03/2012 | 128.65 | ||
| 14/03/2012 | 129.94 | ||
| 15/03/2012 | 127.64 | ||
| 16/03/2012 | 125.6 | ||
| 19/03/2012 | 127.3 | ||
| 20/03/2012 | 128.29 | ||
| 21/03/2012 | 128.11 | ||
| 22/03/2012 | 127.82 | ||
| 23/03/2012 | 127.46 | ||
| 26/03/2012 | 127.97 | ||
| 27/03/2012 | 129.03 | ||
| 28/03/2012 | 129.28 | ||
| 29/03/2012 | 129.49 | ||
| 30/03/2012 | 128.21 | ||
| 2/04/2012 | 125.93 | ||
| 3/04/2012 | 129.06 | ||
| 4/04/2012 | 130.08 | ||
| 5/04/2012 | 127.93 | ||
| 9/04/2012 | 127.19 | ||
| 10/04/2012 | 127.34 | ||
| 11/04/2012 | 125.18 | ||
| 12/04/2012 | 124.09 | ||
| 13/04/2012 | 126.07 | ||
| 16/04/2012 | 124.9 | ||
| 17/04/2012 | 123.25 | ||
| 18/04/2012 | 122.84 | ||
| 19/04/2012 | 124.3 | ||
| 20/04/2012 | 123.08 | ||
| 23/04/2012 | 123.67 | ||
| 24/04/2012 | 124.28 | ||
| 25/04/2012 | 123.85 | ||
| 26/04/2012 | 123.95 | ||
| 27/04/2012 | 122.99 | ||
| 30/04/2012 | 123.16 | ||
| 2/05/2012 | 124.11 | ||
| 3/05/2012 | 123.2 | ||
| 4/05/2012 | 121.58 | ||
| 7/05/2012 | 118.77 | ||
| 8/05/2012 | 119.85 | ||
| 9/05/2012 | 119.93 | ||
| 10/05/2012 | 119.98 | ||
| 11/05/2012 | 119.31 | ||
| 14/05/2012 | 118.84 | ||
| 15/05/2012 | 120.14 | ||
| 16/05/2012 | 119.67 | ||
| 17/05/2012 | 119.34 | ||
| 18/05/2012 | 117 | ||
| 21/05/2012 | 117.28 | ||
| 22/05/2012 | 118.72 | ||
| 23/05/2012 | 119.55 | ||
| 24/05/2012 | 117.65 | ||
| 25/05/2012 | 118.46 | ||
| 28/05/2012 | 118.2 | ||
| 29/05/2012 | 118.44 | ||
| 30/05/2012 | 117.31 | ||
| 31/05/2012 | 115.78 | ||
| 1/06/2012 | 111.86 | ||
| 4/06/2012 | 107.46 | ||
| 5/06/2012 | 109.36 | ||
| 6/06/2012 | 108.79 | ||
| 7/06/2012 | 108.85 | ||
| 8/06/2012 | 107.47 | ||
| 11/06/2012 | 109.55 | ||
| 12/06/2012 | 106.4 | ||
| 13/06/2012 | 105.59 | ||
| 14/06/2012 | 104.95 | ||
| 15/06/2012 | 105.13 | ||
| 18/06/2012 | 104.39 | ||
| 19/06/2012 | 101.66 | ||
| 20/06/2012 | 101.61 | ||
| 21/06/2012 | 99.18 | ||
| 22/06/2012 | 97.37 | ||
| 25/06/2012 | 98.06 | ||
| 26/06/2012 | 99.02 | ||
| 27/06/2012 | 99.44 | ||
| 28/06/2012 | 100.37 | ||
| 29/06/2012 | 98.76 | ||
| 2/07/2012 | 100.59 | ||
| 3/07/2012 | 103.13 | ||
| 4/07/2012 | 104.58 | ||
| 5/07/2012 | 105.65 | ||
| 6/07/2012 | 104.77 | ||
| 9/07/2012 | 103.84 | ||
| 10/07/2012 | 104.22 | ||
| 11/07/2012 | 103.54 | ||
| 12/07/2012 | 105.52 | ||
| 13/07/2012 | 107.03 | ||
| 16/07/2012 | 107.46 | ||
| 17/07/2012 | 108.44 | ||
| 18/07/2012 | 107.26 | ||
| 19/07/2012 | 109.01 | ||
| 20/07/2012 | 110 | ||
| 23/07/2012 | 108.21 | ||
| 24/07/2012 | 108.66 | ||
| 25/07/2012 | 108 | ||
| 26/07/2012 | 106.96 | ||
| 27/07/2012 | 108.37 | ||
| 30/07/2012 | 108.29 | ||
| 31/07/2012 | 107.92 | ||
| 1/08/2012 | 106.77 | ||
| 2/08/2012 | 108.53 | ||
| 3/08/2012 | 107.62 | ||
| 6/08/2012 | 108.8 | ||
| 7/08/2012 | 110.55 | ||
| 8/08/2012 | 111.57 | ||
| 10/08/2012 | 112.51 | ||
| 13/08/2012 | 114.74 | ||
| 14/08/2012 | 114.72 | ||
| 15/08/2012 | 114.77 | ||
| 16/08/2012 | 116.86 | ||
| 17/08/2012 | 117.25 | ||
| 21/08/2012 | 116.85 | ||
| 22/08/2012 | 117.26 | ||
| 23/08/2012 | 119 | ||
| 24/08/2012 | 118.11 | ||
| 27/08/2012 | 118.14 | ||
| 28/08/2012 | 116.3 | ||
| 29/08/2012 | 115.66 | ||
| 30/08/2012 | 117.85 | ||
| 31/08/2012 | 117.62 | ||
| 3/09/2012 | 116.83 | ||
| 4/09/2012 | 118.92 | ||
| 5/09/2012 | 116.87 | ||
| 6/09/2012 | 116.04 | ||
| 7/09/2012 | 114.84 | ||
| 10/09/2012 | 116.23 | ||
| 11/09/2012 | 115.23 | ||
| 12/09/2012 | 116.31 | ||
| 13/09/2012 | 115.9 | ||
| 14/09/2012 | 116.58 | ||
| 17/09/2012 | 116.47 | ||
| 18/09/2012 | 113.98 | ||
| 19/09/2012 | 112.57 | ||
| 20/09/2012 | 108.74 | ||
| 21/09/2012 | 110.96 | ||
| 24/09/2012 | 111.05 | ||
| 25/09/2012 | 111.58 | ||
| 26/09/2012 | 111.54 | ||
| 27/09/2012 | 111.08 | ||
| 28/09/2012 | 114.62 | ||
| 1/10/2012 | 110.17 | ||
| 2/10/2012 | 111.3 | ||
| 3/10/2012 | 110.54 | ||
| 4/10/2012 | 108.58 | ||
| 5/10/2012 | 111.63 | ||
| 8/10/2012 | 111.21 | ||
| 9/10/2012 | 112.43 | ||
| 10/10/2012 | 113.51 | ||
| 11/10/2012 | 113.87 | ||
| 12/10/2012 | 114.14 | ||
| 15/10/2012 | 113.69 | ||
| 16/10/2012 | 114.23 | ||
| 17/10/2012 | 112.51 | ||
| 18/10/2012 | 112.09 | ||
| 19/10/2012 | 112.14 | ||
| 22/10/2012 | 110.17 | ||
| 23/10/2012 | 109.38 | ||
| 24/10/2012 | 108.11 | ||
| 25/10/2012 | 107.81 | ||
| 29/10/2012 | 108.31 | ||
| 30/10/2012 | 108.29 | ||
| 31/10/2012 | 108.35 | ||
| 1/11/2012 | 106.89 | ||
| 2/11/2012 | 106.73 | ||
| 5/11/2012 | 104.34 | ||
| 6/11/2012 | 105.67 | ||
| 7/11/2012 | 108.56 | ||
| 8/11/2012 | 105.62 | ||
| 9/11/2012 | 105.78 | ||
| 12/11/2012 | 107.03 | ||
| 14/11/2012 | 107.22 | ||
| 15/11/2012 | 108.98 | ||
| 16/11/2012 | 108.36 | ||
| 19/11/2012 | 109.11 | ||
| 20/11/2012 | 110.99 | ||
| 21/11/2012 | 110.12 | ||
| 22/11/2012 | 110.01 | ||
| 23/11/2012 | 108.99 | ||
| 26/11/2012 | 109.7 | ||
| 27/11/2012 | 109.78 | ||
| 28/11/2012 | 108.17 | ||
| 29/11/2012 | 109.15 | ||
| 30/11/2012 | 109.47 | ||
| 3/12/2012 | 110.29 | ||
| 4/12/2012 | 109.28 | ||
| 5/12/2012 | 109.11 | ||
| 6/12/2012 | 107.58 | ||
| 7/12/2012 | 105.99 | ||
| 10/12/2012 | 106.36 | ||
| 11/12/2012 | 106.2 | ||
| 12/12/2012 | 106.27 | ||
| 13/12/2012 | 107.22 | ||
| 14/12/2012 | 106.31 | ||
| 17/12/2012 | 105.97 | ||
| 18/12/2012 | 106.28 | ||
| 19/12/2012 | 107.77 | ||
| 20/12/2012 | 108.47 | ||
| 21/12/2012 | 108.71 | ||
| 24/12/2012 | 108.49 | ||
| 26/12/2012 | 109.32 | ||
| 27/12/2012 | 110.91 | ||
| 28/12/2012 | 110.21 | ||
| 31/12/2012 | 109.91 | ||
| 2/01/2013 | 111.43 | ||
| 3/01/2013 | 111.44 | ||
| 4/01/2013 | 111.42 | ||
| 7/01/2013 | 110.9 | ||
| 8/01/2013 | 111.17 | ||
| 9/01/2013 | 111.28 | ||
| 10/01/2013 | 110.98 | ||
| 11/01/2013 | 110.66 | ||
| 14/01/2013 | 110.4 | ||
| 15/01/2013 | 111.15 | ||
| 16/01/2013 | 109.01 | ||
| 17/01/2013 | 109.23 | ||
| 18/01/2013 | 110.56 | ||
| 21/01/2013 | 111.24 | ||
| 22/01/2013 | 110.71 | ||
| 23/01/2013 | 111.6 | ||
| 24/01/2013 | 112.82 | ||
| 25/01/2013 | 114.01 | ||
| 28/01/2013 | 113.8 | ||
| 29/01/2013 | 113.44 | ||
| 30/01/2013 | 114.81 | ||
| 31/01/2013 | 115.04 | ||
| 1/02/2013 | 117.09 | ||
| 4/02/2013 | 118.01 | ||
| 5/02/2013 | 117.61 | ||
| 6/02/2013 | 119.2 | ||
| 7/02/2013 | 120.38 | ||
| 8/02/2013 | 120.59 | ||
| 13/02/2013 | 120.97 | ||
| 14/02/2013 | 120.57 | ||
| 15/02/2013 | 120.36 | ||
| 19/02/2013 | 119.57 | ||
| 20/02/2013 | 120.73 | ||
| 21/02/2013 | 118.1 | ||
| 22/02/2013 | 117.11 | ||
| 25/02/2013 | 117.92 | ||
| 26/02/2013 | 117.35 | ||
| 27/02/2013 | 117.15 | ||
| 28/02/2013 | 115.84 | ||
| 1/03/2013 | 114.47 | ||
| 4/03/2013 | 114.79 | ||
| 5/03/2013 | 114.45 | ||
| 6/03/2013 | 115.08 | ||
| 7/03/2013 | 114.35 | ||
| 8/03/2013 | 114.72 | ||
| 11/03/2013 | 113.5 | ||
| 12/03/2013 | 112.93 | ||
| 13/03/2013 | 112.72 | ||
| 14/03/2013 | 110.96 | ||
| 15/03/2013 | 111.19 | ||
| 18/03/2013 | 110.73 | ||
| 19/03/2013 | 111.21 | ||
| 20/03/2013 | 110.06 | ||
| 21/03/2013 | 109.95 | ||
| 22/03/2013 | 108.75 | ||
| 25/03/2013 | 109.54 | ||
| 26/03/2013 | 109.28 | ||
| 27/03/2013 | 110.73 | ||
| 28/03/2013 | 111.35 | ||
| 1/04/2013 | 111.2 | ||
| 2/04/2013 | 111.08 | ||
| 3/04/2013 | 109.69 | ||
| 4/04/2013 | 107.72 | ||
| 5/04/2013 | 106.82 | ||
| 8/04/2013 | 105.59 | ||
| 9/04/2013 | 104.7 | ||
| 10/04/2013 | 104.82 | ||
| 11/04/2013 | 104.49 | ||
| 12/04/2013 | 102.4 | ||
| 15/04/2013 | 101.58 | ||
| 16/04/2013 | 100.69 | ||
| 17/04/2013 | 101.03 | ||
| 18/04/2013 | 100.66 | ||
| 19/04/2013 | 101.58 | ||
| 22/04/2013 | 102.32 | ||
| 23/04/2013 | 101.38 | ||
| 24/04/2013 | 103.24 | ||
| 25/04/2013 | 103.3 | ||
| 26/04/2013 | 104.57 | ||
| 29/04/2013 | 104.28 | ||
| 30/04/2013 | 104.62 | ||
| 2/05/2013 | 103.1 | ||
| 3/05/2013 | 104.81 | ||
| 6/05/2013 | 107.35 | ||
| 7/05/2013 | 108.55 | ||
| 8/05/2013 | 107.34 | ||
| 9/05/2013 | 107.07 | ||
| 10/05/2013 | 109.1 | ||
| 13/05/2013 | 108.75 | ||
| 14/05/2013 | 109.12 | ||
| 15/05/2013 | 108.95 | ||
| 16/05/2013 | 110.15 | ||
| 17/05/2013 | 112.32 | ||
| 20/05/2013 | 111.62 | ||
| 21/05/2013 | 111.5 | ||
| 22/05/2013 | 111.68 | ||
| 23/05/2013 | 109.33 | ||
| 27/05/2013 | 111.78 | ||
| 28/05/2013 | 113.15 | ||
| 29/05/2013 | 113.74 | ||
| 30/05/2013 | 110.68 | ||
| 31/05/2013 | 111.34 | ||
| 3/06/2013 | 109.57 | ||
| 4/06/2013 | 112.31 | ||
| 5/06/2013 | 115.57 | ||
| 6/06/2013 | 114.09 | ||
| 7/06/2013 | 116.29 | ||
| 10/06/2013 | 116.99 | ||
| 11/06/2013 | 116.46 | ||
| 12/06/2013 | 115.01 | ||
| 13/06/2013 | 113.89 | ||
| 14/06/2013 | 116.73 | ||
| 17/06/2013 | 118.31 | ||
| 18/06/2013 | 117.61 | ||
| 19/06/2013 | 118.51 | ||
| 20/06/2013 | 120.05 | ||
| 21/06/2013 | 118.31 | ||
| 24/06/2013 | 115.86 | ||
| 25/06/2013 | 116.82 | ||
| 26/06/2013 | 116 | ||
| 27/06/2013 | 117.15 | ||
| 28/06/2013 | 120.25 | ||
| 1/07/2013 | 118.12 | ||
| 2/07/2013 | 119.36 | ||
| 3/07/2013 | 122.1 | ||
| 4/07/2013 | 121.49 | ||
| 5/07/2013 | 123.5 | ||
| 8/07/2013 | 124.04 | ||
| 9/07/2013 | 123.48 | ||
| 10/07/2013 | 125.05 | ||
| 11/07/2013 | 125.29 | ||
| 12/07/2013 | 125.64 | ||
| 15/07/2013 | 126.27 | ||
| 16/07/2013 | 125.06 | ||
| 17/07/2013 | 123.06 | ||
| 18/07/2013 | 124.89 | ||
| 19/07/2013 | 124.66 | ||
| 22/07/2013 | 123.69 | ||
| 23/07/2013 | 123.01 | ||
| 24/07/2013 | 124.39 | ||
| 25/07/2013 | 122.67 | ||
| 26/07/2013 | 122.65 | ||
| 29/07/2013 | 123.41 | ||
| 30/07/2013 | 125.26 | ||
| 31/07/2013 | 125.47 | ||
| 1/08/2013 | 128.82 | ||
| 2/08/2013 | 129.62 | ||
| 5/08/2013 | 128.39 | ||
| 6/08/2013 | 128.18 | ||
| 7/08/2013 | 126.7 | ||
| 12/08/2013 | 124.75 | ||
| 13/08/2013 | 127.39 | ||
| 14/08/2013 | 126.45 | ||
| 15/08/2013 | 129.02 | ||
| 16/08/2013 | 126.05 | ||
| 19/08/2013 | 128.01 | ||
| 20/08/2013 | 127.02 | ||
| 21/08/2013 | 128.02 | ||
| 22/08/2013 | 128.49 | ||
| 23/08/2013 | 128.54 | ||
| 26/08/2013 | 129.74 | ||
| 27/08/2013 | 131.15 | ||
| 28/08/2013 | 135.86 | ||
| 29/08/2013 | 136.36 | ||
| 30/08/2013 | 135.89 | ||
| 2/09/2013 | 134.63 | ||
| 3/09/2013 | 134.16 | ||
| 4/09/2013 | 132.93 | ||
| 5/09/2013 | 133.78 | ||
| 6/09/2013 | 132.82 | ||
| 9/09/2013 | 132.37 | ||
| 10/09/2013 | 128.66 | ||
| 11/09/2013 | 127.7 | ||
| 12/09/2013 | 128.04 | ||
| 13/09/2013 | 128.53 | ||
| 16/09/2013 | 124.46 | ||
| 17/09/2013 | 124.22 | ||
| 18/09/2013 | 122.74 | ||
| 19/09/2013 | 124.7 | ||
| 20/09/2013 | 123.21 | ||
| 23/09/2013 | 122.54 | ||
| 24/09/2013 | 121.71 | ||
| 25/09/2013 | 124.3 | ||
| 26/09/2013 | 123.35 | ||
| 27/09/2013 | 123.92 | ||
| 30/09/2013 | 122.61 | ||
| 1/10/2013 | 122.65 | ||
| 2/10/2013 | 122.77 | ||
| 3/10/2013 | 123.92 | ||
| 4/10/2013 | 123.47 | ||
| 7/10/2013 | 122.42 | ||
| 8/10/2013 | 124.12 | ||
| 9/10/2013 | 124.39 | ||
| 10/10/2013 | 123.36 | ||
| 11/10/2013 | 125.37 | ||
| 14/10/2013 | 124.94 | ||
| 16/10/2013 | 123 | ||
| 17/10/2013 | 121.66 | ||
| 18/10/2013 | 120.7 | ||
| 21/10/2013 | 120.97 | ||
| 22/10/2013 | 120.87 | ||
| 23/10/2013 | 120.9 | ||
| 24/10/2013 | 119.49 | ||
| 25/10/2013 | 118.99 | ||
| 28/10/2013 | 120.32 | ||
| 29/10/2013 | 122.77 | ||
| 30/10/2013 | 122.36 | ||
| 31/10/2013 | 123.55 | ||
| 1/11/2013 | 123.11 | ||
| 4/11/2013 | 119.56 | ||
| 5/11/2013 | 119.58 | ||
| 6/11/2013 | 118.9 | ||
| 8/11/2013 | 117.98 | ||
| 11/11/2013 | 120.37 | ||
| 12/11/2013 | 121.69 | ||
| 13/11/2013 | 121.88 | ||
| 14/11/2013 | 122.89 | ||
| 15/11/2013 | 123.44 | ||
| 18/11/2013 | 122.95 | ||
| 19/11/2013 | 122.61 | ||
| 21/11/2013 | 124.63 | ||
| 22/11/2013 | 127.86 | ||
| 25/11/2013 | 127.1 | ||
| 26/11/2013 | 129.65 | ||
| 27/11/2013 | 130.52 | ||
| 28/11/2013 | 130.36 | ||
| 29/11/2013 | 129.89 | ||
| 2/12/2013 | 128.64 | ||
| 3/12/2013 | 132.49 | ||
| 4/12/2013 | 134.96 | ||
| 5/12/2013 | 133.81 | ||
| 9/12/2013 | 132.9 | ||
| 10/12/2013 | 130.6 | ||
| 11/12/2013 | 131.06 | ||
| 12/12/2013 | 132.9 | ||
| 13/12/2013 | 131.71 | ||
| 16/12/2013 | 133.13 | ||
| 17/12/2013 | 132.81 | ||
| 18/12/2013 | 131.99 | ||
| 19/12/2013 | 134.15 | ||
| 20/12/2013 | 133.96 | ||
| 23/12/2013 | 135.32 | ||
| 24/12/2013 | 135.42 | ||
| 26/12/2013 | 136.15 | ||
| 27/12/2013 | 136.33 | ||
| 30/12/2013 | 136.39 | ||
| 31/12/2013 | 135.19 | ||
| 2/01/2014 | 133.01 | ||
| 3/01/2014 | 129.09 | ||
| 6/01/2014 | 128.37 | ||
| 7/01/2014 | 128.66 | ||
| 8/01/2014 | 129.25 | ||
| 9/01/2014 | 129.62 | ||
| 10/01/2014 | 127.09 | ||
| 13/01/2014 | 126.44 | ||
| 14/01/2014 | 127.6 | ||
| 15/01/2014 | 127.87 | ||
| 16/01/2014 | 129.7 | ||
| 17/01/2014 | 129.51 | ||
| 20/01/2014 | 129.36 | ||
| 21/01/2014 | 130.45 | ||
| 22/01/2014 | 129.82 | ||
| 23/01/2014 | 132.28 | ||
| 24/01/2014 | 131.66 | ||
| 27/01/2014 | 131.88 | ||
| 28/01/2014 | 130.89 | ||
| 29/01/2014 | 131.26 | ||
| 30/01/2014 | 131.48 | ||
| 3/02/2014 | 129.2 | ||
| 4/02/2014 | 125.01 | ||
| 5/02/2014 | 125.74 | ||
| 6/02/2014 | 124.94 | ||
| 7/02/2014 | 125.94 | ||
| 10/02/2014 | 127.84 | ||
| 11/02/2014 | 126.7 | ||
| 12/02/2014 | 127.44 | ||
| 13/02/2014 | 126.51 | ||
| 14/02/2014 | 126.45 | ||
| 17/02/2014 | 127.34 | ||
| 18/02/2014 | 126.88 | ||
| 19/02/2014 | 128.59 | ||
| 20/02/2014 | 129.01 | ||
| 21/02/2014 | 129.29 | ||
| 24/02/2014 | 127.93 | ||
| 25/02/2014 | 128.72 | ||
| 26/02/2014 | 128.84 | ||
| 27/02/2014 | 128.21 | ||
| 28/02/2014 | 128.27 | ||
| 3/03/2014 | 130.21 | ||
| 4/03/2014 | 129.17 | ||
| 5/03/2014 | 127.64 | ||
| 6/03/2014 | 125.25 | ||
| 7/03/2014 | 125.59 | ||
| 10/03/2014 | 126.28 | ||
| 11/03/2014 | 126.98 | ||
| 12/03/2014 | 126.31 | ||
| 13/03/2014 | 125.64 | ||
| 14/03/2014 | 125.1 | ||
| 17/03/2014 | 125.07 | ||
| 18/03/2014 | 123.06 | ||
| 19/03/2014 | 123.2 | ||
| 20/03/2014 | 123.49 | ||
| 21/03/2014 | 123.9 | ||
| 24/03/2014 | 122.84 | ||
| 25/03/2014 | 122.98 | ||
| 26/03/2014 | 122.09 | ||
| 27/03/2014 | 121.4 | ||
| 28/03/2014 | 122.58 | ||
| 31/03/2014 | 122.07 | ||
| 1/04/2014 | 122.34 | ||
| 2/04/2014 | 120.26 | ||
| 3/04/2014 | 119.36 | ||
| 4/04/2014 | 121.1 | ||
| 7/04/2014 | 120.52 | ||
| 8/04/2014 | 119.8 | ||
| 9/04/2014 | 121.31 | ||
| 10/04/2014 | 120.39 | ||
| 11/04/2014 | 120.18 | ||
| 14/04/2014 | 120.67 | ||
| 15/04/2014 | 122.64 | ||
| 16/04/2014 | 123.77 | ||
| 17/04/2014 | 124.09 | ||
| 21/04/2014 | 123.61 | ||
| 22/04/2014 | 123.68 | ||
| 23/04/2014 | 124.61 | ||
| 24/04/2014 | 124.77 | ||
| 25/04/2014 | 125.44 | ||
| 28/04/2014 | 126.06 | ||
| 29/04/2014 | 124.8 | ||
| 30/04/2014 | 124.23 | ||
| 2/05/2014 | 122 | ||
| 5/05/2014 | 121.87 | ||
| 6/05/2014 | 120.36 | ||
| 7/05/2014 | 119.49 | ||
| 8/05/2014 | 119.18 | ||
| 9/05/2014 | 120.78 | ||
| 12/05/2014 | 122.42 | ||
| 14/05/2014 | 121.26 | ||
| 15/05/2014 | 122.14 | ||
| 16/05/2014 | 122.25 | ||
| 19/05/2014 | 124.09 | ||
| 20/05/2014 | 124.67 | ||
| 21/05/2014 | 125.7 | ||
| 22/05/2014 | 125.92 | ||
| 23/05/2014 | 125.73 | ||
| 26/05/2014 | 124.85 | ||
| 27/05/2014 | 124.94 | ||
| 28/05/2014 | 125.38 | ||
| 29/05/2014 | 124.38 | ||
| 30/05/2014 | 124.2 | ||
| 2/06/2014 | 123.89 | ||
| 3/06/2014 | 122.55 | ||
| 4/06/2014 | 123.02 | ||
| 5/06/2014 | 121.08 | ||
| 6/06/2014 | 122.29 | ||
| 9/06/2014 | 122.01 | ||
| 10/06/2014 | 122.12 | ||
| 11/06/2014 | 122.37 | ||
| 12/06/2014 | 122.35 | ||
| 13/06/2014 | 125.18 | ||
| 16/06/2014 | 124.96 | ||
| 17/06/2014 | 125.36 | ||
| 18/06/2014 | 126.47 | ||
| 19/06/2014 | 126.54 | ||
| 20/06/2014 | 127.21 | ||
| 23/06/2014 | 126.59 | ||
| 24/06/2014 | 126.04 | ||
| 25/06/2014 | 125.6 | ||
| 26/06/2014 | 125.87 | ||
| 27/06/2014 | 124.92 | ||
| 30/06/2014 | 124.17 | ||
| 1/07/2014 | 121.04 | ||
| 2/07/2014 | 121.08 | ||
| 3/07/2014 | 120.96 | ||
| 4/07/2014 | 121.12 | ||
| 7/07/2014 | 120.8 | ||
| 8/07/2014 | 119.35 | ||
| 9/07/2014 | 118.52 | ||
| 10/07/2014 | 117.94 | ||
| 11/07/2014 | 118.05 | ||
| 14/07/2014 | 116.77 | ||
| 15/07/2014 | 116.3 | ||
| 16/07/2014 | 116.17 | ||
| 17/07/2014 | 116.8 | ||
| 18/07/2014 | 117.52 | ||
| 21/07/2014 | 116.78 | ||
| 22/07/2014 | 117.25 | ||
| 23/07/2014 | 116.08 | ||
| 24/07/2014 | 116.56 | ||
| 25/07/2014 | 115.95 | ||
| 29/07/2014 | 117.05 | ||
| 30/07/2014 | 117.61 | ||
| 31/07/2014 | 115.87 | ||
| 1/08/2014 | 116.62 | ||
| 4/08/2014 | 115.48 | ||
| 5/08/2014 | 116.48 | ||
| 6/08/2014 | 115.54 | ||
| 7/08/2014 | 115.77 | ||
| 8/08/2014 | 117.9 | ||
| 11/08/2014 | 116.65 | ||
| 12/08/2014 | 115.21 | ||
| 13/08/2014 | 114.13 | ||
| 14/08/2014 | 115.18 | ||
| 15/08/2014 | 112.81 | ||
| 18/08/2014 | 112.42 | ||
| 19/08/2014 | 111.28 | ||
| 20/08/2014 | 111.92 | ||
| 21/08/2014 | 111.19 | ||
| 22/08/2014 | 112.18 | ||
| 25/08/2014 | 112.57 | ||
| 26/08/2014 | 112.74 | ||
| 27/08/2014 | 111.91 | ||
| 28/08/2014 | 111.77 | ||
| 29/08/2014 | 112.56 | ||
| 1/09/2014 | 113.42 | ||
| 2/09/2014 | 113.45 | ||
| 3/09/2014 | 111.88 | ||
| 4/09/2014 | 113.08 | ||
| 5/09/2014 | 112.55 | ||
| 8/09/2014 | 111.07 | ||
| 9/09/2014 | 112.33 | ||
| 10/09/2014 | 111.84 | ||
| 11/09/2014 | 110.53 | ||
| 12/09/2014 | 112.45 | ||
| 15/09/2014 | 111.03 | ||
| 16/09/2014 | 110.39 | ||
| 17/09/2014 | 113 | ||
| 18/09/2014 | 113.48 | ||
| 19/09/2014 | 112.51 | ||
| 22/09/2014 | 113.19 | ||
| 23/09/2014 | 112.7 | ||
| 24/09/2014 | 111.21 | ||
| 25/09/2014 | 112.7 | ||
| 26/09/2014 | 113.49 | ||
| 29/09/2014 | 113.48 | ||
| 30/09/2014 | 114.68 | ||
| 1/10/2014 | 112.75 | ||
| 2/10/2014 | 108.53 | ||
| 3/10/2014 | 111.07 | ||
| 7/10/2014 | 107.98 | ||
| 8/10/2014 | 107.53 | ||
| 9/10/2014 | 107.43 | ||
| 10/10/2014 | 107.12 | ||
| 13/10/2014 | 104.79 | ||
| 14/10/2014 | 104.16 | ||
| 15/10/2014 | 99.72 | ||
| 16/10/2014 | 98.52 | ||
| 17/10/2014 | 102.1 | ||
| 20/10/2014 | 100.86 | ||
| 21/10/2014 | 100.58 | ||
| 23/10/2014 | 100.05 | ||
| 24/10/2014 | 100.82 | ||
| 27/10/2014 | 100.87 | ||
| 28/10/2014 | 99.66 | ||
| 29/10/2014 | 100.19 | ||
| 30/10/2014 | 100.78 | ||
| 31/10/2014 | 99.91 | ||
| 3/11/2014 | 101.32 | ||
| 4/11/2014 | 98.57 | ||
| 5/11/2014 | 98.74 | ||
| 6/11/2014 | 100.05 | ||
| 7/11/2014 | 98.75 | ||
| 10/11/2014 | 100.57 | ||
| 11/11/2014 | 97.08 | ||
| 12/11/2014 | 95.63 | ||
| 13/11/2014 | 94.26 | ||
| 14/11/2014 | 91.19 | ||
| 17/11/2014 | 91.62 | ||
| 18/11/2014 | 93.15 | ||
| 19/11/2014 | 93.18 | ||
| 20/11/2014 | 92.79 | ||
| 21/11/2014 | 94.05 | ||
| 24/11/2014 | 95.38 | ||
| 25/11/2014 | 95.92 | ||
| 26/11/2014 | 94.2 | ||
| 27/11/2014 | 91.48 | ||
| 28/11/2014 | 86.82 | ||
| 1/12/2014 | 83.43 | ||
| 2/12/2014 | 89.06 | ||
| 3/12/2014 | 87.86 | ||
| 4/12/2014 | 87.01 | ||
| 5/12/2014 | 87.23 | ||
| 8/12/2014 | 85.51 | ||
| 9/12/2014 | 82.88 | ||
| 10/12/2014 | 82.84 | ||
| 11/12/2014 | 81.58 | ||
| 12/12/2014 | 79.4 | ||
| 15/12/2014 | 80.02 | ||
| 16/12/2014 | 75.15 | ||
| 17/12/2014 | 75.92 | ||
| 18/12/2014 | 79.74 | ||
| 19/12/2014 | 77.16 | ||
| 22/12/2014 | 79.07 | ||
| 23/12/2014 | 76.17 | ||
| 24/12/2014 | 76.99 | ||
| 26/12/2014 | 76.3 | ||
| 29/12/2014 | 74.91 | ||
| 30/12/2014 | 71.76 | ||
| 31/12/2014 | 71.79 | ||
| 2/01/2015 | 72.09 | ||
| 5/01/2015 | 70.6 | ||
| 6/01/2015 | 65.46 | ||
| 7/01/2015 | 64.3 | ||
| 8/01/2015 | 64.3 | ||
| 9/01/2015 | 63.5 | ||
| 12/01/2015 | 61.72 | ||
| 13/01/2015 | 58.43 | ||
| 14/01/2015 | 58.06 | ||
| 15/01/2015 | 59.65 | ||
| 16/01/2015 | 60.47 | ||
| 19/01/2015 | 60.6 | ||
| 20/01/2015 | 60.34 | ||
| 21/01/2015 | 59.19 | ||
| 22/01/2015 | 60.85 | ||
| 23/01/2015 | 62.43 | ||
| 26/01/2015 | 60.26 | ||
| 27/01/2015 | 59.74 | ||
| 28/01/2015 | 60.97 | ||
| 29/01/2015 | 62.5 | ||
| 30/01/2015 | 63.69 | ||
| 2/02/2015 | 68.13 | ||
| 3/02/2015 | 74.92 | ||
| 4/02/2015 | 75.71 | ||
| 5/02/2015 | 74.66 | ||
| 6/02/2015 | 76.96 | ||
| 9/02/2015 | 76.48 | ||
| 10/02/2015 | 77.09 | ||
| 11/02/2015 | 76.23 | ||
| 12/02/2015 | 75.22 | ||
| 13/02/2015 | 77.35 | ||
| 16/02/2015 | 79.98 | ||
| 17/02/2015 | 81.51 | ||
| 18/02/2015 | 82.2 | ||
| 23/02/2015 | 80.07 | ||
| 24/02/2015 | 78.08 | ||
| 25/02/2015 | 76.97 | ||
| 26/02/2015 | 82.19 | ||
| 27/02/2015 | 81.05 | ||
| 2/03/2015 | 82.59 | ||
| 3/03/2015 | 80 | ||
| 4/03/2015 | 80.22 | ||
| 5/03/2015 | 81.04 | ||
| 6/03/2015 | 81.34 | ||
| 9/03/2015 | 78.79 | ||
| 10/03/2015 | 78.15 | ||
| 11/03/2015 | 76.77 | ||
| 12/03/2015 | 77.74 | ||
| 13/03/2015 | 76.2 | ||
| 16/03/2015 | 72.18 | ||
| 17/03/2015 | 71.16 | ||
| 18/03/2015 | 69.66 | ||
| 19/03/2015 | 73.01 | ||
| 20/03/2015 | 69.79 | ||
| 23/03/2015 | 69.71 | ||
| 24/03/2015 | 71.85 | ||
| 25/03/2015 | 71.21 | ||
| 26/03/2015 | 75.71 | ||
| 27/03/2015 | 75.64 | ||
| 30/03/2015 | 73.99 | ||
| 31/03/2015 | 73.43 | ||
| 1/04/2015 | 74.56 | ||
| 2/04/2015 | 77.41 | ||
| 6/04/2015 | 75.84 | ||
| 7/04/2015 | 77.56 | ||
| 8/04/2015 | 77.58 | ||
| 9/04/2015 | 75.75 | ||
| 10/04/2015 | 75.77 | ||
| 13/04/2015 | 79.03 | ||
| 14/04/2015 | 77.29 | ||
| 15/04/2015 | 79.59 | ||
| 16/04/2015 | 81.79 | ||
| 17/04/2015 | 82.47 | ||
| 20/04/2015 | 82.89 | ||
| 21/04/2015 | 81.52 | ||
| 22/04/2015 | 79.87 | ||
| 23/04/2015 | 81.09 | ||
| 24/04/2015 | 84.66 | ||
| 27/04/2015 | 83.01 | ||
| 28/04/2015 | 81.29 | ||
| 29/04/2015 | 80.55 | ||
| 30/04/2015 | 84.29 | ||
| 4/05/2015 | 87.1 | ||
| 5/05/2015 | 85.7 | ||
| 6/05/2015 | 88.19 | ||
| 7/05/2015 | 87.6 | ||
| 8/05/2015 | 84.09 | ||
| 11/05/2015 | 84.41 | ||
| 12/05/2015 | 84.58 | ||
| 13/05/2015 | 84.89 | ||
| 14/05/2015 | 85.3 | ||
| 15/05/2015 | 84.58 | ||
| 18/05/2015 | 86.08 | ||
| 19/05/2015 | 84.33 | ||
| 20/05/2015 | 83.66 | ||
| 21/05/2015 | 85.28 | ||
| 22/05/2015 | 86.61 | ||
| 25/05/2015 | 85.45 | ||
| 26/05/2015 | 85.4 | ||
| 27/05/2015 | 85.19 | ||
| 28/05/2015 | 83.02 | ||
| 29/05/2015 | 83.93 | ||
| 2/06/2015 | 86.05 | ||
| 3/06/2015 | 84.61 | ||
| 4/06/2015 | 84.76 | ||
| 5/06/2015 | 83.25 | ||
| 8/06/2015 | 84.4 | ||
| 9/06/2015 | 84.95 | ||
| 10/06/2015 | 87.28 | ||
| 11/06/2015 | 86.45 | ||
| 12/06/2015 | 84.93 | ||
| 15/06/2015 | 83.63 | ||
| 16/06/2015 | 83.42 | ||
| 17/06/2015 | 84.88 | ||
| 18/06/2015 | 84.24 | ||
| 19/06/2015 | 82.73 | ||
| 22/06/2015 | 82.9 | ||
| 23/06/2015 | 82.78 | ||
| 24/06/2015 | 85.5 | ||
| 25/06/2015 | 83.94 | ||
| 26/06/2015 | 83.41 | ||
| 29/06/2015 | 81.65 | ||
| 30/06/2015 | 82.15 | ||
| 1/07/2015 | 84.51 | ||
| 2/07/2015 | 83.77 | ||
| 3/07/2015 | 84.26 | ||
| 6/07/2015 | 80.62 | ||
| 7/07/2015 | 79.46 | ||
| 8/07/2015 | 79.14 | ||
| 9/07/2015 | 79.08 | ||
| 10/07/2015 | 79.3 | ||
| 13/07/2015 | 79.34 | ||
| 14/07/2015 | 78.58 | ||
| 15/07/2015 | 81.25 | ||
| 16/07/2015 | 80.73 | ||
| 20/07/2015 | 79.68 | ||
| 21/07/2015 | 78.48 | ||
| 22/07/2015 | 79.54 | ||
| 23/07/2015 | 78.69 | ||
| 24/07/2015 | 78.14 | ||
| 27/07/2015 | 76.82 | ||
| 28/07/2015 | 74.98 | ||
| 29/07/2015 | 75.18 | ||
| 30/07/2015 | 76.27 | ||
| 31/07/2015 | 73.91 | ||
| 3/08/2015 | 72.63 | ||
| 4/08/2015 | 69.92 | ||
| 5/08/2015 | 70.51 | ||
| 6/08/2015 | 70.16 | ||
| 11/08/2015 | 71.29 | ||
| 12/08/2015 | 69.93 | ||
| 13/08/2015 | 70.7 | ||
| 14/08/2015 | 68.41 | ||
| 17/08/2015 | 68.28 | ||
| 18/08/2015 | 68.12 | ||
| 19/08/2015 | 67.77 | ||
| 20/08/2015 | 64.99 | ||
| 21/08/2015 | 65.18 | ||
| 24/08/2015 | 61.18 | ||
| 25/08/2015 | 62.22 | ||
| 26/08/2015 | 61.79 | ||
| 27/08/2015 | 63.25 | ||
| 28/08/2015 | 67.2 | ||
| 31/08/2015 | 69.48 | ||
| 1/09/2015 | 75.31 | ||
| 2/09/2015 | 70.39 | ||
| 3/09/2015 | 74.12 | ||
| 4/09/2015 | 73.92 | ||
| 7/09/2015 | 71.74 | ||
| 8/09/2015 | 71.11 | ||
| 9/09/2015 | 71.13 | ||
| 10/09/2015 | 68.85 | ||
| 14/09/2015 | 67.48 | ||
| 15/09/2015 | 66.32 | ||
| 16/09/2015 | 66.62 | ||
| 17/09/2015 | 68.11 | ||
| 18/09/2015 | 68.38 | ||
| 21/09/2015 | 67.2 | ||
| 22/09/2015 | 67.16 | ||
| 23/09/2015 | 70.17 | ||
| 25/09/2015 | 68.62 | ||
| 28/09/2015 | 68.38 | ||
| 29/09/2015 | 68.25 | ||
| 30/09/2015 | 68.68 | ||
| 1/10/2015 | 70.15 | ||
| 2/10/2015 | 68.04 | ||
| 5/10/2015 | 69.03 | ||
| 6/10/2015 | 69.19 | ||
| 7/10/2015 | 73.73 | ||
| 8/10/2015 | 71.96 | ||
| 9/10/2015 | 73.26 | ||
| 12/10/2015 | 71.92 | ||
| 13/10/2015 | 68.54 | ||
| 14/10/2015 | 66.99 | ||
| 15/10/2015 | 66.66 | ||
| 16/10/2015 | 68.29 | ||
| 19/10/2015 | 67.94 | ||
| 20/10/2015 | 65.5 | ||
| 21/10/2015 | 65.57 | ||
| 22/10/2015 | 65.34 | ||
| 23/10/2015 | 65.16 | ||
| 26/10/2015 | 64.95 | ||
| 27/10/2015 | 64.31 | ||
| 28/10/2015 | 64.47 | ||
| 29/10/2015 | 67.09 | ||
| 30/10/2015 | 67.15 | ||
| 2/11/2015 | 67.8 | ||
| 3/11/2015 | 66.62 | ||
| 4/11/2015 | 69.09 | ||
| 5/11/2015 | 67.26 | ||
| 6/11/2015 | 67.58 | ||
| 9/11/2015 | 66.83 | ||
| 11/11/2015 | 65.95 | ||
| 12/11/2015 | 63.43 | ||
| 13/11/2015 | 61.39 | ||
| 16/11/2015 | 60.66 | ||
| 17/11/2015 | 60.35 | ||
| 18/11/2015 | 59.92 | ||
| 19/11/2015 | 58.99 | ||
| 20/11/2015 | 58.86 | ||
| 23/11/2015 | 58.58 | ||
| 24/11/2015 | 60.97 | ||
| 25/11/2015 | 61.17 | ||
| 26/11/2015 | 61.5 | ||
| 27/11/2015 | 60.72 | ||
| 30/11/2015 | 59.96 | ||
| 1/12/2015 | 61.17 | ||
| 2/12/2015 | 60.2 | ||
| 3/12/2015 | 58.7 | ||
| 4/12/2015 | 59.58 | ||
| 7/12/2015 | 58.67 | ||
| 8/12/2015 | 57.15 | ||
| 9/12/2015 | 56.33 | ||
| 10/12/2015 | 55.59 | ||
| 11/12/2015 | 55.35 | ||
| 14/12/2015 | 52.14 | ||
| 15/12/2015 | 52.59 | ||
| 16/12/2015 | 51.48 | ||
| 17/12/2015 | 50.7 | ||
| 18/12/2015 | 50.92 | ||
| 21/12/2015 | 49.87 | ||
| 22/12/2015 | 49.25 | ||
| 23/12/2015 | 49.3 | ||
| 24/12/2015 | 50.58 | ||
| 28/12/2015 | 50.39 | ||
| 29/12/2015 | 50 | ||
| 30/12/2015 | 49.57 | ||
| 31/12/2015 | 48.88 | ||
| 4/01/2016 | 52.74 | ||
| 5/01/2016 | 52.86 | ||
| 6/01/2016 | 50.81 | ||
| 7/01/2016 | 47.49 | ||
| 8/01/2016 | 49.26 | ||
| 11/01/2016 | 47.22 | ||
| 12/01/2016 | 46.48 | ||
| 13/01/2016 | 44.91 | ||
| 14/01/2016 | 43.78 | ||
| 15/01/2016 | 42.97 | ||
| 18/01/2016 | 42.08 | ||
| 19/01/2016 | 42.51 | ||
| 20/01/2016 | 41 | ||
| 21/01/2016 | 39.65 | ||
| 22/01/2016 | 44.76 | ||
| 25/01/2016 | 45.43 | ||
| 26/01/2016 | 42.54 | ||
| 27/01/2016 | 44.66 | ||
| 28/01/2016 | 47.63 | ||
| 29/01/2016 | 48.32 | ||
| 1/02/2016 | 52.63 | ||
| 2/02/2016 | 49.68 | ||
| 3/02/2016 | 48.38 | ||
| 4/02/2016 | 51.49 | ||
| 5/02/2016 | 51.1 | ||
| 10/02/2016 | 46.15 | ||
| 11/02/2016 | 45.76 | ||
| 12/02/2016 | 47.4 | ||
| 15/02/2016 | 47.8 | ||
| 16/02/2016 | 49.87 | ||
| 17/02/2016 | 47.52 | ||
| 18/02/2016 | 50.82 | ||
| 19/02/2016 | 49.97 | ||
| 22/02/2016 | 48.47 | ||
| 23/02/2016 | 49.36 | ||
| 24/02/2016 | 47.56 | ||
| 25/02/2016 | 49.25 | ||
| 26/02/2016 | 51.89 | ||
| 29/02/2016 | 51.33 | ||
| 1/03/2016 | 53.97 | ||
| 2/03/2016 | 52.71 | ||
| 3/03/2016 | 52.24 | ||
| 4/03/2016 | 52.05 | ||
| 7/03/2016 | 54.7 | ||
| 8/03/2016 | 56.41 | ||
| 9/03/2016 | 55.54 | ||
| 10/03/2016 | 56.3 | ||
| 14/03/2016 | 54.64 | ||
| 15/03/2016 | 53.97 | ||
| 16/03/2016 | 54.48 | ||
| 17/03/2016 | 55.75 | ||
| 18/03/2016 | 55.66 | ||
| 21/03/2016 | 55.41 | ||
| 22/03/2016 | 56.3 | ||
| 23/03/2016 | 56.83 | ||
| 24/03/2016 | 54.78 | ||
| 28/03/2016 | 55.71 | ||
| 29/03/2016 | 53.46 | ||
| 30/03/2016 | 53.48 | ||
| 31/03/2016 | 53.08 | ||
| 1/04/2016 | 53.06 | ||
| 4/04/2016 | 52.07 | ||
| 5/04/2016 | 51.16 | ||
| 6/04/2016 | 52.19 | ||
| 7/04/2016 | 54.34 | ||
| 8/04/2016 | 54.84 | ||
| 11/04/2016 | 56.18 | ||
| 12/04/2016 | 57.81 | ||
| 13/04/2016 | 58.86 | ||
| 14/04/2016 | 58.07 | ||
| 15/04/2016 | 57.17 | ||
| 18/04/2016 | 54.87 | ||
| 19/04/2016 | 56.54 | ||
| 20/04/2016 | 56.41 | ||
Medium‑term projections
The fiscal aggregates in the Budget are underpinned by economic forecasts for the budget year and the subsequent financial year and then by economic projections for the following two financial years. These projections are not forecasts. Rather they are based on a medium‑term methodology and some key assumptions.
Crucially, the medium‑term projection methodology assumes that spare capacity in the economy is absorbed over five years following the forecast period. The sensitivity of the projections to a different adjustment period is analysed in Statement 7.
As the spare capacity is absorbed, labour market variables, including employment and the participation rate, converge to their long‑run trend levels. To absorb the spare capacity in the economy, from 2018‑19 real GDP is projected to grow faster than potential at 3 per cent. By the end of 2022‑23 spare capacity is absorbed and real GDP grows at its potential rate thereafter.
Potential GDP is estimated based on an analysis of underlying trends for population, productivity and participation. Australia's potential GDP growth rate is estimated to be 2¾ per cent over the next few years. The unemployment rate is projected to converge back to 5 per cent over the medium term consistent with Treasury's estimate of the non‑accelerating inflation rate of unemployment (NAIRU). Inflation is projected to be 2½ per cent, consistent with the Reserve Bank of Australia's medium‑term target band. The terms of trade is projected to remain flat at around its 2005 level from 2019‑20.
In the 2015‑16 MYEFO, the medium‑term projections were updated in response to new data on population and participation. An update in response to changes in the data to account for developments in commodity markets has now been completed resulting in changes to the terms of trade outlook in the medium term (see Box 6).
Box 6: Long‑run terms of trade
In the 2013‑14 MYEFO a new framework was adopted for projecting the terms of trade over the medium term. The framework has been updated to incorporate data from the past two years and more specifically to account for the significant developments in commodity markets such as updated cost curves. Further information on the methodology underpinning the framework can be found in the 2013‑14 MYEFO and the published Treasury Working Paper Long‑run forecasts of Australia's terms of trade.
The update now suggests a slightly lower terms of trade outlook over the medium term compared with at the 2013‑14 MYEFO, primarily reflecting a fall in the export price outlook for bulk commodities (iron ore, metallurgical coal and thermal coal).
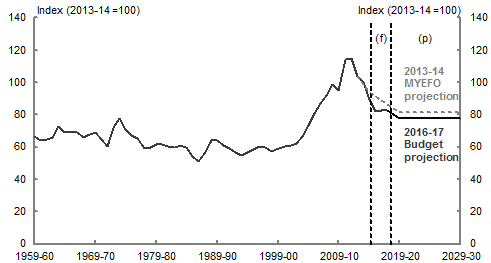
Source: ABS cat. no. 5206.0 and Treasury.
| Terms of trade history | 2016-16 Budget projection | 2013-14 MYEFO projection | |
|---|---|---|---|
| 1959-60 | 66.80 | ||
| 1960-61 | 63.90 | ||
| 1961-62 | 64.60 | ||
| 1962-63 | 66.00 | ||
| 1963-64 | 72.70 | ||
| 1964-65 | 69.30 | ||
| 1965-66 | 69.30 | ||
| 1966-67 | 68.90 | ||
| 1967-68 | 66.10 | ||
| 1968-69 | 67.80 | ||
| 1969-70 | 69.10 | ||
| 1970-71 | 64.70 | ||
| 1971-72 | 60.60 | ||
| 1972-73 | 72.20 | ||
| 1973-74 | 77.60 | ||
| 1974-75 | 70.60 | ||
| 1975-76 | 67.40 | ||
| 1976-77 | 65.20 | ||
| 1977-78 | 59.30 | ||
| 1978-79 | 59.70 | ||
| 1979-80 | 61.90 | ||
| 1980-81 | 61.40 | ||
| 1981-82 | 60.40 | ||
| 1982-83 | 59.50 | ||
| 1983-84 | 61.00 | ||
| 1984-85 | 60.00 | ||
| 1985-86 | 54.30 | ||
| 1986-87 | 51.40 | ||
| 1987-88 | 55.80 | ||
| 1988-89 | 64.10 | ||
| 1989-90 | 64.30 | ||
| 1990-91 | 60.90 | ||
| 1991-92 | 59.00 | ||
| 1992-93 | 56.60 | ||
| 1993-94 | 55.00 | ||
| 1994-95 | 56.80 | ||
| 1995-96 | 58.60 | ||
| 1996-97 | 60.40 | ||
| 1997-98 | 60.00 | ||
| 1998-99 | 57.10 | ||
| 1999-00 | 59.40 | ||
| 2000-01 | 60.40 | ||
| 2001-02 | 61.30 | ||
| 2002-03 | 62.20 | ||
| 2003-04 | 66.80 | ||
| 2004-05 | 73.20 | ||
| 2005-06 | 81.10 | ||
| 2006-07 | 87.00 | ||
| 2007-08 | 91.80 | ||
| 2008-09 | 98.80 | ||
| 2009-10 | 94.90 | ||
| 2010-11 | 114.40 | ||
| 2011-12 | 114.90 | ||
| 2012-13 | 103.80 | 103.80 | |
| 2013-14 | 100.00 | 98.70 | |
| 2014-15 | 89.70 | 89.70 | 93.90 |
| 2015-16 | 81.80 | 91.30 | |
| 2016-17 | 82.90 | 88.80 | |
| 2017-18 | 82.90 | 86.30 | |
| 2018-19 | 80.30 | 84.00 | |
| 2019-20 | 77.70 | 81.70 | |
| 2020-21 | 77.70 | 81.70 | |
| 2021-22 | 77.70 | 81.70 | |
| 2022-23 | 77.70 | 81.70 | |
| 2023-24 | 77.70 | 81.70 | |
| 2024-25 | 77.70 | 81.70 | |
| 2025-26 | 77.70 | 81.70 | |
| 2026-27 | 77.70 | 81.70 | |
| 2027-28 | 77.70 | 81.70 | |
| 2028-29 | 77.70 | 81.70 | |
| 2029-30 | 77.70 | 81.70 |
Australia's terms of trade is affected significantly by the evolving supply and demand dynamics for commodities exports, especially the bulk commodities. Over the past two years mining companies, including those from Australia, have significantly improved productivity by cutting production costs leading to lower marginal costs of extraction.
Lower production costs for miners combined with a softer demand outlook, particularly from China, has led to a lower export price outlook for the bulk commodities in the medium term.
While lower commodity prices have put downward pressure on the terms of trade, this has been partly offset by a fall in the outlook for import prices. A softer demand outlook has also translated into lower prices for Australia's imports.
1 Resources and Energy Quarterly March 2016, http://www.industry.gov.au/Office-of-the-Chief-Economist/Publications/Documents/req/REQ-March-2016.pdf