
Statement 4: Revenue
(continued)
Variations in receipts estimates
Table 3 reconciles the 2016‑17 Budget estimates of total receipts, which include non‑tax receipts, with the 2015‑16 Budget and the 2015‑16 MYEFO estimates. These differences reflect the impact of parameter and other variations and the impact of policy decisions.
| Estimates | Projections | ||||||
|---|---|---|---|---|---|---|---|
| 2015‑16 | 2016‑17 | 2017‑18 | 2018-19 | Total | |||
| $m | $m | $m | $m | $m | |||
| Receipts at 2015‑16 Budget | 397,980 | 422,461 | 453,595 | 488,233 | 1,762,269 | ||
| Changes from 2015‑16 Budget to 2015‑16 MYEFO | |||||||
| Effect of policy decisions | -1,345 | -917 | -907 | -668 | -3,837 | ||
| Effect of parameter and other variations | -1,744 | -6,216 | -11,805 | -14,034 | -33,800 | ||
| Total variations | -3,089 | -7,134 | -12,712 | -14,702 | -37,637 | ||
| Receipts at 2015‑16 MYEFO | 394,891 | 415,327 | 440,883 | 473,531 | 1,724,632 | ||
| Changes from 2015‑16 MYEFO to 2016‑17 Budget | |||||||
| Effect of policy decisions | 417 | -1,670 | 225 | -209 | -1,238 | ||
| Effect of parameter and other variations | -7,280 | -2,373 | -3,723 | -3,401 | -16,777 | ||
| Total variations | -6,863 | -4,043 | -3,497 | -3,611 | -18,015 | ||
| Receipts at 2016‑17 Budget | 388,027 | 411,284 | 437,385 | 469,921 | 1,706,617 | ||
(a) Includes expected Future Fund earnings.
Since the 2015‑16 MYEFO, total receipts have been revised down by around $18.0 billion in the four years to 2018‑19, reflecting a downward revision of $16.8 billion from parameter and other variations, and a decrease of $1.2 billion from policy decisions. Excluding GST, total receipts have been revised down $4.0 billion in 2016‑17 and $19.1 billion over the four years to 2018‑19.
Chart 1 shows the revisions to estimates for total receipts since the 2015‑16 MYEFO over the four years to 2018‑19. The revisions are broken down by revisions owing to policy decisions and revisions owing to parameter and other variations.
![This chart shows that since the 2015-16 MYEFO, total receipts have been revised down by around [$4 billion] in 2016-17 and by around [$18 billion] over the four years to 2018-19. The chart decomposes the revisions into variations that stem from policy decisions and variations that stem from parameter and other variations and shows that the majority of the variations in each of the four years to 2018-19 are a result of parameter and other variations.](../image/bp1_bs4-1.gif)
Source: Treasury.
| X Values | Policy decisions | Parameter and other variations |
Total variations |
|---|---|---|---|
| 2015-16 | 0.4 | -7.3 | -6.9 |
| 2016-17 | -1.7 | -2.4 | -4.0 |
| 2017-18 | 0.2 | -3.7 | -3.5 |
| 2018-19 | -0.2 | -3.4 | -3.6 |
Variations in receipts can stem from either policy changes or parameter and other variations such as recent economic conditions, the updated economic outlook, year‑to‑date tax collections and other non‑policy factors. Key economic parameters that influence receipts are shown in Table 4. Analysis of the sensitivity of the tax receipts estimates to changes in the economic outlook is provided in Budget Statement 7.
| Estimates | Projections | |||||
|---|---|---|---|---|---|---|
| 2015‑16 | 2016‑17 | 2017‑18 | 2018-19 | 2019-20 | ||
| Revenue parameters at 2016‑17 Budget | ||||||
| Nominal gross domestic product | 2 1/2 | 4 1/4 | 5 | 5 | 5 | |
| Change since 2015‑16 MYEFO | - 1/4 | - 1/4 | 0 | - 1/4 | na | |
| Compensation of employees(b) | 3 | 4 | 4 1/2 | 4 1/2 | 5 | |
| Change since 2015‑16 MYEFO | - 3/4 | 0 | 1/4 | 0 | na | |
| Corporate gross operating surplus(c) | 1 1/4 | 5 1/4 | 5 3/4 | 5 1/4 | 4 3/4 | |
| Change since 2015‑16 MYEFO | 1 1/4 | 0 | -1 | -1 | na | |
| Unincorporated business income | 4 1/2 | 4 | 5 1/2 | 5 1/2 | 4 3/4 | |
| Change since 2015‑16 MYEFO | 1/2 | -1 1/4 | -1 1/4 | -1 1/4 | na | |
| Property income(d) | 1 3/4 | 5 | 6 1/4 | 5 | 5 1/4 | |
| Change since 2015‑16 MYEFO | 1 3/4 | -1 1/4 | 1 3/4 | 1/4 | na | |
| Consumption subject to GST | 4 | 4 3/4 | 5 1/4 | 5 1/2 | 5 1/4 | |
| Change since 2015‑16 MYEFO | - 1/4 | - 3/4 | 1/2 | 1/2 | na | |
(a) Current prices, per cent change on previous years. Changes since the 2015‑16 MYEFO are percentage points and may not reconcile due to rounding.
(b) Compensation of employees measures total remuneration earned by employees.
(c) Corporate GOS is an Australian System of National Accounts measure of company profits, gross of depreciation.
(d) Property income measures income derived from rent, dividends and interest.
na not applicable.
Since the 2015‑16 MYEFO, parameter and other variations have reduced forecast tax receipts by $3.7 billion in 2015‑16, $4.6 billion in 2016‑17 and $13.5 billion over the four years to 2018‑19 (Chart 2). Excluding GST, parameter and other variations have reduced forecast tax receipts by $3.9 billion in 2015‑16, by around $4.6 billion in 2016‑17 and by around $14.2 billion over the four years to 2018‑19.
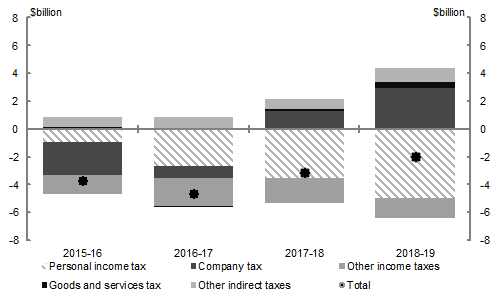
Source: Treasury.
| X Values | Personal income tax | Company tax | Other income taxes | Goods and services tax | Other indirect taxes | Total |
|---|---|---|---|---|---|---|
| 2015-16 | -0.9 | -2.4 | -1.3 | 0.2 | 0.7 | -3.7 |
| 2016-17 | -2.7 | -0.9 | -2.0 | 0.0 | 0.9 | -4.6 |
| 2017-18 | -3.5 | 1.3 | -1.8 | 0.1 | 0.8 | -3.1 |
| 2018-19 | -4.9 | 3.0 | -1.4 | 0.4 | 1.0 | -2.0 |
In aggregate, tax receipts are expected to grow by 3.1 per cent in 2015‑16 and 5.0 per cent in 2016‑17. The primary contributors to growth are income taxes on individuals and companies, and indirect taxes, reflecting growth in wages, profits and consumption respectively. At a disaggregated level, different heads of revenue are expected to grow at different rates, with some expected to experience negative growth.
Individuals and other withholding taxation receipts
Gross income tax withholding (ITW) receipts are forecast to grow by 4.7 per cent in 2015‑16 and 4.4 per cent in 2016‑17. Since the 2015‑16 MYEFO, ITW receipts are expected to be around $1.0 billion lower in 2015‑16 and $7.9 billion lower over the four years to 2018‑19. This fall in expected tax is primarily driven by revisions to total wages forecasts and targeted personal income tax cuts.
Gross other individuals taxes refers to taxes payable by individuals other than those collected through withholding systems, including PAYG instalments paid directly by individuals and assessments after tax returns are lodged. These amounts primarily reflect tax on income such as unincorporated business profits, capital gains and interest.
Gross other individuals taxes are expected to grow by 9.0 per cent in 2015‑16 and 5.7 per cent in 2016‑17. Since the 2015‑16 MYEFO, receipts are expected to be around $400 million higher in 2015‑16 and $3.2 billion lower over the four years to 2018‑19, reflecting lower expected growth in unincorporated business income over the forward estimates. In addition, the Budget includes new policy to increase the tax discount for unincorporated small businesses, which lowers estimated tax receipts. These reductions in receipts have been partly offset by higher expected realisation of capital gains, based on the latest tax return data.
Income tax refunds for individuals, which have a negative effect on receipts, are expected to grow by 2.8 per cent in 2015‑16 and 5.6 per cent in 2016‑17. Relative to the 2015‑16 MYEFO, forecast refunds are $300 million higher (a decrease in overall tax receipts) in 2015‑16 and $3.0 billion higher over the four years to 2018‑19.
Fringe benefits tax
Receipts from fringe benefits tax (FBT) are forecast to grow by 3.5 per cent in 2015‑16 and 3.8 per cent in 2016‑17. Since the 2015‑16 MYEFO, receipts are expected to be around $30 million lower in 2015‑16 and $130 million lower over the four years to 2018‑19, consistent with lower expected total wages.
Company tax
Company tax receipts are forecast to fall by 2.2 per cent in 2015‑16, owing to weaker current year collections, and grow by 6.6 per cent in 2016‑17, consistent with increasing corporate profits. Since the 2015‑16 MYEFO, receipts are expected to be around $2.4 billion lower in 2015‑16 and $2.1 billion lower over the four years to 2018‑19. This fall in expected tax is primarily due to weaker‑than‑expected collections in the current year and lowering of the company tax rate for eligible businesses from 2016‑17.
Excluding new policy decisions, company tax has been revised down by $2.4 billion in 2015‑16 and up by $1.0 billion over the four years to 2018‑19. Collections for 2015‑16 are weaker than expected at MYEFO, primarily owing to lower receipts from the mining sector. This has flow‑on impacts to company tax in 2016‑17. Higher‑than‑expected mining profits are not expected to be reflected in increased company tax collections until 2017‑18 and 2018‑19.
Significant new policies affecting company tax include a reduction in the company tax rate, commencing with a reduction for small businesses, and increasing the small business entity turnover threshold. A more competitive company tax rate will encourage investment, raise productivity, and over time raise real wages and living standards.
In addition, the tax integrity package encompasses measures to reinforce the corporate tax base by preventing multinational corporations from avoiding tax by profit shifting and fighting tax avoidance.
Superannuation fund taxes
Tax receipts from superannuation funds are expected to grow by 12.9 per cent in 2015‑16 and 11.3 per cent in 2016‑17. Since the 2015‑16 MYEFO, receipts are expected to be around $1.1 billion lower in 2015‑16 and $4.2 billion lower over the four years to 2018‑19. Lower receipts are due to higher expected foreign exchange losses, lower expected net contributions owing to weaker wages and lower forecast capital gains tax. These parameter changes more than offset additional expected receipts from superannuation policies announced in this Budget, which better target concessions. These policy changes also have impacts on individuals income taxes.
The Budget includes the introduction of a Low Income Superannuation Tax Offset (LISTO). The LISTO reduces tax on superannuation contributions for low income earners, effectively avoiding the situation in which low income earners would pay more tax on savings placed into superannuation than on income earned outside of superannuation.
Petroleum resource rent tax
Petroleum resource rent tax (PRRT) receipts are forecast to fall by over 50 per cent in 2015‑16 and remain at a similar level in 2016‑17. Since the 2015‑16 MYEFO, receipts are expected to be around $200 million lower in 2015‑16 and $850 million lower over the four years to 2018‑19, consistent with lower Australian dollar oil prices.
Goods and services tax
Receipts from GST are forecast to grow by 6.0 per cent in 2015‑16 and 5.4 per cent in 2016‑17. Since the 2015‑16 MYEFO, receipts are expected to be around $190 million higher in 2015‑16 and $1.1 billion higher over the four years to 2018‑19. The 2015‑16 estimate has been revised upward largely owing to stronger‑than‑expected collections. GST receipts are also expected to be higher as a result of the decision to apply GST to low‑value goods imported by consumers, so that they will face the same tax regime as goods that are sourced domestically.
Excise and customs duty
Excise and customs duty receipts are forecast to grow by 0.6 per cent in 2015‑16 and by 2.8 per cent in 2016‑17. These low growth rates are primarily attributable to tariff cuts as part of free trade agreements and weak growth in excise on other fuel products.
Since the 2015‑16 MYEFO, receipts are expected to be around $550 million higher in 2015‑16 and $4.8 billion higher over the four years to 2018‑19, reflecting higher current year tax collections and the 2016‑17 Budget measure to increase the tobacco excise rate, which is aimed at improving health outcomes. The 2016‑17 Budget includes the measure for the Trans‑Pacific Partnership Agreement.
Other sales taxes
Other sales taxes include the wine equalisation tax (WET) and the luxury car tax (LCT).
WET receipts are forecast to grow by 8.6 per cent in 2015‑16 and 4.7 per cent in 2016‑17. Since the 2015‑16 MYEFO, forecast WET receipts have been revised up by $280 million over the four years to 2018‑19 as a result of higher current year collections and the wine equalisation tax rebate integrity measure.
LCT receipts are forecast to grow by 11.5 per cent in 2015‑16 in line with stronger‑than‑expected sales of vehicles subject to LCT. Since the 2015‑16 MYEFO, forecast LCT receipts have been revised up by $240 million over the four years to 2018‑19.
Non‑taxation receipts
Since the 2015‑16 MYEFO, non‑taxation receipts have been revised down by $3.1 billion in 2015‑16, primarily due to the agreement with the Victorian Government to reinvest the $1.5 billion provided for the East West Link project to fund other mutually agreed projects, and a delay in the expected receipt of proceeds from the reissue of spectrum licences previously expected in 2015‑16. Non‑taxation receipts have been revised up by $2.3 billion in 2016‑17, largely reflecting higher expected dividend receipts from the Reserve Bank of Australia and the delayed spectrum licence receipts.
Non‑taxation receipts (including Future Fund earnings) are expected to fall by 5.2 per cent in 2015‑16, largely reflecting lower expected receipts from the sale of spectrum licences. Non‑taxation receipts are expected to grow by 21.2 per cent in 2016‑17, primarily due to increased expected receipts from the sale of spectrum licences and increased State and Territory Government contributions to the National Disability Insurance Scheme (NDIS) in line with the expected increase in participants as the NDIS transitions to full Scheme.
The changes in the individual heads of revenue relative to the 2015‑16 MYEFO are shown in Table 5 and Table 6 for 2015‑16 and 2016‑17 respectively.
Table 7 shows the Australian Government general government cash receipts from 2014‑15 to 2019‑20 by head of revenue.
| Estimates | Change on MYEFO | ||||
|---|---|---|---|---|---|
| MYEFO | Budget | ||||
| $m | $m | $m | % | ||
| Individuals and other withholding taxes | |||||
| Gross income tax withholding | 175,200 | 174,200 | -1,000 | -0.6 | |
| Gross other individuals | 41,600 | 42,000 | 400 | 1.0 | |
| less: Refunds | 27,500 | 27,800 | 300 | 1.1 | |
| Total individuals and other withholding tax | 189,300 | 188,400 | -900 | -0.5 | |
| Fringe benefits tax | 4,530 | 4,500 | -30 | -0.7 | |
| Company tax | 67,100 | 64,700 | -2,400 | -3.6 | |
| Superannuation fund taxes | 7,730 | 6,630 | -1,100 | -14.2 | |
| Petroleum resource rent tax | 1,000 | 800 | -200 | -20.0 | |
| Income taxation receipts | 269,660 | 265,030 | -4,630 | -1.7 | |
| Goods and services tax | 57,614 | 57,808 | 194 | 0.3 | |
| Wine equalisation tax | 840 | 860 | 20 | 2.4 | |
| Luxury car tax | 520 | 580 | 60 | 11.5 | |
| Excise and customs duty | |||||
| Petrol | 6,200 | 6,200 | 0 | 0.0 | |
| Diesel | 9,320 | 9,460 | 140 | 1.5 | |
| Other fuel products | 2,420 | 2,240 | -180 | -7.4 | |
| Tobacco | 9,150 | 9,410 | 260 | 2.8 | |
| Beer | 2,330 | 2,360 | 30 | 1.3 | |
| Spirits | 1,970 | 2,040 | 70 | 3.6 | |
| Other alcoholic beverages(a) | 910 | 910 | 0 | 0.0 | |
| Other customs duty | |||||
| Textiles, clothing and footwear | 440 | 470 | 30 | 6.8 | |
| Passenger motor vehicles | 550 | 570 | 20 | 3.6 | |
| Other imports | 1,370 | 1,550 | 180 | 13.1 | |
| less: Refunds and drawbacks | 420 | 420 | 0 | 0.0 | |
| Total excise and customs duty | 34,240 | 34,790 | 550 | 1.6 | |
| Agricultural levies | 475 | 514 | 39 | 8.2 | |
| Other taxes(b) | 4,881 | 4,925 | 44 | 0.9 | |
| Indirect taxation receipts | 98,570 | 99,477 | 907 | 0.9 | |
| Taxation receipts | 368,230 | 364,507 | -3,723 | -1.0 | |
| Sales of goods and services(b) | 7,870 | 7,686 | -184 | -2.3 | |
| Interest received | 3,874 | 2,842 | -1,032 | -26.6 | |
| Dividends | 4,516 | 5,332 | 816 | 18.1 | |
| Other non-taxation receipts | 10,401 | 7,660 | -2,741 | -26.4 | |
| Non-taxation receipts | 26,661 | 23,520 | -3,141 | -11.8 | |
| Total receipts | 394,891 | 388,027 | -6,863 | -1.7 | |
| Memorandum: | |||||
| Total excise | 21,330 | 21,360 | 30 | 0.1 | |
| Total customs duty | 12,910 | 13,430 | 520 | 4.0 | |
| Capital gains tax(c) | 10,600 | 10,600 | 0 | 0.0 | |
| Medicare and DisabilityCare Australia levy | 15,014 | 14,970 | -44 | -0.3 | |
(a) Other alcoholic beverages are those not exceeding 10 per cent by volume of alcohol (excluding beer, brandy and wine).
(b) Visa application charges were reclassified in the 2015‑16 MYEFO from non‑taxation receipts to taxation receipts to reflect a sustained change in the nature of receipts. The back‑casting relating to the reclassification is reflected in Statement 10 — Historical Series from 2003‑04.
(c) Capital gains tax is part of gross other individuals, company tax and superannuation funds taxes.
| Estimates | Change on MYEFO | ||||
|---|---|---|---|---|---|
| MYEFO | Budget | ||||
| $m | $m | $m | % | ||
| Individuals and other withholding taxes | |||||
| Gross income tax withholding | 184,500 | 181,900 | -2,600 | -1.4 | |
| Gross other individuals | 44,900 | 44,400 | -500 | -1.1 | |
| less: Refunds | 28,900 | 29,350 | 450 | 1.6 | |
| Total individuals and other withholding tax | 200,500 | 196,950 | -3,550 | -1.8 | |
| Fringe benefits tax | 4,700 | 4,670 | -30 | -0.6 | |
| Company tax | 70,700 | 69,000 | -1,700 | -2.4 | |
| Superannuation fund taxes | 9,080 | 7,380 | -1,700 | -18.7 | |
| Petroleum resource rent tax | 1,050 | 800 | -250 | -23.8 | |
| Income taxation receipts | 286,030 | 278,800 | -7,230 | -2.5 | |
| Goods and services tax | 60,991 | 60,928 | -64 | -0.1 | |
| Wine equalisation tax | 860 | 900 | 40 | 4.7 | |
| Luxury car tax | 510 | 570 | 60 | 11.8 | |
| Excise and customs duty | |||||
| Petrol | 6,400 | 6,450 | 50 | 0.8 | |
| Diesel | 9,630 | 9,860 | 230 | 2.4 | |
| Other fuel products | 2,430 | 2,230 | -200 | -8.2 | |
| Tobacco | 9,700 | 10,160 | 460 | 4.7 | |
| Beer | 2,330 | 2,390 | 60 | 2.6 | |
| Spirits | 2,010 | 2,100 | 90 | 4.5 | |
| Other alcoholic beverages(a) | 920 | 940 | 20 | 2.2 | |
| Other customs duty | |||||
| Textiles, clothing and footwear | 300 | 310 | 10 | 3.3 | |
| Passenger motor vehicles | 590 | 590 | 0 | 0.0 | |
| Other imports | 1,140 | 1,170 | 30 | 2.6 | |
| less: Refunds and drawbacks | 420 | 420 | 0 | 0.0 | |
| Total excise and customs duty | 35,030 | 35,780 | 750 | 2.1 | |
| Agricultural levies | 485 | 494 | 9 | 1.9 | |
| Other taxes(b) | 5,219 | 5,298 | 79 | 1.5 | |
| Indirect taxation receipts | 103,095 | 103,969 | 874 | 0.8 | |
| Taxation receipts | 389,125 | 382,769 | -6,356 | -1.6 | |
| Sales of goods and services(b) | 9,580 | 9,176 | -404 | -4.2 | |
| Interest received | 4,007 | 3,262 | -745 | -18.6 | |
| Dividends | 4,542 | 5,833 | 1,291 | 28.4 | |
| Other non-taxation receipts | 8,074 | 10,244 | 2,170 | 26.9 | |
| Non-taxation receipts | 26,202 | 28,515 | 2,312 | 8.8 | |
| Total receipts | 415,327 | 411,284 | -4,043 | -1.0 | |
| Memorandum: | |||||
| Total excise | 21,530 | 21,770 | 240 | 1.1 | |
| Total customs duty | 13,500 | 14,010 | 510 | 3.8 | |
| Capital gains tax(c) | 12,300 | 12,300 | 0 | 0.0 | |
| Medicare and DisabilityCare Australia levy | 15,592 | 15,440 | -152 | -1.0 | |
(a) Other alcoholic beverages are those not exceeding 10 per cent by volume of alcohol (excluding beer, brandy and wine).
(b) Visa application charges were reclassified in the 2015‑16 MYEFO from non‑taxation receipts to taxation receipts to reflect a sustained change in the nature of receipts. The back‑casting relating to the reclassification is reflected in Statement 10 — Historical Series from 2003‑04.
(c) Capital gains tax is part of gross other individuals, company tax and superannuation funds taxes.
| Actual | Estimates | Projections | ||||||
|---|---|---|---|---|---|---|---|---|
| 2014‑15 | 2015‑16 | 2016‑17 | 2017‑18 | 2018-19 | 2019-20 | |||
| $m | $m | $m | $m | $m | $m | |||
| Individuals and other withholding taxes | ||||||||
| Gross income tax withholding | 166,352 | 174,200 | 181,900 | 193,300 | 205,400 | 218,200 | ||
| Gross other individuals | 38,541 | 42,000 | 44,400 | 48,300 | 52,700 | 57,200 | ||
| less: Refunds | 27,033 | 27,800 | 29,350 | 31,250 | 34,350 | 35,700 | ||
| Total individuals and other withholding tax | 177,860 | 188,400 | 196,950 | 210,350 | 223,750 | 239,700 | ||
| Fringe benefits tax | 4,347 | 4,500 | 4,670 | 4,560 | 4,750 | 4,980 | ||
| Company tax | 66,174 | 64,700 | 69,000 | 76,700 | 84,600 | 90,700 | ||
| Superannuation fund taxes | 5,873 | 6,630 | 7,380 | 8,960 | 9,960 | 10,860 | ||
| Petroleum resource rent tax(a) | 1,870 | 800 | 800 | 800 | 800 | 800 | ||
| Income taxation receipts | 256,125 | 265,030 | 278,800 | 301,370 | 323,860 | 347,040 | ||
| Goods and services tax | 54,542 | 57,808 | 60,928 | 64,220 | 67,640 | 70,683 | ||
| Wine equalisation tax | 792 | 860 | 900 | 990 | 1,040 | 1,200 | ||
| Luxury car tax | 520 | 580 | 570 | 570 | 600 | 630 | ||
| Excise and customs duty | ||||||||
| Petrol | 6,035 | 6,200 | 6,450 | 6,700 | 7,050 | 7,550 | ||
| Diesel | 8,908 | 9,460 | 9,860 | 10,260 | 10,860 | 11,620 | ||
| Other fuel products | 2,885 | 2,240 | 2,230 | 2,270 | 2,350 | 2,460 | ||
| Tobacco | 8,848 | 9,410 | 10,160 | 10,990 | 12,310 | 13,490 | ||
| Beer | 2,310 | 2,360 | 2,390 | 2,450 | 2,490 | 2,580 | ||
| Spirits | 1,996 | 2,040 | 2,100 | 2,130 | 2,200 | 2,280 | ||
| Other alcoholic beverages(b) | 899 | 910 | 940 | 960 | 990 | 1,040 | ||
| Other customs duty | ||||||||
| Textiles, clothing and footwear | 645 | 470 | 310 | 260 | 280 | 310 | ||
| Passenger motor vehicles | 732 | 570 | 590 | 630 | 690 | 760 | ||
| Other imports | 1,664 | 1,550 | 1,170 | 890 | 940 | 1,010 | ||
| less: Refunds and drawbacks | 356 | 420 | 420 | 420 | 420 | 420 | ||
| Total excise and customs duty | 34,568 | 34,790 | 35,780 | 37,120 | 39,740 | 42,680 | ||
| Agricultural levies | 515 | 514 | 494 | 495 | 501 | 505 | ||
| Other taxes(c)(d) | 6,432 | 4,925 | 5,298 | 5,400 | 5,439 | 5,539 | ||
| Indirect taxation receipts | 97,369 | 99,477 | 103,969 | 108,795 | 114,961 | 121,238 | ||
| Taxation receipts | 353,494 | 364,507 | 382,769 | 410,165 | 438,821 | 468,278 | ||
| Sales of goods and services(d) | 7,103 | 7,686 | 9,176 | 11,954 | 15,499 | 16,709 | ||
| Interest received | 3,056 | 2,842 | 3,262 | 3,470 | 3,829 | 4,248 | ||
| Dividends | 4,745 | 5,332 | 5,833 | 3,462 | 3,886 | 4,304 | ||
| Other non-taxation receipts | 9,904 | 7,660 | 10,244 | 8,334 | 7,886 | 7,203 | ||
| Non-taxation receipts | 24,807 | 23,520 | 28,515 | 27,221 | 31,100 | 32,464 | ||
| Total receipts | 378,301 | 388,027 | 411,284 | 437,385 | 469,921 | 500,742 | ||
| Memorandum: | ||||||||
| Total excise | 23,663 | 21,360 | 21,770 | 22,530 | 23,630 | 25,140 | ||
| Total customs duty | 10,905 | 13,430 | 14,010 | 14,590 | 16,110 | 17,540 | ||
| Capital gains tax(e) | 9,100 | 10,600 | 12,300 | 13,900 | 15,900 | 17,500 | ||
| Medicare and DisabilityCare Australia levy | 14,480 | 14,970 | 15,440 | 16,100 | 16,870 | 17,690 | ||
(a) This includes $60 million of MRRT receipts in 2014‑15. MRRT applied until 30 September 2014.
(b) Other alcoholic beverages are those not exceeding 10 per cent by volume of alcohol (excluding beer, brandy and wine).
(c) This includes $1.6 billion of carbon price receipts in 2014‑15.
(d) Visa application charges were reclassified in the 2015‑16 MYEFO from non‑taxation receipts to taxation receipts.
(e) Capital gains tax is part of gross other individuals, company tax and superannuation funds taxes. The 2014‑15 reported figure is an estimate.