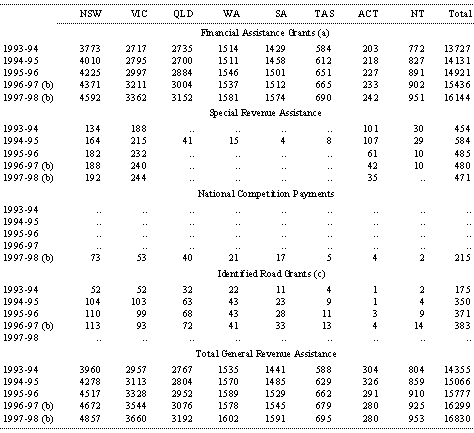
General revenue assistance is estimated to amount to $16,830 million in 1997-98, an increase of 3.3 per cent on the previous year. The estimates of general revenue assistance for 1997-98 have varied from those presented at the 1997 Premiers' Conference in line with movements in the CPI.
Table 7: General Revenue Assistance to the States, 1993-94 to 1997-98 ($million)
(b) Estimates - final figures (except for transitional allowances and special fiscal needs for the ACT) will depend on the actual increase in the CPI for the four quarters to March 1997 and March 1998, and the determination of the Statistician as to the population at 31 December 1996 and 31 December 1997. Final figures for FAGs will also depend on final figures for HFGs.
(c) In 1993-94 and 1994-95, identified road grants were distributed on the basis of the average arterial road allocations for the three years to 1991-92. From 1995-96, the distribution of the grants was progressively moved to a distribution based on FAGs. In 1997-98, these payments will be absorbed into FAGs.
In 1997-98, FAGs to the States are expected to total $16,144.0 million, with the real terms adjustment and the per capita adjustment estimated to contribute $124.6 million and $197.8 million respectively. Final amounts will depend on the actual increase in the CPI for the four quarters to March 1998, the determination of the Statistician as to the population at 31 December 1996 and 31 December 1997 and final figures for HFGs.
Table 8: Level of Financial Assistance Grants (FAGs) 1997-98 ($million)(a)
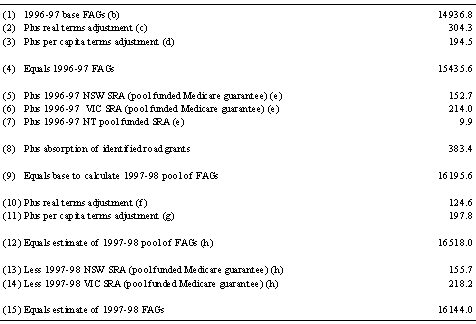
(b) This is the amount set by the States Grants (General Purposes) Act 1994, as base assistance for 1996-97.
(c) This indexes the 1996-97 base FAGs for estimated year average CPI growth to the March quarter 1997 of 2.0 per cent.
(d) Based on a projection (prepared by the ABS on the basis of assumptions agreed to by Treasury) of an increase in the Australian population between 31 December 1995 and 31 December 1996 of 1.3 per cent. The final figure will depend on the determinations of the Statistician as to the population at those dates.
(e) Estimates - final figures will depend on the determination of the Statistician as to the population at 31 December 1995 and 31 December 1996.
(f) Assumes year average CPI growth of 0.8 per cent in the year to the March quarter 1998. Final figures will depend on the actual increase in the CPI.
(g) Based on a projection (prepared by the ABS for the Budget on the basis of assumptions agreed to by Treasury) of an increase in the Australian population between 31 December 1996 and 31 December 1997 of 1.2 per cent. The final figure will depend on the determinations of the Statistician as to the population at those dates.
(h) Estimates - final figures will depend on the actual increase in the CPI for the four quarters to March 1998 and the determination of the Statistician as to the population at 31 December 1996 and 31 December 1997.
The 1996 Premiers' Conference agreed that the funds which were previously paid to the States as identified road grants (IRGs) will be absorbed into the FAGs pool from 1997-98. Table 9 shows the amount of each State's FAGs which are notionally attributable to the IRGs which will be absorbed in 1997-98.
Table 9: Notional Identified Road Grants ($million, estimated)

The per capita relativities are applied to the State populations in order to arrive at a weighted population share for each State. A State's FAGs are equal to its weighted population share of the combined pool of FAGs and unquarantined HFGs, less the HFGs it receives. The distribution and level of HFGs among the States are determined by the Medicare Agreements between the Commonwealth and the States.
Tables 10 and 11 set out the estimated distribution of FAGs for 1996-97 and 1997-98, respectively.
The 1997 Premiers' Conference adopted the per capita relativities recommended in the CGC's 1997 Update report. The terms of reference for the 1997 Update report required the CGC to use the same methodology which it employed to calculate the relativities adopted at the 1996 Premiers' Conference. (The role of the CGC is discussed in Chapter II.)
Table 12 shows that the total redistribution between the States implied by the 1997 Update report relativities is $49.3 million compared to the previous relativities. This is significantly smaller than the redistribution of $126.6 million implied by the amended 1996 Update report relativities, and entails a redistribution of grants away from Western Australia, Queensland and the Australian Capital Territory to the other States.
Table 10: Financial Assistance Grants to the States, 1996-97 (estimated)

(b) The per capita relativities adopted at the 1996 Premiers' Conference.
(c) For ease of presentation, weighted population shares rounded to one decimal place are shown. However, in calculating row (5), unrounded shares are used in accordance with the States Grants (General Purposes) Act 1994.
(d) Estimated unquarantined HFGs - that is, total HFGs less the incentives package, the bonus pools, Medicare benefit adjustments and the other health services component.
(e) The table shows the gross level of FAGs to the States. The actual payments made to some States will be reduced by the amount of their fiscal contribution to the Commonwealth.

(b) The per capita relativities adopted at the 1997 Premiers' Conference.
(c) For ease of presentation, weighted population shares rounded to one decimal place are shown. However, in calculating row (5), unrounded shares are used.
(d) Estimated unquarantined HFGs - that is, total HFGs less the incentives package, the bonus pools, Medicare benefit adjustments and the other health services component.
(e) The table shows the gross level of FAGs to the States. The actual payments made to some States will be reduced by the amount of their fiscal contribution to the Commonwealth.
The main factor responsible for the redistribution is the substitution of 1995-96 for 1990-91 in the five-year review period of the CGC's assessment. The primary impact on grant shares of updating the review period was through changes in the CGC's assessment of disabilities which affect revenue raising capacities and expenditure requirements. More detail is provided below and in Table 12, with the emphasis on factors relevant to those States most affected by the 1997 Update report.
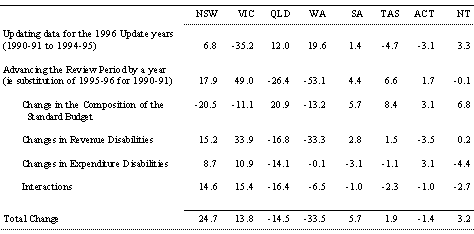
(a) Derived from Table 3-5 of the CGC's Report on General Revenue Grant Relativities - Update 1997.
(b) Based on the estimate of the 1996-97 FAGs/HFGs pool given in Budget Paper No. 3 1996-97, as used by the CGC in its 1997 Update report.
Each State's NCPs are subject to the State making satisfactory progress with the implementation of specified reform conditions in the Agreement. Prior to the scheduled commencement of NCPs in July 1997, the National Competition Council will assess whether each State has met these conditions and provide a final report for consideration by the Commonwealth. The NCC will conduct similar assessments before the commencement of each tranche of payments.
Subject to satisfactory progress, the Commonwealth will provide the States with NCPs estimated to total $215.1 million in 1997-98. The Agreement specifies that the NCPs will be paid on a quarterly basis and distributed between the States on an equal per capita basis. Table 13 shows the allocation of NCPs in 1997-98 if each State meets its obligations under the Agreements.
Table 13: National Competition Payments, 1997-98 ($million)(a)

Table 14: Special Revenue Assistance, 1997-98 ($million)
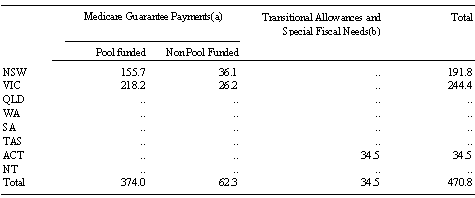
(a) Figures for the Medicare Guarantee Payments are estimates - final figures will depend on the actual increase in the CPI for the four quarters to March 1997 and March 1998 and the determination of the Statistician as to the population at 31 December 1996 and 31 December 1997.
(b) Transitional allowances and special fiscal needs are not adjusted for changes in the CPI or population.
Transitional allowances are designed to assist with the Australian Capital Territory's transition from the generous levels of Commonwealth funding which existed before self-government. In 1997-98, transitional allowances will amount to $20.7 million, a decrease of $7.9 million over 1996-97. This amount incorporates additional transitional allowances for education and hospital services of $10 million which the Commonwealth has agreed to provide to the Australian Capital Territory in accordance with the CGC's recommendation. The Commonwealth will also provide an additional $5 million in 1998-99. The CGC's assessment was that the Australian Capital Territory needed some additional time to implement changes to employment conditions to avoid the high costs it inherited from the Commonwealth. The CGC also indicated that, given the comprehensiveness of its review, these additional allowances should be treated as the final payments required to place the Australian Capital Territory on an equal footing with the States in all areas except policing.
Special fiscal needs are payments to the Australian Capital Territory in recognition that certain functions (for example, the Family Court) are not funded by the Commonwealth, whereas in other States funding arrangements exist between the Commonwealth and the State. In 1997-98, special fiscal needs will amount to $13.8 million, an increase of $0.2 million from 1996-97.
The funding of the five-year Medicare Agreements which commenced on 1 July 1993, and the Medicare guarantee payments, were explained in Budget Paper No. 3 1993-94.
At the 1993 Premiers' Conference, the levels of the Medicare guarantee payments to New South Wales and Victoria were calculated by comparing the gain from distributing the pool of FAGs and HFGs using per capita relativities adjusted for the Medicare Agreements, against the amount the Commonwealth had guaranteed would be the benefit from using Medicare adjusted per capita relativities. Actual payments in 1993-94 and until the Agreement terminates in 1997-98 were to be set by adjusting the level of the guarantee payments agreed in the 1993 Premiers' Conference in line with the growth in the pool of FAGs.
It was decided at the 1993 Premiers' Conference that the Commonwealth would fund around half of the Medicare guarantees to New South Wales and Victoria ($107.7 million in 1993-94), but that this contribution would halve in 1994-95, with a concomitant increase in the payments funded from the pool. At the 1994 Premiers' Conference, it was decided to defer this change in the funding arrangements to 1995-96, at a cost to the Commonwealth of $55.8 million. In accordance with that decision, at the 1995 Premiers' Conference, the Commonwealth reduced its contribution to around one-quarter of the cost of the Medicare guarantees to New South Wales and Victoria.
Following this formula, it was decided at the 1997 Premiers' Conference that the Commonwealth will contribute $62.3 million to funding the guarantees, with the balance to be met from the FAGs pool. The cost to the other States of funding the guarantee payments will be $182.0 million in 1997-98. The net benefits to New South Wales and Victoria of the guarantee payments will be $81.0 million and $163.4 million respectively. (The net benefits to New South Wales and Victoria are less than their guarantee payments because they contribute to the pool-funded component of the guarantees in line with their shares of the FAGs/HFGs pool.)
Table 15: Factors Affecting the Estimated Distribution of General Revenue Assistance, 1997-98 ($million)(a)
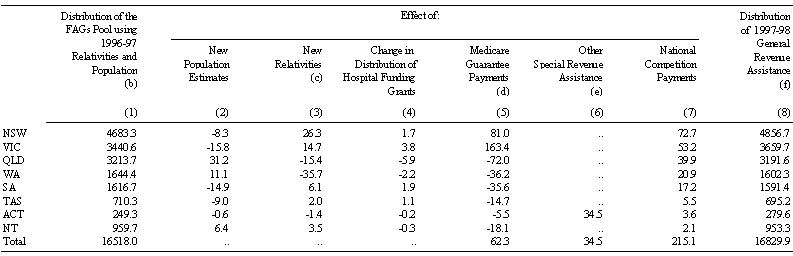
(b) Column (1) was calculated using the 1997-98 level of base HFGs, $4102.9 million, but distributed among the States using 1996-97 base HFG shares.
(c) The effect of using the CGC's 1997 Update report relativities as adopted at the 1997 Premiers' Conference as against those used for 1996-97. This column differs from the final row of Table 12 as it applies the 1997 Update report relativities to the current estimate of the 1997-98 FAGs/HFGs pool, whereas Table 12 uses the same FAGs/HFGs pool as used by the CGC in its 1997 Update report.
(d) Shows the net impact of Medicare guarantee payments of $191.8 million to NSW and $244.4 million to VIC, of which $36.1 million and $26.2 million respectively are funded directly by the Commonwealth (see Table 14) and account for the total net contribution to general revenue assistance of $62.3 million. The net benefit to NSW and VIC is less than the Medicare guarantee payments as funding part of the payments from the pool of FAGs reduces FAGs to NSW and VIC.
(e) Comprises transitional allowances and special fiscal needs.
(f) Sum of (1) to (7). This amount is equal to the sum of row (7) of Table 11, the NCP data shown in Table 13 and the last column of Table 14.


