


Part II: Government Finance Statistics Statements
The financial tables presented in this Part are prepared in accordance with
the Australian Bureau of Statistics (ABS) accrual Government Finance Statistics
(GFS) framework.
The statistical tables that are presented below include an operating statement,
balance sheet and cash flow statement for the Commonwealth general government,
public non-financial corporations (PNFC), total non-financial public, and public
financial corporations (PFC) sectors. The 2001-02 Final Budget Outcome
also includes a statement of other economic flows for the Commonwealth general
government sector. This primarily outlines how `other economic flows' (that
is, those flows not accounted for in the GFS operating statement) impact on
the net worth of the Commonwealth general government sector.
The Commonwealth, States and Territories have an agreed framework - the
Accrual Uniform Presentation Framework (UPF) - for the presentation
of government financial information on a basis consistent with the ABS Government
Finance Statistics (GFS) publication. This Part presents Commonwealth data on
an ABS GFS basis, as required by the UPF. An exception to this is the treatment
of provisions for bad and doubtful debts. The draft ABS GFS publication (Australian
System of Government Finance Statistics: Concepts, Sources and Methods Cat.
No. 5514.0) requires that provisions for bad and doubtful debts be excluded
from the balance sheet. This treatment has not been adopted because excluding
such provisions would overstate the value of Commonwealth assets and net worth
in the balance sheet (and would therefore be inconsistent with the market valuation
principle).
The clear policy intent of the Intergovernmental Agreement on Commonwealth-State
Financial Arrangements is that GST is collected by the Commonwealth, as
an agent for the States and Territories, and appropriated to the States. As
such, it is not shown as Commonwealth revenue in Parts I and III and Appendices
B and C. However, the tables in this Part are presented on an accrual UPF reporting
basis, and show GST as taxation revenue in and payments to the States as grant
expenses out.
Consistent with ABS practice, transactions between the Commonwealth general
government and PNFC sectors are included in the tables produced for these sectors,
but are removed from the total non-financial public sector tables as they are
transactions internal to that sector.
Transactions between the Commonwealth PFC sector and the general government
and PNFC sectors are included in the relevant tables. These transactions include
income transfers such as dividends paid to general government, net advances
paid by general government to PFCs and taxes paid by PFCs.
Appendix A provides reconciliations between key GFS aggregates and their Australian
Accounting Standard No. 31 (AAS31) counterparts.
Table 7: General government
sector operating statement
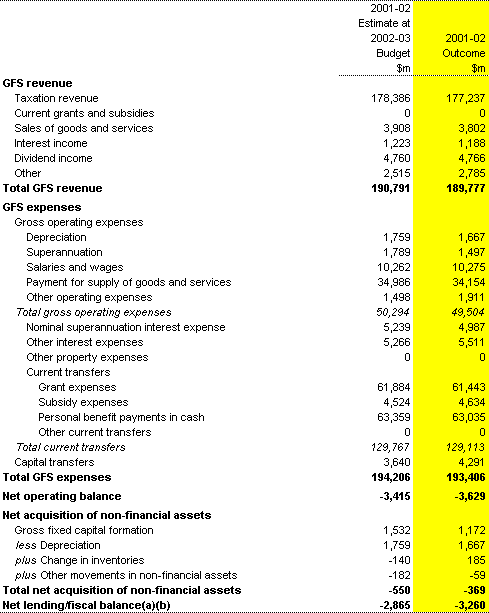
- The fiscal balance and net operating balance outcomes in this table are
$466 million greater than the fiscal balance and net operating balance
outcomes elsewhere in the Final Budget Outcome. Appendix A provides an
explanation.
- The term `fiscal balance' is not used by the ABS.
Table 8: General government
sector balance sheet
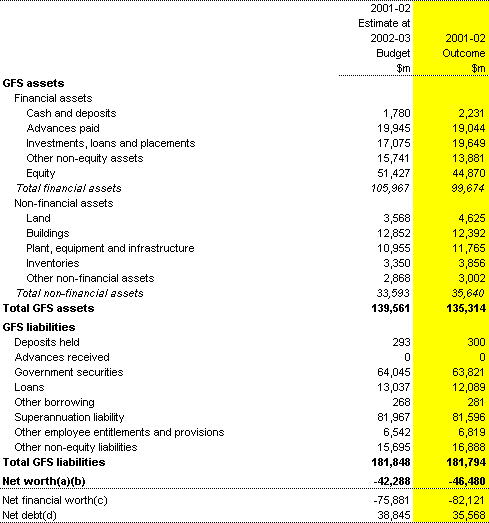
- The net worth outcome in this table is $505 million greater than the
net worth outcomes elsewhere in the Final Budget Outcome. Appendix A provides
an explanation.
- Net worth is calculated as total assets minus total liabilities.
- Net financial worth equals total financial assets minus total liabilities.
- Net debt equals the sum of deposits held, advances received, government
securities, loans and other borrowings, minus the sum of cash and deposits,
advances paid, and investments, loans and placements.
Table 9: General government
sector cash flow statement(a)
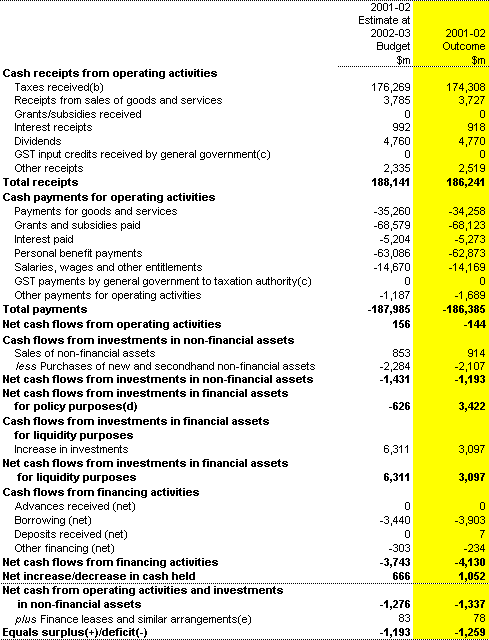
- A positive number denotes a cash inflow, a negative sign denotes a cash
outflow.
- Includes GST cash receipts on a Commonwealth tax basis, which is $133 million
less than GST cash receipts measured on a State tax basis (as shown in Part
III, Note 15).
- Where GST is accounted for as a Commonwealth revenue, GST flows between
general government entities and the taxation authority are treated as transfers
within the general government sector. Therefore, the general government as
a whole does not receive any GST input credit receipts or make any GST payments
to taxation authorities.
- Includes net cash flows from loans, advances and HECS of $1.1 billion,
as shown in Table 6.
- The acquisition of assets under finance leases reduces the surplus/deficit.
The disposal of assets previously held under finance leases improves the surplus/deficit.
Table 10: General government
sector statement of other economic flows (reconciliation of net worth)
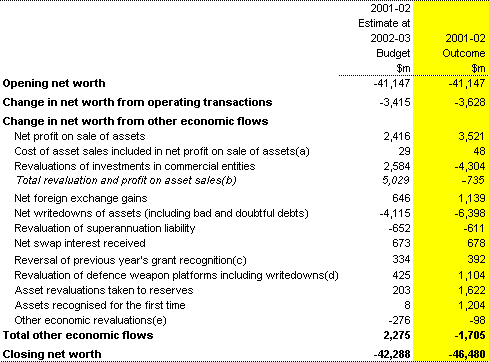
- This component of profit on the sale of assets impacts on net worth as
an operating transaction (rather than an other economic flow) and is therefore
added back to the net profit on sales of assets.
- Revaluations and profit on sale of assets are derived from Australian Accounting
Standards data. Revaluations reflect the difference between the GFS valuation
of commercial entities at market value and the AAS valuation at historic cost.
- Total grants to be paid over a multi-year health programme were previously
recognised as an expense and liability in the year that the programme began.
This treatment has been reversed and the grants will now be recognised as
expenses in the year they are paid, leading to the removal of the previous
liability, consistent with external reporting standards.
- Defence weapons are treated as expenses rather than assets under the GFS
framework, hence, changes in value do not contribute to net worth and are
not included in other economic flows. This component represents the removal
of defence weapons included in net writedowns, assets recognised for the first
time and asset revaluations taken to reserves and other movements.
- Includes net repurchase premia and other revaluations not recorded elsewhere.
Table 11: Supplementary table - Commonwealth
general government revenue (accrual basis)
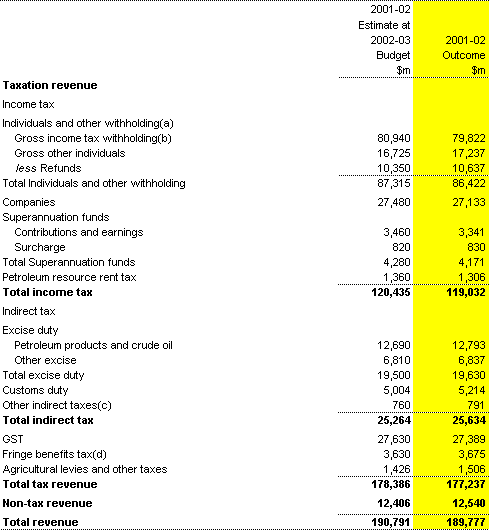
- Includes Medicare levy revenue of $4,970 million.
- Previously reported as Pay As You Go (Withholding) and other withholding.
Other withholding was previously reported under company and other income tax,
and includes amounts withheld for failure to quote a Tax File Number or an
Australia Business Number, interest, dividends and royalty payments to non-residents,
and payments to aboriginal groups for the use of land for mineral exploration
and mining.
- Includes the wine equalisation tax, luxury car tax and the final wholesale
sales tax liability.
- Consistent with GFS reporting standards, excludes fringe benefits tax collected
from Commonwealth government agencies ($360 million in 2001-02).
Table 12: Supplementary table - Commonwealth
general government indirect tax (accrual basis)
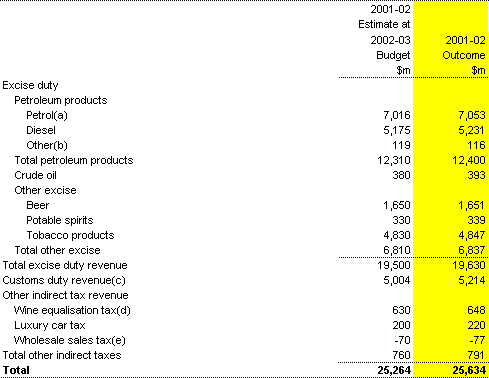
- Includes unleaded petrol and lead replacement petrol.
- Includes aviation gasoline, aviation turbine fuel, fuel oil, heating oil
and kerosene.
- Customs duty includes duties imposed on imported petroleum products, tobacco,
beer and spirits, which are analogous to excise duty on these items.
- Includes the offsetting revenue effects of the WET rebate for cellar door
and other sales.
- WST was abolished on 1 July 2000; however, final liabilities, net of refunds,
were recognised in 2001-02.
Table 13: Public non-financial corporations sector
operating statement
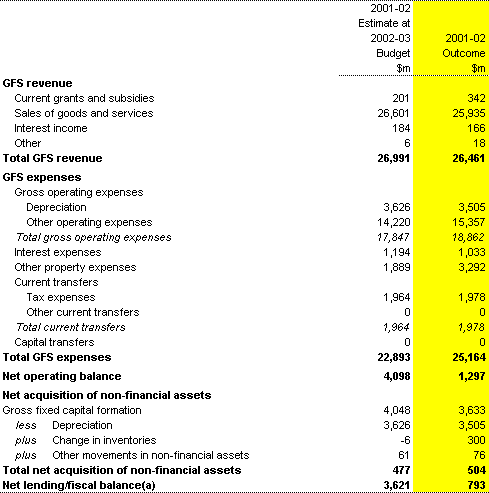
- The term `fiscal balance' is not used by the ABS.
Table 14: Public non-financial
corporations sector balance sheet
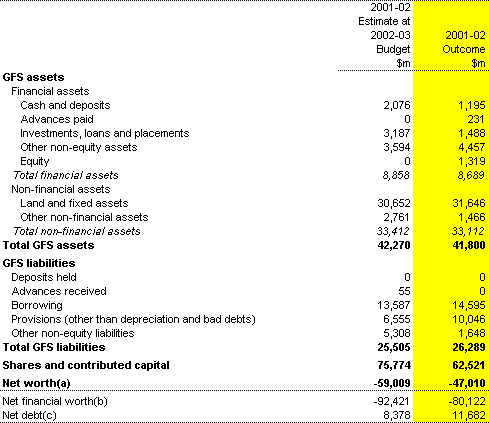
- Net worth is calculated as total assets minus total liabilities minus shares
and other contributed capital. The negative net worth recorded for the PNFC
sector is caused by the different methodologies used to value these components.
Assets and liabilities are valued according to entities' accounting policies
and may not reflect the market valuation. In contrast, in the case of listed
companies the value of shares and other contributed capital reflects the total
market capitalisation, which generally exceeds the entities' book values.
- Net financial worth equals total financial assets minus total liabilities
minus shares and other contributed capital.
- Net debt equals the sum of deposits held, advances received, government
securities, loans and other borrowings, minus the sum of cash and deposits,
advances paid, and investments, loans and placements.
Table 15: Public non-financial
corporations sector cash flow statement(a)
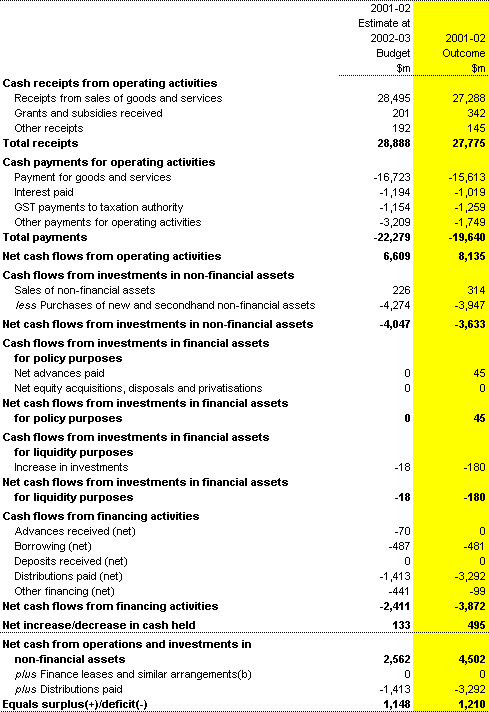
- A positive sign denotes a cash inflow, a negative sign denotes a cash outflow.
- The acquisition of assets under finance leases reduces the surplus/deficit.
The disposal of assets previously held under finance leases improves the surplus/deficit.
Table 16: Total non-financial
public sector operating statement
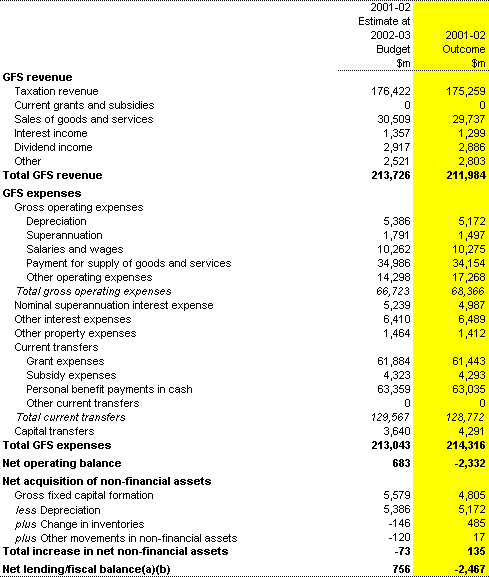
- The fiscal balance and net operating balance outcomes for the total non-financial
public sector in this table are $466 million greater than the fiscal
balance and net operating balance outcomes for this sector in Appendix C.
Appendix A provides an explanation.
- The term `fiscal balance' is not used by the ABS.
Table 17: Total non-financial
public sector balance sheet
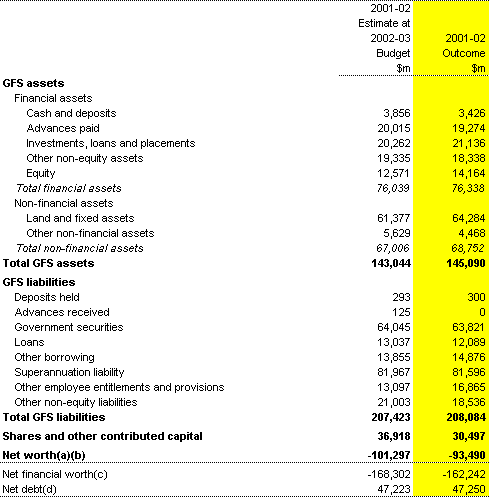
- Net worth is calculated as total assets minus total liabilities minus shares
and other contributed capital.
- The net worth outcome for the total non-financial public sector in this
table is $505 million greater than the net worth outcomes in Appendix
C. Appendix A provides an explanation.
- Net financial worth equals total financial assets minus total liabilities
minus shares and other contributed capital.
- Net debt equals the sum of deposits held, advances received, government
securities, loans and other borrowings, minus the sum of cash and deposits,
advances paid, and investments, loans and placements.
Table 18: Total non-financial
public sector cash flow statement(a)
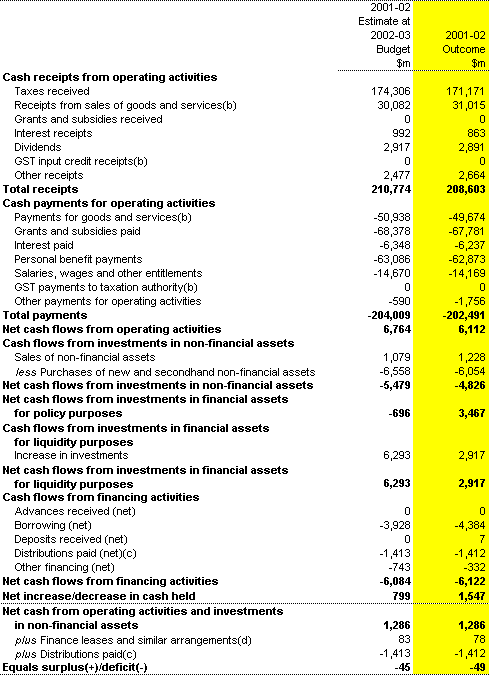
- A positive sign denotes a cash inflow, a negative sign denotes a cash outflow.
- GST flows are excluded from these categories as they are intra-sector transactions.
- 'Distributions paid' comprise Non-Financial Public Sector (NFPS) dividends
to external shareholders.
- The acquisition of assets under finance leases reduces the surplus/deficit.
The disposal of assets previously held under finance leases improves the surplus/deficit.
Table 19: Public financial
corporations sector operating statement
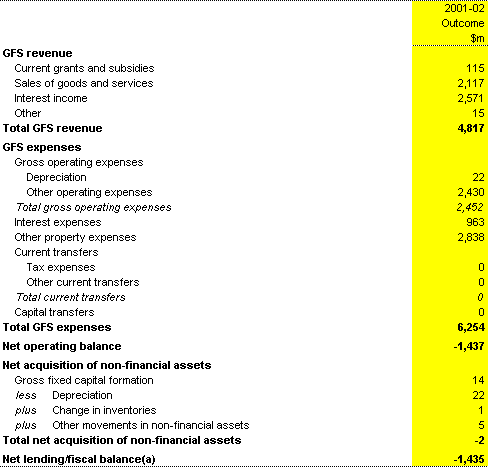
- The term 'fiscal balance' is not used by the ABS.
Table 20: Public financial
corporations sector balance sheet
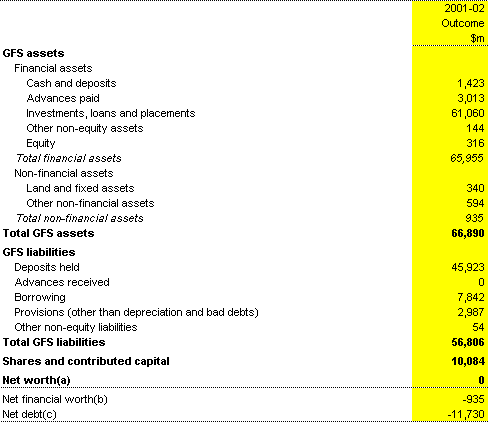
- Net worth is calculated as total assets minus total liabilities minus shares
and other contributed capital.
- Net financial worth equals total financial assets minus total liabilities
minus shares and other contributed capital.
- Net debt equals the sum of deposits held, advances received and borrowing,
minus the sum of cash and deposits, advances paid, and investments, loans
and placements.
Table 21: Public financial
corporations sector cash flow statement(a)
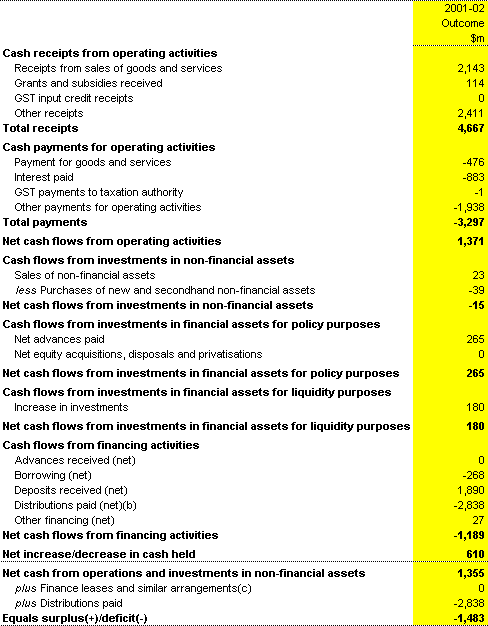
- A positive sign denotes a cash inflow, a negative sign denotes a cash outflow.
- 'Distributions paid' comprise PFC dividends to external shareholders.
- The acquisition of assets under finance leases reduces the surplus/deficit.
The disposal of assets previously held under finance leases improves the surplus/deficit.
Loan Council Allocation
Under Loan Council arrangements, every year the Commonwealth and each State
and Territory nominate a Loan Council Allocation (LCA). A jurisdiction's LCA
incorporates:
- the estimated non-financial public sector cash deficit (made up from the
general government and public non-financial corporations sector deficits);
- net cash flows from investments in financial assets for policy purposes;
and
- memorandum items. These transactions, though not formally borrowings, have
many of the characteristics of borrowing.
LCA nominations are considered by the Loan Council, having regard to each jurisdiction's
fiscal position and reasonable infrastructure requirements, as well as the macroeconomic
implications of the aggregate figure.
As set out in Table 22, the Commonwealth's 2001-02 LCA outcome is a $2.4 billion
surplus, compared with the last published estimate in the 2001-02 Mid-Year Economic
and Fiscal Outlook of $3.8 billion and the 2001-02 Budget estimate of $7.8
billion. The LCA outcome exceeds the lower bound of the LCA Budget estimate
by more than the 2 per cent tolerance limit. A tolerance limit of
2 per cent of non-financial public sector revenue applies between
the LCA Budget update and the outcome. Tolerance limits recognise that LCAs
are nominated at an early stage of the budget process and may change as a result
of policy and parameter changes.
Table 22: Commonwealth Loan Council Allocation for
2001-02
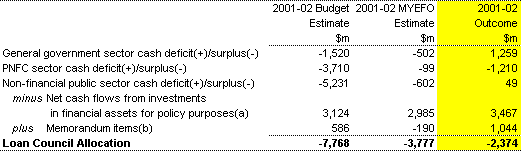
- Such transactions involve the transfer or exchange of a financial asset
and are not included within the cash deficit. However, the cash flow from
investments in financial assets for policy purposes has implications for a
government's call on financial markets.
- For the Commonwealth, memorandum items comprise the change in net present
value (NPV) of operating leases (with NPV greater than $5 million), university
borrowings, overfunding of superannuation and an adjustment to exclude the
net financing requirements of statutory marketing authorities and Telstra
from the LCA.
