




Statement 4: Fiscal policy in the current economic environment (Continued)
Analysis of recent revenue weakness
The challenges presented by post‑GFC revenue weakness for fiscal policy are highlighted by the extent of downward revisions to tax receipt forecasts since the 2010‑11 Budget, when a surplus in 2012‑13 was initially projected. Tax receipts for 2012‑13 are now expected to be $27 billion (around 8 per cent) lower than projected at the time of the 2010‑11 Budget, and $23 billion lower in 2013‑14. Importantly, tax receipts are similarly lower across the forward estimates, with downward revisions to projected tax receipts since the 2010‑11 Budget amounting to $92 billion over the six years to 2015‑16.
This is in marked contrast to the pre‑GFC period, when revenues were consistently and repeatedly revised up (Chart 4). Over the five years leading up to the GFC, revenue write‑ups from parameter and other variations from the 2003‑04 Budget to the 2008‑09 Budget totalled around $200 billion.4 Over the five years since the 2008‑09 Budget revenue write‑downs have amounted to almost $200 billion.
Chart 4: Revenue write‑ups and write‑downs
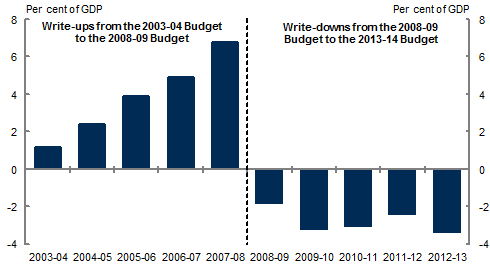
Note: Revenue revisions due to parameter and other variations (excluding policy decisions). Left‑hand side includes only revisions after 2003‑04 Budget. Right‑hand side includes only revisions after 2008‑09 Budget. Dotted line marks the advent of the GFC.
Source: Treasury.
Weaker nominal GDP
These write‑downs to the tax receipt forecasts and projections are due primarily to downward revisions to nominal GDP growth and weaker capital gains tax (CGT) receipts. Nominal GDP broadly captures the level of income in the economy, which is the primary determinant of government revenues.5
As discussed in more detail in Budget Statement 2, recent weakness in nominal GDP growth reflects the unusual combination of lower global prices for Australia's key commodity exports and a persistently high Australian dollar, which has contributed to weaker‑than‑anticipated growth in domestic prices. With commodity prices expected to fall further and domestic inflation to remain subdued, the recent weakness translates into downward revisions to the level of nominal GDP across the forward estimates. Nominal GDP levels across the forward estimates are around 4 per cent lower than projected at the time of the 2010‑11 Budget.
While both the timing and pace of the fall in the terms of trade are uncertain, an unwinding has been factored into the forward estimates since 2005. The fact that the terms of trade rose far more than expected boosted nominal GDP and revenue more than was anticipated up to 2007‑08; with the terms of trade recently falling more rapidly than anticipated, this has reduced nominal GDP and revenue growth more than forecast.
Declines in the tax‑to‑GDP ratio
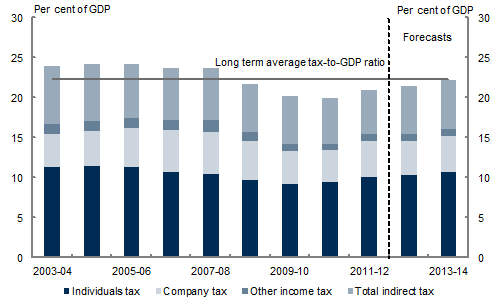
The downward revision to tax receipts in recent years is also due in part to a lower revenue yield per dollar of GDP. From its pre‑crisis level of 23.7 per cent of GDP in 2007‑08, the tax‑to‑GDP ratio fell 3.7 percentage points (around 16 per cent) to 20.0 per cent in 2010‑11, the biggest decline in the ratio since the 1950s. This fall reflected declines across a number of categories (Chart 5).
Chart 5: Composition of tax receipts
Source: Treasury estimates.
The tax share of GDP in 2012‑13 is now expected to be 1.0 percentage points lower than projected at the 2010‑11 Budget and 0.8 percentage points lower than its long‑term average. Receipts in 2012‑13 would be $16 billion higher than currently forecast if the previously projected tax share had been realised. The tax share is expected to remain well below pre‑GFC levels across the forward estimates, reflecting a number of factors, including the enduring impacts of the GFC on CGT receipts (which were at unsustainable levels prior to the GFC), changes in the sectoral composition of profits and the effects of previous policy decisions.
Longer‑term changes in the composition of profits
Changes in the composition of the economy can affect tax receipts because average effective tax rates differ between components of aggregate incomes. A key factor in this regard has been the growing share in the economy of the resources sector, which does not pay as much tax per dollar of economic activity as other sectors (measured by the ratio of tax paid to net operating surplus).6 Since 2008‑09 the ratio of company tax paid to NOS for mining has averaged around 15 per cent, compared to 25 per cent for the corporate sector as a whole.7 This relatively low ratio reflects a range of factors, including royalty deductions, the capital‑intensive nature of mining and the accelerated rates at which investment can be written off for tax purposes. For example, increasing levels of investment in this sector have seen annual mining depreciation growth triple, from around 4.5 per cent in 2003‑04 to 15 per cent by 2011‑12.
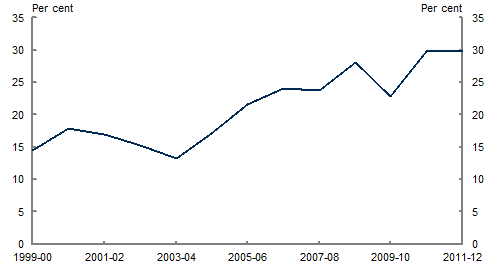
High prices for resource exports have boosted resource sector profits so much that mining's share of corporate gross operating profits has doubled since 2003‑04 (Chart 6). The low effective tax‑to‑NOS ratio means that an increased share of mining profits in total profits and nominal GDP will lower the tax‑to‑GDP ratio. Despite the forecast decline in global commodity prices, the mining share is likely to remain elevated for some time. Depreciation deductions resulting from the surge in resources sector investment in recent years are also expected to depress tax receipts for some time, although this impact is expected to eventually recede.
Chart 6: Mining share of gross operating surplus
Source: ABS Cat. No. 5204.0 and Treasury.
Another contributor to the recent growth in deductions is the immediate deduction that is available for assets first used in exploration. In this Budget the Government has announced that it will better target these deductions to address abuses while supporting genuine exploration activity.
Lower realised capital gains
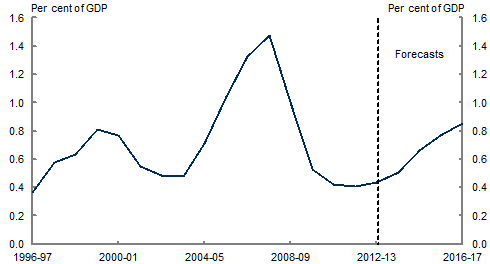
Another key reason the tax‑to‑GDP ratio has been unusually low recently is lower CGT receipts. CGT receipts were unusually high in the years leading up to the GFC, as strong growth in asset prices led to high levels of realised capital gains (Chart 7). The decline in global share prices during the GFC, along with weak asset price growth since, has reduced CGT receipts to less than one‑third of these peak levels as a share of GDP. Revisions to CGT receipts have been substantial with forecast CGT receipts for 2013‑14 now $10 billion lower than expected at the 2010‑11 Budget. While CGT receipts are expected to recover somewhat over the forward estimates, they are not expected to return to pre‑GFC levels, which reflected a period of strong asset price growth that is unlikely to be repeated in the foreseeable future (Lowe 2012).
Chart 7: Capital gains tax receipts as a share of GDP
Source: Treasury.
Impacts of policy changes and other factors
Policy changes can also affect the tax‑to‑GDP ratio. One series of policy changes that is having a particularly large impact on the tax share is the successive large cuts to personal income tax rates implemented between 2005‑06 and 2009‑10. The average personal income tax rate fell from over 23 per cent of taxable income in the early 2000s to less than 20 per cent in 2009‑10 — which meant that the personal income tax system delivered around 15 per cent less revenue for each dollar of taxable income.
While personal income tax collections as a share of GDP are expected to return to early 2000s levels by the end of the forward estimates period, revenue forgone in the interim will have been substantial. For example, tax receipts would have been $14 billion higher in 2012‑13 had the average personal tax rate remained at its 2005‑06 level, abstracting from any impacts the tax cuts may have had on the personal income tax base.
Other policy changes that have contributed to reducing tax receipts as a share of GDP include changes to superannuation taxation in 2006‑07 and business tax and capital gains tax concessions introduced in the early 2000s. The decision announced in the 2006‑07 Budget to make superannuation benefits tax‑free for retirees aged 60 and over who have already paid tax on contributions and earnings has had substantial enduring impacts on personal tax collections. However, the Government has announced a range of policies designed to reduce tax expenditures over the next decade, including reducing concessions on contributions for very high income earners and capping the tax exemption for earnings on superannuation assets supporting retirement income streams to $100,000 of annual earnings for each individual.
In this Budget the Government has also announced a number of measures to protect the corporate tax base. These measures address a number of tax planning strategies used by multinational enterprises and domestic companies to exploit design flaws, vulnerabilities and unexpected interactions in Australia's corporate tax laws.
In addition to the specific factors that have reduced the tax share in recent years, there are other factors that have eroded the tax‑to‑GDP ratio over a longer period. A significant long‑term factor has been the trend decline in indirect taxes as a proportion of GDP. Indirect tax (excluding GST) collections have fallen from 3.6 per cent of GDP in 2001‑02 to 2.5 per cent of GDP in 2011‑12.
4 'Parameter and other variations', as shown in Table 5 in Budget Statement 3, capture all factors affecting receipts other than policy decisions.
5 Nominal GDP differs from nominal gross national income because of net primary income paid to non-residents (mainly interest and dividends on net foreign liabilities).
6 Net operating surplus (NOS) is gross operating surplus (the National Accounts measure of company profits) less depreciation.
7 The definition of mining used in this section aligns with the Australia and New Zealand Standard Industrial Classification (ANZSIC) 2006 codes on the Australian Business Register and includes extraction of gas and petroleum.
Note: Where possible, Budget documents are available in HTML and for downloading in Portable Document Format(PDF). If you require further information on any of the tables or charts on this website, please contact The Treasury.
