


Statement 5 (continued)
Tax outlook
Since the 2013‑14 MYEFO, tax receipts, abstracting from policy, are broadly unchanged over the forward estimates. Expected tax receipts are lower in 2013‑14 largely driven by lower than expected year‑to‑date collections, while across the forward estimates tax receipts have been affected by broadly offsetting revisions to different components of nominal GDP.
Spare capacity in the labour market has weakened the outlook for wages which is more than offset by stronger expected corporate profits, driven by higher than previously anticipated domestic prices in early 2013‑14. Household consumption is expected to be higher as the household sector continues to respond to low interest rates. For more details on the economic outlook see Budget Statement 2.
The downgrade to anticipated wage growth has resulted in a downward revision to individuals tax of around $4.4 billion over the four years to 2016‑17. Stronger forecast gross operating surplus (GOS), the National Accounts measure of corporate profits, has resulted in company tax being revised upwards over the four years to 2016‑17 by $4.7 billion since the 2013‑14 MYEFO. In addition, higher than expected consumption has also led to a significant revision to GST receipts which are forecast to increase by around $4.5 billion over the four years to 2016‑17.
Forecast superannuation fund taxes are expected to be lower relative to the 2013‑14 MYEFO, down $330 million in 2013‑14 and $2.9 billion over the four years to 2016‑17. The revision is primarily due to lower expected capital gains tax.
Total capital gains receipts have been revised down by around $4.3 billion over the four years to 2016‑17. This has been primarily driven by lower expected superannuation funds capital gains tax.
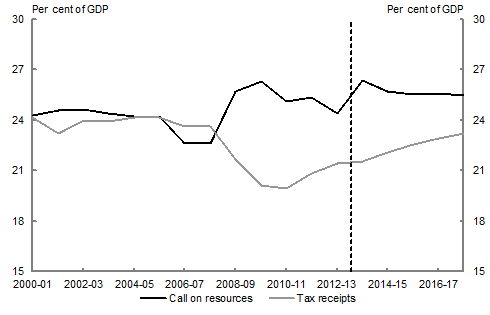
Including policy, revisions to forecast tax receipts mean the tax‑to‑GDP ratio is also broadly unchanged since the 2013‑14 MYEFO, returning to and increasing above the 20‑year average of 22.4 per cent by the end of the forward estimates.
Source: Treasury.
The tax‑to‑GDP ratio does not show the government's total call on community resources, which is a measure of the amount of receipts and borrowings required to fund government activities. By including government borrowings, the government's call on resources falls gradually over the medium‑term in marked contrast to the path of the previous six years (Chart 1).
Another aspect affecting the tax outlook is the revised medium‑term economic projection methodology. The 2014‑15 Budget adopts a new framework, which allows for a reduction in the spare capacity in the economy — a closing of the output gap — over the five years following the detailed forecast period. Although nominal GDP is higher as a result of the new methodology, compositional changes result in slower wage growth and higher corporate profits growth. These changes result in lower forecast total tax receipts, down $700 million in 2016‑17 and $600 million in 2017‑18 (Table 3). For more details on the revised medium‑term economic projection methodology see Budget Statement 2.
| Estimates | Projections | |||||
|---|---|---|---|---|---|---|
| 2013‑14 $m |
2014‑15 $m |
2015‑16 $m |
2016‑17 $m |
2017‑18 $m | ||
| Individuals tax | 0 | 0 | 0 | -1,400 | -2,300 | |
| Corporate taxes | 0 | 0 | 0 | 700 | 1,700 | |
| Total tax receipts | 0 | 0 | 0 | -700 | -600 | |