


Budget Paper 1 — Statement 5
Source: Treasury.
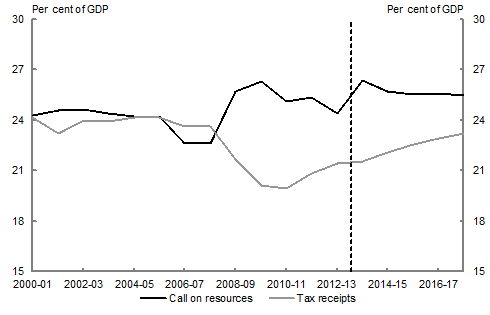
This chart shows the ratios of tax receipts to GDP and the call on resources to GDP from 2000-01 to 2017-18. The tax-to-GDP ratio is expected to rise from 21.6 per cent in 2013-14 to 23.2 per cent by the end of the forward estimates. Call on resources as a per cent of GDP is expected to fall from 26.4 per cent in 2013-14 to 25.5 per cent by the end of the forward estimates.
| Years | Call on resources | Tax receipts |
|---|---|---|
| 2000‑01 | 24.3 | 24.1 |
| 2001‑02 | 24.6 | 23.2 |
| 2002‑03 | 24.6 | 24.0 |
| 2003‑04 | 24.4 | 23.9 |
| 2004‑05 | 24.2 | 24.2 |
| 2005‑06 | 24.2 | 24.2 |
| 2006‑07 | 22.6 | 23.7 |
| 2007‑08 | 22.6 | 23.6 |
| 2008‑09 | 25.7 | 21.7 |
| 2009‑10 | 26.3 | 20.1 |
| 2010‑11 | 25.1 | 20.0 |
| 2011‑12 | 25.4 | 20.9 |
| 2012‑13 | 24.4 | 21.4 |
| 2013‑14 | 26.2 | 21.6 |
| 2014‑15 | 25.9 | 22.1 |
| 2015‑16 | 25.7 | 22.5 |
| 2016‑17 | 25.4 | 23.0 |
| 2017‑18 | 25.7 | 23.2 |
Source: Treasury.
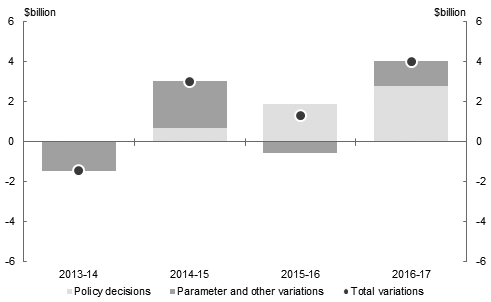
This chart shows that since the 2013-14 MYEFO, total receipts have been revised up by around $3.0 billion in 2014-15 and by around $7.0 billion over the four years to 2016-17. The chart decomposes the revisions into variations that stem from policy decisions and variations that stem from parameter and other variations.
| Years | Policy decisions | Parameter and other variations | Total variations |
|---|---|---|---|
| 2013‑14 | 0.00 | ‑1.43 | ‑1.43 |
| 2014‑15 | 0.67 | 2.36 | 3.04 |
| 2015‑16 | 1.92 | ‑0.57 | 1.34 |
| 2016‑17 | 2.79 | 1.25 | 4.03 |
Source: Treasury.
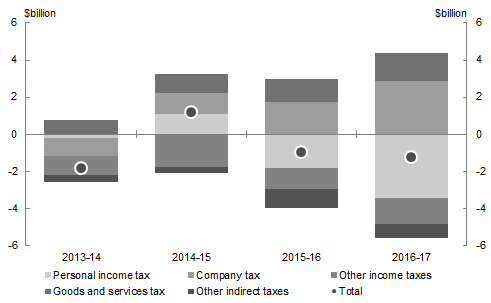
This chart shows the tax receipts revisions since 2013-14 MYEFO decomposed into variations by revenue source.
| Years | Personal income tax |
Company tax | Other income taxes |
Goods and services tax |
Other indirect taxes |
Total |
|---|---|---|---|---|---|---|
| 2013‑14 | ‑0.2 | ‑1.0 | ‑1.0 | 0.8 | ‑0.4 | ‑1.8 |
| 2014‑15 | 1.1 | 1.1 | ‑1.7 | 1.0 | ‑0.3 | 1.2 |
| 2015‑16 | ‑1.8 | 1.7 | ‑1.1 | 1.2 | ‑1.0 | ‑1.0 |
| 2016‑17 | ‑3.5 | 2.9 | ‑1.4 | 1.5 | ‑0.8 | ‑1.2 |
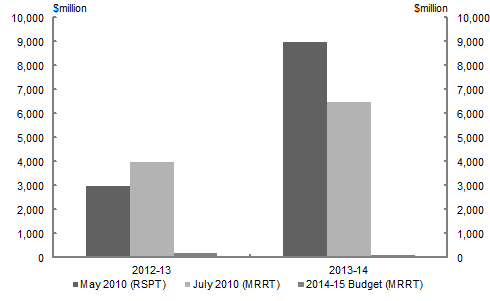
Note: Estimates of net receipts from the RSPT and MRRT represent the net impact across different revenue heads. These include offsetting reduction in company tax (through deductibility) and interactions with other taxes.
Source: Treasury
This amount of tax collected versus what was expected for MRRT.
| Revenue ($m) | 2012-13 | 2013-14 |
|---|---|---|
| May 2010 (RSPT) | 3,000 | 9,000 |
| July 2010 (MRRT) | 4,000 | 6,500 |
| 2014-15 Budget (MRRT) | 200 | 100 |
Source: Treasury.
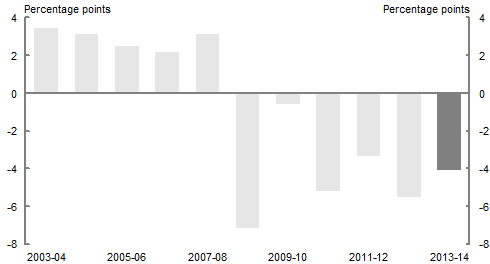
This column chart shows the Budget forecast error (in percentage points) on taxation receipts growth from 2003-04 to 2013-14. The chart shows that between 2003-04 and 2007-08, receipts forecasts tended to under-predict outcomes. From 2008-09 to 2013-14, receipts forecasts have tended to over-predict outcomes.
| Years | Budget forecast error on taxation receipts growth |
|---|---|
| 2003‑04 | 3.5 |
| 2004‑05 | 3.2 |
| 2005‑06 | 2.5 |
| 2006‑07 | 2.2 |
| 2007‑08 | 3.2 |
| 2008‑09 | ‑7.1 |
| 2009‑10 | ‑0.6 |
| 2010‑11 | ‑5.2 |
| 2011‑12 | ‑3.3 |
| 2012‑13 | ‑5.5 |
| 2013‑14 | ‑4.1 |
Source: Treasury.
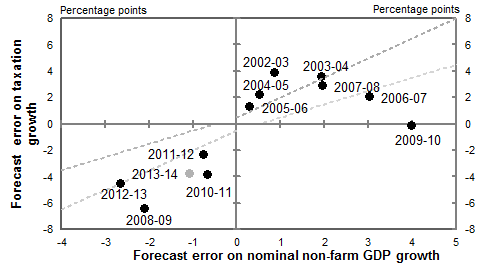
This chart plots the Budget forecast errors on nominal non-farm GDP growth and on tax receipts growth (excluding capital gains tax) from 2002-03 to 2013-14. The vertical axis depicts the forecast errors, n percentage points, on tax receipts growth. The horizontal axis depicts the forecast errors, in percentage points, on nominal non-farm GDP growth. In 2013-14, the forecast error on tax receipts growth is expected to be around -3.9 per cent, while the forecast error on nominal non-farm GPD growth is expected to be around -1.1 per cent.
| Years | Forecast error on nominal non-farm GDP growth | Forecast error on taxation growth |
|---|---|---|
| 2002‑03 | 0.9 | 3.8 |
| 2003‑04 | 2.0 | 3.6 |
| 2004‑05 | 0.5 | 2.2 |
| 2005‑06 | 0.3 | 1.3 |
| 2006‑07 | 3.1 | 2.0 |
| 2007‑08 | 2.0 | 2.9 |
| 2008‑09 | ‑2.1 | ‑6.5 |
| 2009‑10 | 4.0 | ‑0.2 |
| 2010‑11 | ‑0.6 | ‑3.9 |
| 2011‑12 | ‑0.7 | ‑2.4 |
| 2012‑13 | ‑2.6 | ‑4.6 |
| 2013‑14 | ‑1.1 | ‑3.9 |
Source: Treasury.
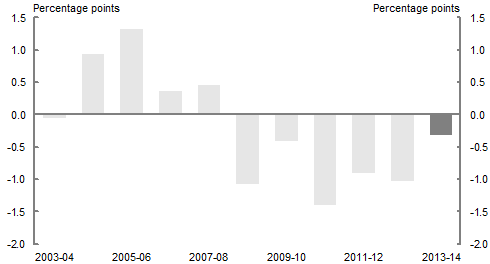
This column chart shows (in percentage points) the contribution of the error in capital gains tax receipts to the error in total tax receipts growth, 2003-04 to 2013-14. The forecast error in 2013-14 is estimated at around -0.3 per cent, which is smaller than the error in 2012-13.
| Years | Budget forecast error on capital gains tax receipts (contribution to growth in total tax receipts) |
|---|---|
| 2003‑04 | ‑0.05 |
| 2004‑05 | 0.95 |
| 2005‑06 | 1.33 |
| 2006‑07 | 0.37 |
| 2007‑08 | 0.47 |
| 2008‑09 | ‑1.07 |
| 2009‑10 | ‑0.40 |
| 2010‑11 | ‑1.40 |
| 2011‑12 | ‑0.90 |
| 2012‑13 | ‑1.02 |
| 2013‑14 | ‑0.31 |