STATEMENT 4 - OUTLAYS
PART I.
OVERVIEW OF BUDGET OUTLAYS
Introduction
Statement 4 presents the 1997-98 Budget and forward
estimates of outlays of the Commonwealth Budget Sector.
It provides detailed information on the allocation
of Commonwealth funds to the various functions of government
as well as analysis by economic type and portfolio.
The Australian Bureau of Statistics (ABS) Government
Purpose Classification (GPC) is used to classify transactions.
The overview discusses trends in outlays, running costs
budgets and staffing levels. The Statistical Appendix
tables show outlays over the last decade and the budget
and forward years by function, subfunction and economic
type. Also shown are outlays on capital works, running
costs budgets and staffing levels.
Refer to Budget
Paper No. 2 for details of policy decisions affecting
outlays in this Budget. Statement
7 provides information on total public sector outlays
and fulfils requirements on the Commonwealth, arising
from the revised uniform presentation framework agreed
at the March 1997 Loan Council meeting, to report financial
statistics using ABS concepts and reporting structures.
Overview of Budget
Outlays
The budget outlays are based on a system of rolling
forward estimates, compiled by the Department of Finance
in consultation with other departments and agencies.
They record the cost of on-going Government policy
but do not include any provision for new programmes,
expansion of existing programmes that has not been
agreed by the Government or programmes that are not
expected to continue.
Table 1
provides an overview of underlying outlays by portfolio.
Detailed data by function and economic type are contained
in the Statistical
Appendix to this Statement.
Trends in Outlays
Underlying outlays provide a more reliable guide to
overall trends in Commonwealth finances than headline
outlays. In recent years, underlying outlays mainly
reflect the removal from headline outlays of major
equity asset sales and repayments of State loans.
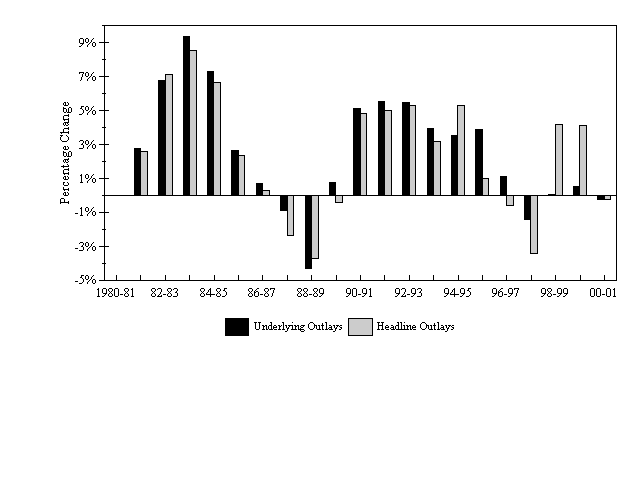
Between 1990-91 and 1995-96, underlying outlays grew
by around 4.5 per cent a year in real terms. Underlying
outlays growth is projected to be much lower in 1996-97
at around 1.1 per cent. For 1997-98 underlying outlays
are estimated to fall in real terms by 1.4 per cent,
reflecting tight control of Government spending. The
last period in which negative real underlying outlays
growth was recorded was in 1987-88 and 1988-89. Real
growth rates for underlying outlays over 20 years are
shown in Chart
1. There is a large divergence between growth
rates for underlying and headline outlays in the forward
estimates primarily due to the effects of several large
equity asset sales and a lower repayment of advances
by the States expected in 1998-99.
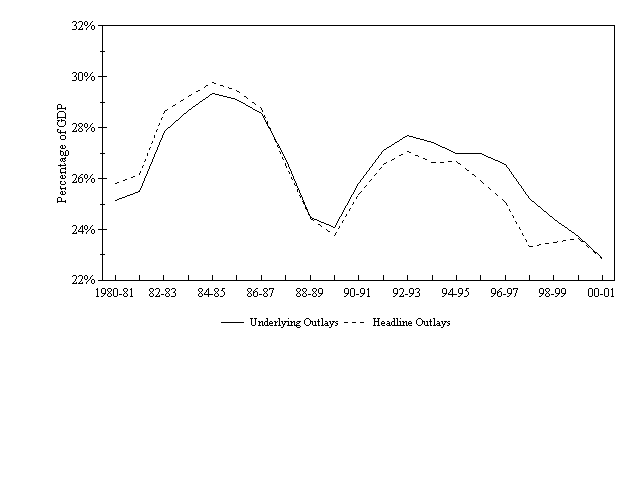
The ratio of budget outlays to GDP shown in Chart
2 is an indicator of the share of national resources
devoted to Commonwealth budget programmes. The ratio
largely tracks the economic cycle, partly reflecting
the operation of the Commonwealth's automatic stabilisers
(during periods of recession Commonwealth outlays on
labour market programmes and in the social security
and welfare area rise substantially and the reverse
occurs in times of economic and employment growth).
Outlays are also significantly affected by discretionary
policy decisions, which alter the structural budgetary
position. Outlays as a proportion of GDP are expected
to decline through the forward years, following policy
decisions in this and the 1996-97 Budget which have
repaired the structural balance after deterioration
in the first half of the 1990s.
Table
1. Underlying Outlays by Portfolio
-
|
- 1996-97
|
- 1997-98
|
-
|
- 1998-99
|
- 1999-00
|
- 2000-01
|
-
|
- Revised
|
- Budget
|
- Change
|
- Estimate
|
- Estimate
|
- Estimate
|
-
|
- $m
|
- $m
|
- %
|
- $m
|
- $m
|
- $m
|
- Parliament
|
- 154.1
|
- 164.2
|
- 6.6
|
- 160.1
|
- 161.2
|
- 162.2
|
- Attorney-General's
|
- 1235.2
|
- 1118.1
|
- -9.5
|
- 866.7
|
- 863.5
|
- 878.5
|
- Communications and the Arts
|
- 1210.5
|
- 1189.1
|
- -1.8
|
- 1175.1
|
- 1166.8
|
- 1180.5
|
- Defence
|
- 11025.7
|
- 11479.8
|
- 4.1
|
- 11724.6
|
- 11966.0
|
- 12170.2
|
- Veterans' Affairs
|
- 6458.4
|
- 6391.1
|
- -1.0
|
- 6421.3
|
- 6511.2
|
- 6586.9
|
- Employment, Education, Training and Youth Affairs
|
- 13315.8
|
- 12907.4
|
- -3.1
|
- 12716.7
|
- 12794.2
|
- 12922.5
|
- Environment, Sport and Territories
|
- 1827.8
|
- 1980.7
|
- 8.4
|
- 2128.6
|
- 2148.5
|
- 2100.4
|
- Finance (a)
|
- 467.3
|
- 1079.3
|
- 131.0
|
- 517.3
|
- 608.5
|
- 564.6
|
- Administrative Services (b)
|
- 400.1
|
- 52.6
|
- -86.9
|
- 252.4
|
- 388.2
|
- 445.4
|
- Foreign Affairs and Trade
|
- 1989.8
|
- 2081.9
|
- 4.6
|
- 1947.6
|
- 1982.6
|
- 2021.4
|
- Health and Family Services
|
- 20671.5
|
- 22209.4
|
- 7.4
|
- 22920.0
|
- 24024.8
|
- 25237.3
|
- Immigration and Multicultural Affairs
|
- 474.2
|
- 519.6
|
- 9.6
|
- 477.8
|
- 473.8
|
- 485.7
|
- Industrial Relations
|
- 258.5
|
- 268.7
|
- 3.9
|
- 271.6
|
- 274.9
|
- 279.5
|
- Industry, Science and Tourism
|
- 3084.8
|
- 3238.6
|
- 5.0
|
- 3219.6
|
- 3164.5
|
- 3073.4
|
- Primary Industries and Energy
|
- 1786.0
|
- 1584.5
|
- -11.3
|
- 1427.6
|
- 1375.6
|
- 1194.3
|
- Prime Minister and Cabinet
|
- 1045.4
|
- 1131.6
|
- 8.2
|
- 1274.5
|
- 1398.3
|
- 1521.9
|
- Social Security
|
- 41327.0
|
- 42229.6
|
- 2.2
|
- 42712.1
|
- 43993.3
|
- 45018.3
|
- Transport and Regional Development
|
- 1727.4
|
- 1386.1
|
- -19.8
|
- 1298.6
|
- 1268.0
|
- 1233.9
|
- Treasury
|
- 28172.0
|
- 27414.2
|
- -2.7
|
- 28183.7
|
- 28512.1
|
- 28405.4
|
- Contingency Reserve
|
- -150.0
|
- -1222.2
|
- na
|
- 1090.1
|
- 1871.1
|
- 2736.9
|
- TOTAL
|
- 136481.3
|
- 137204.0
|
- 0.5
|
- 140786.0
|
- 144946.9
|
- 148219.1
|
- (a) Increase in Finance outlays in 1997-98 primarily
reflects cost of the Telstra sale in 1997-98 and proceeds
from the sale of DASFLEET reducing outlays in 1996-97.
- (b) Decrease in Administrative Services outlays in
1997-98 primarily reflects divestment of real property.
Chart
1. Real Growth in Outlays
In the late 1980s, policy decisions and strong economic
growth combined to reduce the ratio of outlays to GDP.
With the onset of recession in 1990, this pattern
was reversed, partly due to the operation of the automatic
stabilisers and partly due to spending packages provided
to stimulate growth. Between 1992-93 and 1995-96 the
ratio of underlying outlays fell slowly from its peak
level of 27.7 per cent to around 27.0 per cent of GDP.
In 1996-97 and 1997-98, sharper falls are expected,
with the ratio reaching 22.9 per cent of GDP by the
end of the forward estimates in 2000-01. This will
be the lowest level of outlays since 1973-74, when
underlying outlays were 20.5 per cent of GDP.
Chart
2. Outlays as a Proportion of GDP
Running Costs Budgets
Running costs are the recurrent and minor capital costs
incurred by a budget department or agency in providing
the government services for which it is responsible.
They include salary costs, administrative expenses,
employer superannuation costs and property operating
expenses.
Table 2 shows
the 1997-98 Budget and forward estimates of running
costs for all portfolios. In nominal terms running
costs are expected to increase by 0.8 per cent from
1996-97 to 1997-98 while in real terms they are expected
to decrease by 1.1 per cent.
Approximately $300 million is being carried forward
from 1996-97 running costs budgets into 1997-98. Based
on this and previous historical trends, a further $300
million has been included in the Contingency Reserve
for carryover of running costs from 1997-98 to 1998-99.
Staffing
Levels
Substantial restructuring is being undertaken by Commonwealth
departments and agencies in achieving Government objectives
and ensuring efficient operations. No staffing targets
have been set by the Government. Relevant portfolios
are expected to address staffing levels in the context
of resources made available under running costs arrangements.
Consistent with practice in past years, Table
2 in this section and Table
XIIa in the Statistical Appendix include estimates
provided by each portfolio on average staffing levels.
The total average staffing level (ASL) in running
costs agencies is forecast to decline by 4,285 in 1997-98
as compared to 1996-97. ASL is projected to decline
to some extent in most portfolios. The anticipated
increase in ASL in the Social Security portfolio largely
reflects and is offset by the transfer of staff from
the Department of Employment, Education, Training and
Youth Affairs to the new Commonwealth Services Delivery
Agency, which commences operation on 1 July 1997.
ASL is the average number of employees receiving salary
or wages over the financial year, with adjustments
for casual and part-time employees to show the full-time
equivalent. This measure of employment allows for
comparison between average employment in particular
financial years, rather than reflecting the actual
number of staff being employed at the end of successive
financial years or at other specific points in time.
ASL figures are the most relevant for funding purposes,
but do not indicate the change in total staff numbers
from the end of one financial year to the next in the
Australian Public Service. Movements in ASL as compared
to point-in-time figures may vary significantly due
to differences in the coverage of the two series (especially
in the Department of Administrative Services) and from
the partial ASL effect of staffing changes occurring
during the financial year.
Based on point-in-time figures provided by Public Service
Act agencies to the Public Service and Merit Protection
Commission, it is expected that the total number of
people employed (full-time and part-time permanent
and temporary staff) under the Public Service Act will
decline by some 16,500 between 30 June 1997 and 30
June 1998. This compares to a reduction of 11,200
now expected by Public Service Act agencies to occur
between 30 June 1996 and 30 June 1997; in last year's
Budget papers, portfolios predicted a reduction of
10,500 staff over the same period.
The expected reduction of staff numbers in the APS
in the year to 30 June 1998 reflects the Government's
public sector reforms, such as the sales of businesses
in the Department of Administrative Services and the
transfer of the employment placement function out of
the APS to the Public Employment Placement Enterprise
(PEPE) and to private sector providers. PEPE will
be a wholly-owned Commonwealth company with staff employed
outside the Public Service Act.
Table
2. Total Running Costs Budgets by Portfolio
-
|
- 1996-97
|
- 1997-98
|
-
|
- 1998-99
|
- 1999-00
|
- 2000-01
|
-
|
- Estimate
|
- Budget
|
- Change
|
- Estimate
|
- Estimate
|
- Estimate
|
-
|
- $m
|
- $m
|
- %
|
- $m
|
- $m
|
- $m
|
- Parliament
|
- 123.3
|
- 133.3
|
- 8.1
|
- 128.4
|
- 128.7
|
- 129.0
|
- Attorney-General's
|
- 692.1
|
- 709.4
|
- 2.5
|
- 672.8
|
- 680.5
|
- 678.7
|
- Communications and the Arts
|
- 110.0
|
- 110.1
|
- 0.1
|
- 104.5
|
- 105.0
|
- 105.8
|
- Defence
|
- 5516.2
|
- 5648.3
|
- 2.4
|
- 5613.5
|
- 5578.1
|
- 5696.5
|
- Veterans' Affairs
|
- 239.9
|
- 221.9
|
- -7.5
|
- 209.8
|
- 204.6
|
- 205.2
|
- Employment, Education, Training and Youth Affairs
|
- 955.1
|
- 757.2
|
- -20.7
|
- 360.0
|
- 325.6
|
- 331.4
|
- Environment, Sport and Territories
|
- 272.0
|
- 276.5
|
- 1.7
|
- 264.6
|
- 252.3
|
- 248.5
|
- Finance
|
- 166.4
|
- 170.1
|
- 2.2
|
- 157.7
|
- 154.6
|
- 151.5
|
- Administrative Services
|
- 237.9
|
- 246.7
|
- 3.7
|
- 222.1
|
- 216.5
|
- 217.8
|
- Foreign Affairs and Trade
|
- 516.8
|
- 599.8
|
- 16.1
|
- 496.1
|
- 500.1
|
- 504.7
|
- Health and Family Services
|
- 291.9
|
- 305.4
|
- 4.6
|
- 285.9
|
- 263.4
|
- 269.9
|
- Immigration and Multicultural Affairs
|
- 352.4
|
- 374.2
|
- 6.2
|
- 357.0
|
- 354.7
|
- 365.6
|
- Industrial Relations
|
- 104.9
|
- 109.8
|
- 4.7
|
- 107.2
|
- 107.8
|
- 108.5
|
- Industry, Science and Tourism
|
- 511.7
|
- 517.4
|
- 1.1
|
- 498.1
|
- 495.2
|
- 494.4
|
- Primary Industries and Energy
|
- 213.0
|
- 182.9
|
- -14.1
|
- 173.3
|
- 168.8
|
- 168.4
|
- Prime Minister and Cabinet
|
- 92.7
|
- 92.1
|
- -0.6
|
- 82.0
|
- 81.8
|
- 82.3
|
- Social Security
|
- 1443.0
|
- 1794.2
|
- 24.3
|
- 1606.3
|
- 1490.1
|
- 1487.2
|
- Transport and Regional Development
|
- 93.1
|
- 79.0
|
- -15.1
|
- 76.7
|
- 76.0
|
- 76.9
|
- Treasury
|
- 1713.7
|
- 1683.2
|
- -1.8
|
- 1573.2
|
- 1562.4
|
- 1627.6
|
- Contingency Reserve (Allowance for Net carryover/borrowings)
|
- -50.0
|
- -300.0
|
- na
|
- na
|
- na
|
- na
|
- TOTAL
|
- 13596.1
|
- 13711.5
|
- 0.8
|
- 12989.3
|
- 12746.1
|
- 12949.8
|
- TOTAL (excluding Contingency Reserve)
|
- 13646.1
|
- 14011.5
|
- 2.7
|
- 12989.3
|
- 12746.1
|
- 12949.8
|
- Portfolio ASL (a)
|
- 176527
|
- 172242
|
- -2.4
|
- na
|
- na
|
- na
|
- (a) ASL figures are as provided by portfolios.
PART II: FUNCTION
OUTLAYS
1. General Public
Services
This category covers outlays on a number of general
public services and activities concerned with the organisation
and operation of government. General Public Services
is an aggregate of six functions: legislative and executive
affairs; financial and fiscal affairs; foreign economic
aid, general research; general services; and government
superannuation benefits.
1A. Legislative
and Executive Affairs
Nature
of Outlays
Outlays cover services provided by the Parliamentary
Departments (the Senate, House of Representatives,
Parliamentary Library, Parliamentary Reporting Staff
and Joint House), the Australian Electoral Commission
(AEC), and Ministerial and Parliamentary Services.
This function includes outlays of the following portfolios:
- Administrative Services;
- Attorney-General's; and
- Prime Minister and Cabinet.
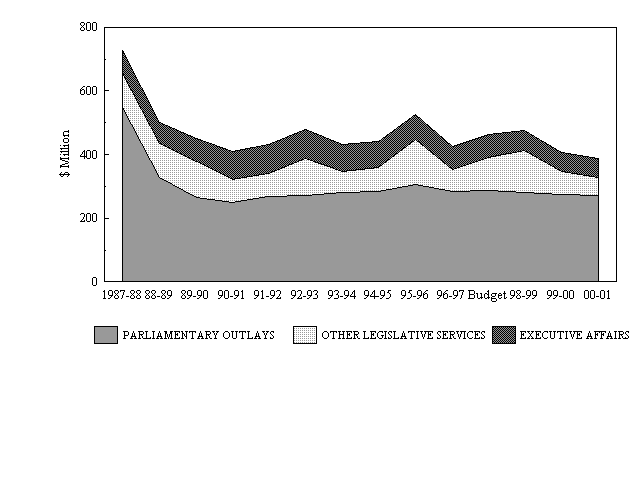
Chart 1. Overview of Commonwealth Outlays on
Legislative
and Executive Affairs
(1989-90 prices)
Trends
in Legislative and Executive Affairs Outlays
Trends over the period to 1987-88 were dominated by
outlays toward completion of the new Parliament House,
which was occupied in 1988. Subsequently, parliamentary
outlays have stabilised to reflect ongoing running
costs, capital and provision of remuneration and services
to Members and Senators.
The Other Legislative Services trend reflects the impact
on outlays of Federal elections. The 1997-98 Budget
figure includes funding for the election of delegates
to the Constitutional Convention. Provision for the
next election is included in the Forward Estimates
in 1998-99.
Commonwealth outlays on Executive Affairs remain largely
stable after 1997-98 at a level which reflects the
ongoing impact of the Prime Minister and Cabinet portfolio
savings announced in last year's Budget. The higher
level of outlays in 1997-98 compared to the forward
years is the result of one-off funding in 1997-98
for the Constitutional Convention and carryovers from
1996-97 into 1997-98.
1997-98
and Forward Estimates
-
|
-
|
-
|
- 1996-97
|
- 1997-98
|
- 1998-99
|
- 1999-00
|
- 2000-01
|
-
|
-
|
-
|
- Estimate
|
- Budget
|
- Estimate
|
- Estimate
|
- Estimate
|
- 1A.1
|
- Parliamentary Outlays
|
- $m
|
- 328.2
|
- 340.5
|
- 338.0
|
- 340.8
|
- 343.7
|
-
|
-
|
- %
|
-
|
- 3.7
|
- -0.7
|
- 0.8
|
- 0.9
|
- 1A.2
|
- Other Legislative Services
|
- $m
|
- 81.5
|
- 121.6
|
- 162.8
|
- 87.8
|
- 74.1
|
-
|
-
|
- %
|
-
|
- 49.2
|
- 33.9
|
- -46.1
|
- -15.6
|
- 1A.3
|
- Executive Affairs
|
- $m
|
- 82.8
|
- 86.8
|
- 75.9
|
- 75.8
|
- 76.4
|
-
|
-
|
- %
|
-
|
- 4.8
|
- -12.6
|
- -0.1
|
- 0.8
|
-
|
- TOTAL
|
- $m
|
- 492.5
|
- 548.9
|
- 576.6
|
- 504.4
|
- 494.1
|
-
|
-
|
- %
|
-
|
- 11.5
|
- 5.0
|
- -12.5
|
- -2.0
|
1A.1 Parliamentary
Outlays
Parliamentary outlays cover services to Senators and
Members by the Parliamentary Departments and the Department
of Administrative Services. These include: Hansard;
advisory, procedural, research and administrative support;
library; communications support; building and facilities
management; Members' and Ministers' staff salaries;
electorate office costs; and travel within Australia
and overseas. The costs of superannuation benefits
for Senators and Members of Parliament appear in 1F.2
Civilian Schemes.
1A.2 Other
Legislative Services
Other Legislative Services covers the funding of elections,
the cost of the AEC and drafting of Bills by the Office
of Parliamentary Counsel, within the Attorney-General's
portfolio.
1A.3 Executive
Affairs
The Executive Affairs subfunction covers the running
costs and other outlays of the Department of the Prime
Minister and Cabinet (including support services for
former Governors-General and the Prime Minister's
official residences), the Office of the Commonwealth
and Defence Force Ombudsman, the Office of the Official
Secretary to the Governor-General, and the Public Service
and Merit Protection Commission.
1B. Financial
and Fiscal Affairs
Nature
of Outlays
This function includes outlays on administrative processes
of government covering tasks such as collecting taxes,
collecting and reporting statistical information, raising
and managing the public debt of the Commonwealth, overseeing
disbursement and efficient use of public funds, auditing
Commonwealth entities, supervising insurance and superannuation,
and providing economic, financial and other policy
advice to government.
This function includes outlays of the following portfolios:
- Treasury;
- Finance; and
- Industry, Science and Tourism.
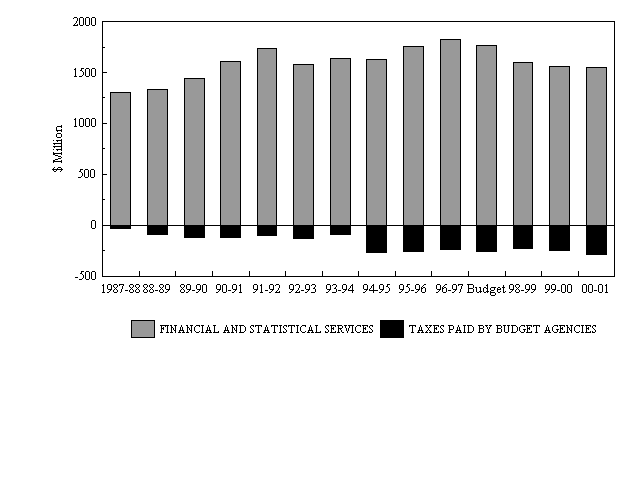
Chart 1. Overview of Commonwealth Outlays on
Financial
and Fiscal Affairs
(1989-90 prices)
Trends
in Financial and Fiscal Affairs Outlays
Significant policy changes for the function in the
period to 1996-97 were:
- a strengthening of the Australian Taxation Office (ATO)
resource base, including introduction of the Tax File
Number System from 1988-89, modernisation of systems
commencing 1989-90, compliance enforcement from 1993-94,
and debt management activities from 1994-95;
- additional funding for the Insurance and Superannuation
Commission (ISC) for audit of superannuation funds
and improved enquiry services from 1991-92, as well
as enhanced capacity for superannuation and insurance
supervision from 1992-93; and
- taxes paid rose with the introduction from 1987-88
of Fringe Benefits Tax (FBT) and from 1990-91 of customs
duty payable by Commonwealth departments and budget
sector agencies. FBT payments increased significantly
from 1994-95 as a result of legislation which effectively
increased the FBT liability of departments and budget
sector agencies from 48.25 per cent to around 93 per
cent; the departments and agencies are tax exempt employers
and therefore not eligible for tax deductions for any
FBT costs.
Outlays show a moderate decline over the period of
the forward estimates mainly due to the following items:
- a peak in outlays for the Australian Bureau of Statistics
(ABS) in 1996-97 reflecting the 1996 Census of Population
and Housing offset in part by significant census outlays
expected in 2000-01;
- a winding down in the ATO's Modernisation Project;
and
- higher receipts of FBT payments by Commonwealth departments
and budget sector agencies (reducing outlays).
1997-98
and Forward Estimates
-
|
-
|
-
|
- 1996-97
|
- 1997-98
|
- 1998-99
|
- 1999-00
|
- 2000-01
|
-
|
-
|
-
|
- Estimate
|
- Budget
|
- Estimate
|
- Estimate
|
- Estimate
|
- 1B.1
|
- Financial and Statistical Services
|
- $m
|
- 2111.3
|
- 2081.1
|
- 1940.0
|
- 1929.6
|
- 1974.1
|
-
|
-
|
- %
|
-
|
- -1.4
|
- -6.8
|
- -0.5
|
- 2.3
|
- 1B.2
|
- Taxes Paid by Budget Agencies
|
- $m
|
- -282.2
|
- -301.8
|
- -284.1
|
- -305.3
|
- -366.1
|
-
|
-
|
- %
|
-
|
- 6.9
|
- -5.9
|
- 7.5
|
- 19.9
|
-
|
- TOTAL
|
- $m
|
- 1829.1
|
- 1779.3
|
- 1655.9
|
- 1624.3
|
- 1608.1
|
-
|
-
|
- %
|
-
|
- -2.7
|
- -6.9
|
- -1.9
|
- -1.0
|
1B.1 Financial
and Statistical Services
-
|
-
|
-
|
- 1996-97
|
- 1997-98
|
- 1998-99
|
- 1999-00
|
- 2000-01
|
-
|
-
|
-
|
- Estimate
|
- Budget
|
- Estimate
|
- Estimate
|
- Estimate
|
-
|
- Department of the Treasury
|
- $m
|
- 55.0
|
- 53.3
|
- 49.7
|
- 47.2
|
- 46.9
|
-
|
-
|
- %
|
-
|
- -3.1
|
- -6.8
|
- -5.0
|
- -0.6
|
-
|
- Australian Taxation Office
|
- $m
|
- 1260.3
|
- 1295.3
|
- 1167.8
|
- 1149.3
|
- 1173.2
|
-
|
-
|
- %
|
-
|
- 2.8
|
- -9.8
|
- -1.6
|
- 2.1
|
-
|
- Australian Bureau of Statistics
|
- $m
|
- 303.1
|
- 218.7
|
- 212.8
|
- 214.1
|
- 246.1
|
-
|
-
|
- %
|
-
|
- -27.8
|
- -2.7
|
- 0.6
|
- 14.9
|
-
|
- Department of Finance
|
- $m
|
- 88.1
|
- 93.6
|
- 90.1
|
- 86.0
|
- 81.3
|
-
|
-
|
- %
|
-
|
- 6.2
|
- -3.7
|
- -4.6
|
- -5.5
|
-
|
- Australian National Audit Office
|
- $m
|
- 33.8
|
- 38.9
|
- 35.9
|
- 36.6
|
- 37.4
|
-
|
-
|
- %
|
-
|
- 15.1
|
- -7.7
|
- 1.9
|
- 2.2
|
-
|
- Australian Customs Service
|
- $m
|
- 330.3
|
- 344.3
|
- 348.2
|
- 360.8
|
- 353.3
|
-
|
-
|
- %
|
-
|
- 4.2
|
- 1.1
|
- 3.6
|
- -2.1
|
-
|
- Insurance & Superannuation
|
- $m
|
- 40.7
|
- 37.0
|
- 35.6
|
- 35.6
|
- 35.9
|
-
|
- Commission
|
- %
|
-
|
- -9.1
|
- -3.8
|
- -
|
- 0.8
|
-
|
- TOTAL
|
- $m
|
- 2111.3
|
- 2081.1
|
- 1940.0
|
- 1929.6
|
- 1974.1
|
-
|
-
|
- %
|
-
|
- -1.4
|
- -6.8
|
- -0.5
|
- 2.3
|
Department of the Treasury is responsible for advising
and assisting the Government in the management of the
Australian economy.
Australian Taxation Office is responsible for ensuring
the collection of revenue payable under the laws administered
by the Commissioner of Taxation.
Australian Bureau of Statistics is responsible for
the collection of statistics Australia wide including
the five yearly Census of Population and Housing as
well as other cyclical surveys.
Department of Finance is responsible for promoting
efficient, effective and ethical financial management
and accountability practices within Commonwealth agencies
and value for money in the design and delivery of Commonwealth
programmes. Payments relating to Commonwealth Superannuation
Administration and the Office of Government Information
Technology are also included against this item.
Australian National Audit Office (ANAO) is responsible
for audits of Commonwealth departments and authorities.
The ANAO charges fees for audits of financial statements
of Commonwealth authorities and companies and those
fee receipts are treated as offsets within outlays.
Australian Customs Service is involved in facilitating
the movement of people and goods into and out of Australia,
the delivery of industry assistance programmes and
the collection of customs duty and excise.
Insurance and Superannuation Commission is responsible
for prudential supervision of the insurance (including
life insurance) and superannuation industries.
1B.2
Taxes Paid by Budget Agencies
-
|
-
|
-
|
- 1996-97
|
- 1997-98
|
- 1998-99
|
- 1999-00
|
- 2000-01
|
-
|
-
|
-
|
- Estimate
|
- Budget
|
- Estimate
|
- Estimate
|
- Estimate
|
-
|
- Fringe Benefits Tax
|
- $m
|
- -280.1
|
- -299.7
|
- -282.0
|
- -303.1
|
- -363.8
|
-
|
-
|
- %
|
-
|
- 7.0
|
- -5.9
|
- 7.5
|
- 20.0
|
-
|
- Customs Duty
|
- $m
|
- -2.1
|
- -2.1
|
- -2.1
|
- -2.2
|
- -2.2
|
-
|
-
|
- %
|
-
|
- -
|
- -
|
- 4.8
|
- -
|
-
|
- TOTAL
|
- $m
|
- -282.2
|
- -301.8
|
- -284.1
|
- -305.3
|
- -366.1
|
-
|
-
|
- %
|
-
|
- 6.9
|
- -5.9
|
- 7.5
|
- 19.9
|
Taxes and levies received from budget sector agencies
and classified as offsets within outlays are reported
under this subfunction whereas the payments are reported
under the functions to which the paying departments
and agencies are classified. These items, combined
with their offsets in other functions, have no net
effect on aggregate budget outlays.
1C. Foreign
Economic Aid
Nature
of Outlays
The bulk of Foreign Economic Aid outlays are counted
as Official Development Assistance. Also covered are
some outlays other than aid, including for the conduct
of foreign and international trade relations (but not
including trade promotional activities) and contributions
to the activities of international organisations such
as the United Nations (UN), including assessed contributions
to UN peacekeeping operations.
This function principally includes outlays of the following
portfolios:
- Foreign Affairs and Trade;
- Administrative Services; and
- Treasury;
with minor outlays from:
- Health and Family Services;
- Industrial Relations;
- Attorney-General's;
- Immigration and Multicultural Affairs;
- Industry, Science and Tourism; and
- Transport and Regional Development.
Chart 1. Overview of Commonwealth Outlays on
Foreign
Economic Aid
(1989-90 prices)
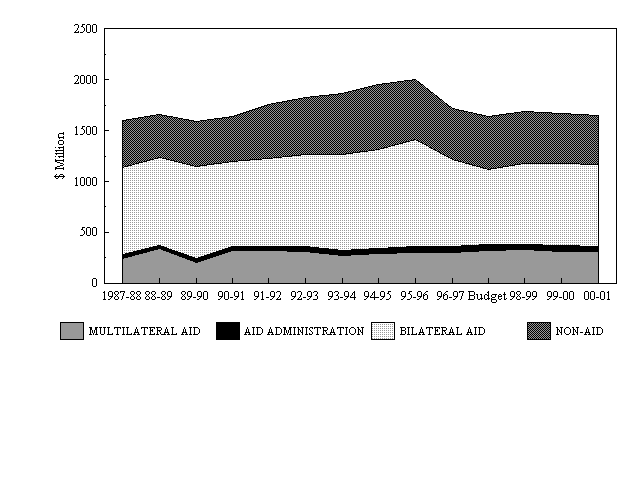
Trends
in Foreign Economic Aid Outlays
Outlays for bilateral and multilateral aid under this
function primarily reflect funding for programmes classified
as Official Development Assistance. Following implementation
of savings measures in 1987-88, one-off funding was
provided to make additional payments to International
Development Financial Institutions in 1988-89. Overall
increases in Overseas Aid outlays between 1989-90 and
1995-96 reflect decisions made to increase aid funding
in real terms. The reduction in these outlays in 1996-97
and 1997-98 reflects the abolition of the Development
Import Finance Facility, general savings measures and
repayment of a loan by the Papua New Guinea Government
in 1997-98.
Growth in Foreign Affairs Non-Aid over the period since
1987-88 has largely been influenced by Australian contributions
to UN peacekeeping operations and by property. UN peacekeeping
contributions have decreased in recent years and are
projected to remain at this lower level. The fluctuations
over the current, budget and forward years for Non-Aid
outlays primarily reflect greater than average overseas
property sales in 1996-97, carryovers in the Overseas
Property Group's medium and minor works from 1996-97,
transitional arrangements for devolving overseas property
funding from the Overseas Property Group, affecting
only 1997-98 at this stage, and the completion of major
works overseas.
1997-98
and Forward Estimates
-
|
-
|
-
|
- 1996-97
|
- 1997-98
|
- 1998-99
|
- 1999-00
|
- 2000-01
|
-
|
-
|
-
|
- Estimate
|
- Budget
|
- Estimate
|
- Estimate
|
- Estimate
|
- 1C.1
|
- Bilateral Aid
|
- $m
|
- 994.7
|
- 873.2
|
- 958.2
|
- 1000.3
|
- 1024.6
|
-
|
-
|
- %
|
-
|
- -12.2
|
- 9.7
|
- 4.4
|
- 2.4
|
- 1C.2
|
- Multilateral Aid
|
- $m
|
- 347.7
|
- 378.7
|
- 395.7
|
- 391.9
|
- 391.7
|
-
|
-
|
- %
|
-
|
- 8.9
|
- 4.5
|
- -1.0
|
- -0.1
|
- 1C.3
|
- Aid Administration
|
- $m
|
- 64.1
|
- 67.4
|
- 64.6
|
- 65.1
|
- 65.7
|
-
|
-
|
- %
|
-
|
- 5.1
|
- -4.2
|
- 0.8
|
- 0.9
|
-
|
- Sub-total - Overseas Aid
|
- $m
|
- 1406.4
|
- 1319.3
|
- 1418.4
|
- 1457.2
|
- 1482.0
|
-
|
-
|
- %
|
-
|
- -6.2
|
- 7.5
|
- 2.7
|
- 1.7
|
- 1C.4
|
- Foreign Affairs Non-Aid
|
- $m
|
- 575.2
|
- 615.8
|
- 625.6
|
- 610.5
|
- 618.8
|
-
|
-
|
- %
|
-
|
- 7.1
|
- 1.6
|
- -2.4
|
- 1.4
|
-
|
- TOTAL
|
- $m
|
- 1981.7
|
- 1935.1
|
- 2044.0
|
- 2067.7
|
- 2100.8
|
-
|
-
|
- %
|
-
|
- -2.4
|
- 5.6
|
- 1.2
|
- 1.6
|
1C.1 Bilateral
Aid
-
|
-
|
-
|
- 1996-97
|
- 1997-98
|
- 1998-99
|
- 1999-00
|
- 2000-01
|
-
|
-
|
-
|
- Estimate
|
- Budget
|
- Estimate
|
- Estimate
|
- Estimate
|
-
|
- Papua New Guinea - Budget Support
|
- $m
|
- 142.2
|
- 37.2
|
- 71.0
|
- 35.5
|
- -
|
-
|
-
|
- %
|
-
|
- -73.8
|
- 90.9
|
- -50.0
|
- -100.0
|
-
|
- Projects, Technical Cooperation and Related Activities
|
- $m
|
- 533.1
|
- 525.7
|
- 569.6
|
- 626.3
|
- 674.3
|
-
|
-
|
- %
|
-
|
- -1.4
|
- 8.4
|
- 10.0
|
- 7.7
|
-
|
- Training
|
- $m
|
- 156.3
|
- 156.8
|
- 159.4
|
- 168.9
|
- 176.5
|
-
|
-
|
- %
|
-
|
- 0.3
|
- 1.7
|
- 6.0
|
- 4.5
|
-
|
- Emergency Aid
|
- $m
|
- 11.2
|
- 11.2
|
- 11.4
|
- 13.7
|
- 14.1
|
-
|
-
|
- %
|
-
|
- -
|
- 1.8
|
- 20.2
|
- 2.9
|
-
|
- Refugee Relief
|
- $m
|
- 70.3
|
- 70.0
|
- 71.8
|
- 77.6
|
- 79.5
|
-
|
-
|
- %
|
-
|
- -0.4
|
- 2.6
|
- 8.1
|
- 2.4
|
-
|
- Non-government Organisations
|
- $m
|
- 30.1
|
- 32.1
|
- 33.7
|
- 36.1
|
- 37.0
|
-
|
-
|
- %
|
-
|
- 6.6
|
- 5.0
|
- 7.1
|
- 2.5
|
-
|
- Development Import Finance Facility
|
- $m
|
- 11.8
|
- -
|
- -
|
- -
|
- -
|
-
|
-
|
- %
|
-
|
- -100.0
|
- na
|
- na
|
- na
|
-
|
- Australian Centre for International Agricultural Research
|
- $m
|
- 39.7
|
- 40.1
|
- 41.1
|
- 42.2
|
- 43.2
|
-
|
-
|
- %
|
-
|
- 1.0
|
- 2.5
|
- 2.7
|
- 2.4
|
-
|
- TOTAL
|
- $m
|
- 994.7
|
- 873.2
|
- 958.2
|
- 1000.3
|
- 1024.6
|
-
|
-
|
- %
|
-
|
- -12.2
|
- 9.7
|
- 4.4
|
- 2.4
|
Bilateral Aid supports development assistance programmes
provided to specific countries, such as technical and
other training, education, health and other humanitarian
programmes. The principal recipients of Australia's
bilateral aid are countries in the Asia-Pacific region,
with Papua New Guinea being the largest.
Papua New Guinea - Budget Support
Under the Papua New Guinea-Australia Treaty on Development
Cooperation, Budget Support is being phased out and
substituted with programmed aid. In 1997-98, the loan
made to Papua New Guinea in 1995-96 to help fill the
External Financing Gap is to be repaid.
Development Import Finance Facility
The Development Import Finance Facility was abolished
in the 1996-97 Budget.
1C.2 Multilateral
Aid
-
|
-
|
-
|
- 1996-97
|
- 1997-98
|
- 1998-99
|
- 1999-00
|
- 2000-01
|
-
|
-
|
-
|
- Estimate
|
- Budget
|
- Estimate
|
- Estimate
|
- Estimate
|
-
|
- International Development Financial Institutions
|
- $m
|
- 218.7
|
- 246.4
|
- 261.5
|
- 245.1
|
- 239.6
|
-
|
-
|
- %
|
-
|
- 12.7
|
- 6.1
|
- -6.3
|
- -2.2
|
-
|
- United Nations Organisations
|
- $m
|
- 74.7
|
- 67.5
|
- 69.1
|
- 74.9
|
- 76.7
|
-
|
-
|
- %
|
-
|
- -9.6
|
- 2.4
|
- 8.4
|
- 2.4
|
-
|
- Commonwealth Organisations
|
- $m
|
- 8.8
|
- 8.8
|
- 9.0
|
- 10.2
|
- 10.5
|
-
|
-
|
- %
|
-
|
- -
|
- 2.3
|
- 13.3
|
- 2.9
|
-
|
- Other International Organisations
|
- $m
|
- 16.3
|
- 23.3
|
- 20.5
|
- 22.4
|
- 22.2
|
-
|
-
|
- %
|
-
|
- 42.9
|
- -12.0
|
- 9.3
|
- -0.9
|
-
|
- Regional Organisations
|
- $m
|
- 29.1
|
- 32.7
|
- 35.5
|
- 39.2
|
- 42.8
|
-
|
-
|
- %
|
-
|
- 12.4
|
- 8.6
|
- 10.4
|
- 9.2
|
-
|
- TOTAL
|
- $m
|
- 347.7
|
- 378.7
|
- 395.7
|
- 391.9
|
- 391.7
|
-
|
-
|
- %
|
-
|
- 8.9
|
- 4.5
|
- -1.0
|
- -0.1
|
Multilateral aid outlays encompass contributions to
economic development funds administered by international,
regional or other multinational organisations including
the World Bank, the Asian Development Bank, the European
Bank for Reconstruction and Development, the International
Fund for Agricultural Development, and the International
Monetary Fund's Enhanced Structural Adjustment Facility.
1C.3 Aid
Administration
Aid Administration outlays provide for the administrative
costs of the Australian aid programme, including the
operational costs of AusAID.
1C.4 Foreign
Affairs Non-Aid
-
|
-
|
-
|
- 1996-97
|
- 1997-98
|
- 1998-99
|
- 1999-00
|
- 2000-01
|
-
|
-
|
-
|
- Estimate
|
- Budget
|
- Estimate
|
- Estimate
|
- Estimate
|
-
|
- Membership of International Organisations
|
- $m
|
- 68.9
|
- 79.8
|
- 77.3
|
- 75.8
|
- 75.8
|
-
|
-
|
- %
|
-
|
- 15.8
|
- -3.1
|
- -1.9
|
- -
|
-
|
- United Nations Peacekeeping Operations
|
- $m
|
- 35.7
|
- 40.0
|
- 40.0
|
- 40.0
|
- 40.0
|
-
|
-
|
- %
|
-
|
- 12.0
|
- -
|
- -
|
- -
|
-
|
- Other Activities
|
- $m
|
- 9.1
|
- 8.8
|
- 8.5
|
- 8.5
|
- 8.6
|
-
|
-
|
- %
|
-
|
- -3.3
|
- -3.4
|
- -
|
- 1.2
|
-
|
- General Administration
|
- $m
|
- 461.5
|
- 487.2
|
- 499.8
|
- 486.1
|
- 494.4
|
-
|
-
|
- %
|
-
|
- 5.6
|
- 2.6
|
- -2.7
|
- 1.7
|
-
|
- TOTAL
|
- $m
|
- 575.2
|
- 615.8
|
- 625.6
|
- 610.5
|
- 618.8
|
-
|
-
|
- %
|
-
|
- 7.1
|
- 1.6
|
- -2.4
|
- 1.4
|
Foreign Affairs Non-Aid outlays cover the promotion
of Australia's interests through diplomatic relations
with other countries, both bilaterally and through
our participation in, and contributions to, international
organisations and forums including UN peacekeeping
operations.
Because of the nature of the events covered, the contributions
for UN Peacekeeping activities are uneven and not easy
to predict. The forward years, therefore, reflect a
provision based on previous experience.
General administration outlays include the major part
of the Department of Foreign Affairs and Trade administration
costs (other than a small proportion of the Department's
costs which relate to 3.
Public Order and Safety) and the administrative
costs of the Department of Administrative Services'
Overseas Property Group.
1D. General
Research
Nature
of Outlays
Outlays under General Research fund research directed
towards the increase in scientific knowledge and its
application. Outlays provide funding for the Commonwealth
research agencies, elements of the national research
infrastructure and general research programmes. Programmes
supporting research in specific sectors are generally
included under the relevant function, e.g. health research
is included in 5.
Health.
The research agencies, the Commonwealth Scientific
and Industrial Research Organisation (CSIRO), the Australian
Nuclear Science and Technology Organisation (ANSTO)
and the Australian Institute of Marine Science (AIMS)
receive most of their funding directly from the Budget.
Additional research funding is received from the private
sector and from a variety of Commonwealth assisted
grant schemes.
Australia maintains several Antarctic research stations
and supports associated research through the Antarctic
Division of the Department of the Environment, Sport
and Territories (DEST).
Commonwealth grants are provided for higher education
research on the advice of the Australian Research Council
(ARC) and through the Cooperative Research Centres
(CRC) Programme to supplement contributions from CRC
partner organisations.
This function includes outlays of the following portfolios:
- Industry, Science and Tourism;
- Employment, Education, Training and Youth Affairs;
- Environment, Sport and Territories;
- Communications and the Arts; and
- Administrative Services.
Chart 1. Overview of Commonwealth Outlays on
General
Research
(1989-90 prices)
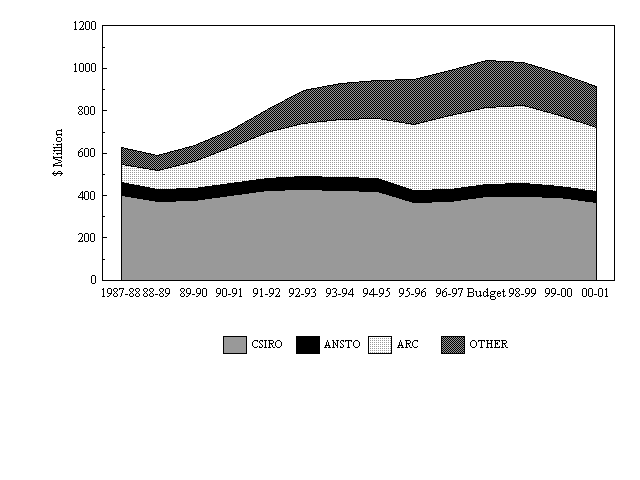
Trends
in General Research Outlays
The growth in outlays from 1988-89 reflects a significant
real increase in funding for the ARC, the provision
of $30 million of equity to the Australian Technology
Group in 1992-93, and the establishment of the CRC
and Major National Research Facilities programmes.
Outlays are expected to decline, in real terms, over
1997-98 to 2000-01 due to a reduction in ARC funding
and the phase down of some programmes in the 'Other'
category.
1997-98
and Forward Estimates
-
|
-
|
-
|
- 1996-97
|
- 1997-98
|
- 1998-99
|
- 1999-00
|
- 2000-01
|
-
|
-
|
-
|
- Estimate
|
- Budget
|
- Estimate
|
- Estimate
|
- Estimate
|
- 1D.1
|
- Commonwealth Scientific and Industrial Research Organisation
|
- $m
|
- 433.1
|
- 466.8
|
- 480.7
|
- 484.1
|
- 465.3
|
-
|
-
|
- %
|
-
|
- 7.8
|
- 3.0
|
- 0.7
|
- -3.9
|
- 1D.2
|
- Australian Nuclear Science and Technology Organisation
|
- $m
|
- 63.7
|
- 70.4
|
- 74.6
|
- 67.8
|
- 68.3
|
-
|
-
|
- %
|
-
|
- 10.5
|
- 6.0
|
- -9.1
|
- 0.7
|
- 1D.3
|
- Australian Research Council
|
- $m
|
- 401.2
|
- 429.2
|
- 445.3
|
- 410.9
|
- 381.2
|
-
|
-
|
- %
|
-
|
- 7.0
|
- 3.8
|
- -7.7
|
- -7.2
|
- 1D.4
|
- Other General Research, nec
|
- $m
|
- 251.0
|
- 260.8
|
- 245.4
|
- 247.2
|
- 247.0
|
-
|
-
|
- %
|
-
|
- 3.9
|
- -5.9
|
- 0.7
|
- -0.1
|
-
|
- TOTAL
|
- $m
|
- 1148.9
|
- 1227.2
|
- 1246.0
|
- 1209.9
|
- 1161.8
|
-
|
-
|
- %
|
-
|
- 6.8
|
- 1.5
|
- -2.9
|
- -4.0
|
1D.1 Commonwealth
Scientific and Industrial Research Organisation
The Commonwealth Scientific and Industrial Research
Organisation (CSIRO), an independent statutory authority,
is Australia's largest and most diverse scientific
research organisation. Its primary role is to undertake
scientific research which is of direct value to the
community and industry generally. CSIRO has strong
international links and maintains a substantial part
of the national research infrastructure, including
biological collections and some major national research
facilities such as the Australia Telescope, the Australian
Animal Health Laboratory, the National Measurement
Laboratory and the Research Vessel Franklin. CSIRO
contributes to Government policy formulation through
the provision of expert advice on scientific and technological
issues.
1D.2 Australian
Nuclear Science and Technology Organisation
The Australian Nuclear Science and Technology Organisation
(ANSTO) is Australia's major centre of nuclear science
research and development. It contributes to the development
of nuclear science and technology and its application
in industries which include health, mining, environment
and advanced materials. ANSTO also assists with the
development of Australia's nuclear non-proliferation
safeguards and wider technology policies and interests.
1D.3 Australian
Research Council
The Australian Research Council (ARC) advises the Government
on national research priorities and the coordination
of research policy. It also makes recommendations to
the Minister for Employment, Education, Training and
Youth Affairs on the allocation of Commonwealth funding
in a range of research schemes, including postgraduate
scholarships, fellowships, research centres, and infrastructure
and research grants to higher education institutions.
The Government has foreshadowed a restructuring of
the ARC with a wider range of functions including responsibility
for allocating competitive research grants, liaising
with industry, promoting the role and importance of
research within the broader community and developing
closer links between the universities, public research
organisations and the private sector.
1D.4 Other
General Research, NEC
-
|
-
|
-
|
- 1996-97
|
- 1997-98
|
- 1998-99
|
- 1999-00
|
- 2000-01
|
-
|
-
|
-
|
- Estimate
|
- Budget
|
- Estimate
|
- Estimate
|
- Estimate
|
-
|
- Policy, Coordination and Promotion
|
- $m
|
- 7.8
|
- 6.5
|
- 6.5
|
- 6.6
|
- 6.7
|
-
|
-
|
- %
|
-
|
- -16.7
|
- -
|
- 1.5
|
- 1.5
|
-
|
- Cooperative Research Centres
|
- $m
|
- 141.9
|
- 146.2
|
- 138.1
|
- 140.6
|
- 145.8
|
-
|
-
|
- %
|
-
|
- 3.0
|
- -5.5
|
- 1.8
|
- 3.7
|
-
|
- Antarctic Division
|
- $m
|
- 60.1
|
- 61.0
|
- 61.3
|
- 63.7
|
- 62.4
|
-
|
-
|
- %
|
-
|
- 1.5
|
- 0.5
|
- 3.9
|
- -2.0
|
-
|
- Australian Institute of Marine Science
|
- $m
|
- 16.4
|
- 16.4
|
- 16.8
|
- 16.8
|
- 17.0
|
-
|
-
|
- %
|
-
|
- -
|
- 2.4
|
- -
|
- 1.2
|
-
|
- International and Other Research
|
- $m
|
- 24.8
|
- 30.8
|
- 22.7
|
- 19.4
|
- 15.1
|
-
|
-
|
- %
|
-
|
- 24.2
|
- -26.3
|
- -14.5
|
- -22.2
|
-
|
- TOTAL
|
- $m
|
- 251.0
|
- 260.8
|
- 245.4
|
- 247.2
|
- 247.0
|
-
|
-
|
- %
|
-
|
- 3.9
|
- -5.9
|
- 0.7
|
- -0.1
|
Cooperative Research Centres
The Cooperative Research Centres (CRC) Programme provides
support for long-term collaborative research ventures
between universities, public research organisations,
Government agencies and private enterprises. It aims
to promote high quality research, strengthen links
between research and its commercial and other applications,
and provide a training ground for Australia's future
researchers.
Antarctic Division
The Antarctic Division (of the Department of the Environment,
Sport and Territories) maintains an Australian presence
at three stations on the Antarctic continent and one
on Macquarie Island. The Division's main research effort
is directed at building up a systematic knowledge of
the Antarctic and its environment, and understanding
the role that this region has in relation to global
climate change.
Australian Institute of Marine Science
The Australian Institute of Marine Science (AIMS) undertakes
research directed towards improving the understanding
of the marine environment in the coastal and continental
shelf regions of Australia and assists with the development,
conservation and management of marine resources including
the environmental sustainability of offshore resource
industries and of Great Barrier Reef management plans.
International and Other Research
The significant programmes in this subgroup include:
the Major National Research Facilities Programme; the
International Science and Technology Cooperation Programme;
the Anglo-Australian Telescope; and the Department
of Administrative Services' Centre for Environmental
Management.
1E. General
Services
Nature
of Outlays
This function covers outlays relating to overall economic,
social planning, statistical and general services not
connected with a specific function. It includes the
administrative processes of government not classified
elsewhere including the provision of real property,
centralised employee compensation and business services
to government departments and agencies.
This function includes outlays of the following portfolios:
- Administrative Services;
- Industrial Relations;
- Environment, Sport and Territories; and
- Attorney-General's.
Chart 1. Overview of Commonwealth Outlays on
General
Services
(1989-90 prices)
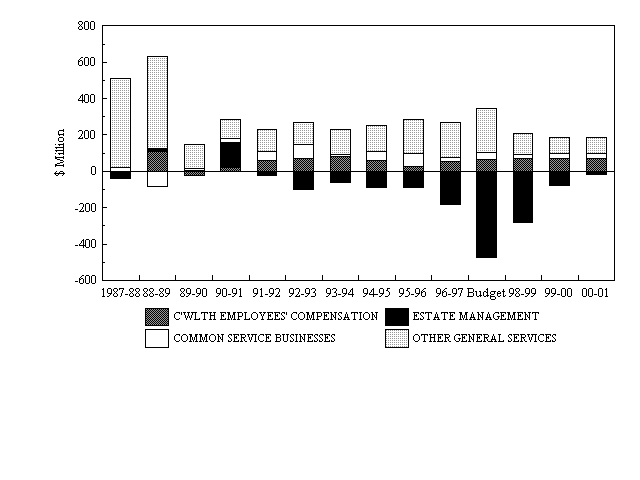
Trends
in General Services Outlays
Variations in outlays in the subfunction reflect the
following significant policy changes:
- the progressive introduction from 1987-88 of commercialisation
in the delivery of common services by the Department
of Administrative Services (DAS);
- ACT self-government in May 1989;
- the introduction of revised arrangements for funding
Commonwealth employees' compensation, including the
payment of premiums by agencies from 1989-90;
- the introduction, from 1989-90, of rent payments by
agencies which occupy Commonwealth owned real estate;
- the effect of property sales from 1996-97; and
- the rationalisation of DAS common service businesses
in 1996-97.
Outlays on Estate Management include funding for new
property developments, receipts from the sale of property
and rent received on the existing estate. The net outlays
pattern from 1988 through to 1991 reflects outlays
on major development projects in Sydney and Melbourne.
Expected outlays for 1997 to 1999 reflect expected
receipts from property sales. These will in turn result
in a reduction in rent receipts by the end of the decade.
1997-98
and Forward Estimates
-
|
-
|
-
|
- 1996-97
|
- 1997-98
|
- 1998-99
|
- 1999-00
|
- 2000-01
|
-
|
-
|
-
|
- Estimate
|
- Budget
|
- Estimate
|
- Estimate
|
- Estimate
|
- 1E.1
|
- Commonwealth Employees' Compensation
|
- $m
|
- 64.6
|
- 77.1
|
- 82.6
|
- 85.0
|
- 88.8
|
-
|
-
|
- %
|
-
|
- 19.3
|
- 7.1
|
- 2.9
|
- 4.5
|
- 1E.2
|
- Estate Management
|
- $m
|
- -213.4
|
- -559.3
|
- -343.8
|
- -94.2
|
- -26.3
|
-
|
-
|
- %
|
-
|
- 162.1
|
- -38.5
|
- -72.6
|
- -72.1
|
- 1E.3
|
- Common Service Businesses
|
- $m
|
- 22.2
|
- 43.3
|
- 29.0
|
- 36.7
|
- 38.3
|
-
|
-
|
- %
|
-
|
- 95.0
|
- -33.0
|
- 26.6
|
- 4.4
|
- 1E.4
|
- Other General Services
|
- $m
|
- 221.9
|
- 289.4
|
- 140.2
|
- 111.2
|
- 112.4
|
-
|
-
|
- %
|
-
|
- 30.4
|
- -51.6
|
- -20.7
|
- 1.1
|
-
|
- TOTAL
|
- $m
|
- 95.4
|
- -149.5
|
- -92.1
|
- 138.7
|
- 213.2
|
-
|
-
|
- %
|
-
|
- na
|
- -38.4
|
- na
|
- 53.7
|
1E.1 Commonwealth
Employees' Compensation
Comcare Australia (Comcare) collects annual premiums
which are paid into the Consolidated Revenue Fund.
Agency premiums for any one year reflect the full cost
of all compensation liabilities expected to be incurred
in that premium year and for the full life of each
claim. Agency premiums include a component for the
administrative costs of Comcare.
Premium rates for 1997-98 will be decided by the Safety,
Rehabilitation and Compensation Commission in June
1997. The downward trend experienced from 1995-96 to
1996-97 is expected to continue, largely due to claims
frequency continuing to decrease whilst the average
cost of claims appears to be stabilising.
1E.2
Estate Management
This covers management by DAS of the Commonwealth's
ownership of real property for non-defence purposes.
The Government has agreed on a set of Commonwealth
Property Principles which will have the effect of restricting
Commonwealth ownership of property to cases where there
are strong public interest or financial reasons for
ownership. As a result, major sales are forecast for
the budget and later years. No new developments are
planned, although some properties may be refurbished.
The Government has outsourced the management of its
office estate, reflecting the trend to outsource activities
which are not core functions of government.
1E.3
Common Service Businesses
-
|
-
|
-
|
- 1996-97
|
- 1997-98
|
- 1998-99
|
- 1999-00
|
- 2000-01
|
-
|
-
|
-
|
- Estimate
|
- Budget
|
- Estimate
|
- Estimate
|
- Estimate
|
-
|
- Australian Government Publishing Service
|
- $m
|
- 13.1
|
- 6.8
|
- 7.0
|
- 7.0
|
- 8.5
|
-
|
-
|
- %
|
-
|
- -48.1
|
- 2.9
|
- -
|
- 21.4
|
-
|
- Australian Property Group (a)
|
- $m
|
- 1.3
|
- 2.3
|
- -
|
- -
|
- -
|
-
|
-
|
- %
|
-
|
- 76.9
|
- -100.0
|
- na
|
- na
|
-
|
- DAS Distribution (a)
|
- $m
|
- 0.6
|
- -
|
- -
|
- -
|
- -
|
-
|
-
|
- %
|
-
|
- -100.0
|
- na
|
- na
|
- na
|
-
|
- DAS Removals
|
- $m
|
- -3.3
|
- -1.2
|
- -3.4
|
- -4.0
|
- -4.0
|
-
|
-
|
- %
|
-
|
- -63.6
|
- 183.3
|
- 17.6
|
- -
|
-
|
- DASFLEET (b)
|
- $m
|
- -55.6
|
- -1.5
|
- -3.7
|
- 5.2
|
- 5.2
|
-
|
-
|
- %
|
-
|
- -97.3
|
- 146.7
|
- -240.5
|
- -
|
-
|
- DAS Interiors (a)
|
- $m
|
- 0.8
|
- -
|
- -
|
- -
|
- -
|
-
|
-
|
- %
|
-
|
- -100.0
|
- na
|
- na
|
- na
|
-
|
- Works Australia (a)
|
- $m
|
- -
|
- -
|
- -
|
- -
|
- -
|
-
|
-
|
- %
|
-
|
- na
|
- na
|
- na
|
- na
|
-
|
- Asset Services (a)
|
- $m
|
- 14.3
|
- 2.0
|
- -
|
- -
|
- -
|
-
|
-
|
- %
|
-
|
- -86.0
|
- -100.0
|
- na
|
- na
|
-
|
- Australian Surveying and Land Information Group
|
- $m
|
- 23.7
|
- 25.0
|
- 25.9
|
- 25.4
|
- 25.4
|
-
|
-
|
- %
|
-
|
- 5.5
|
- 3.6
|
- -1.9
|
- -
|
-
|
- Australian Valuation Office
|
- $m
|
- -2.2
|
- 0.1
|
- -1.6
|
- -1.6
|
- -1.6
|
-
|
-
|
- %
|
-
|
- -104.5
|
- na
|
- -
|
- -
|
-
|
- COMCAR
|
- $m
|
- 2.7
|
- 9.8
|
- 4.8
|
- 4.8
|
- 4.8
|
-
|
-
|
- %
|
-
|
- na
|
- -51.0
|
- -
|
- -
|
-
|
- Business Support/Australian Operational Support Services
(a)
|
- $m
|
- 26.8
|
- -
|
- -
|
- -
|
- -
|
-
|
-
|
- %
|
-
|
- -100.0
|
- na
|
- na
|
- na
|
-
|
- TOTAL
|
- $m
|
- 22.2
|
- 43.3
|
- 29.0
|
- 36.7
|
- 38.3
|
-
|
-
|
- %
|
-
|
- 95.0
|
- -33.0
|
- 26.6
|
- 4.4
|
-
- (a) The Office of Asset Sales (OAS) is progressing
the sale of these businesses. Sales are expected to
be concluded by mid 1997.
- (b) OAS is currently assessing the sale of DASFLEET
or refinancing of the vehicle fleet, with a target
completion date of mid 1997. Budget estimates are based
on refinancing the fleet.
-
As part of the Commonwealth property review, the Government
has decided to divest itself of the Australian Property
Group (APG) through a trade sale or employee/management
buyout.
Estimates of the proceeds from sale/refinancing of
the DAS businesses are included in the totals under
14E.
Asset Sales. The costs associated with the handling
of surplus staff and property following the sale and/or
restructure are reported in 1E.4
Other General Services below.
1E.4 Other
General Services
-
|
-
|
-
|
- 1996-97
|
- 1997-98
|
- 1998-99
|
- 1999-00
|
- 2000-01
|
-
|
-
|
-
|
- Estimate
|
- Budget
|
- Estimate
|
- Estimate
|
- Estimate
|
-
|
- Department of the Environment, Sport and Territories
|
- $m
|
- 20.9
|
- 23.6
|
- 16.7
|
- 16.2
|
- 16.5
|
-
|
-
|
- %
|
-
|
- 12.9
|
- -29.2
|
- -3.0
|
- 1.9
|
-
|
- Department of Administrative Services
|
- $m
|
- 176.9
|
- 240.0
|
- 99.7
|
- 71.2
|
- 72.1
|
-
|
-
|
- %
|
-
|
- 35.7
|
- -58.5
|
- -28.6
|
- 1.3
|
-
|
- Other
|
- $m
|
- 24.2
|
- 25.8
|
- 23.7
|
- 23.7
|
- 23.8
|
-
|
-
|
- %
|
-
|
- 6.6
|
- -8.1
|
- -
|
- 0.4
|
-
|
- TOTAL
|
- $m
|
- 221.9
|
- 289.4
|
- 140.2
|
- 111.2
|
- 112.4
|
-
|
-
|
- %
|
-
|
- 30.4
|
- -51.6
|
- -20.7
|
- 1.1
|
Department of the Environment, Sport and Territories
This element covers the running costs and other outlays
of the Territories Programme that are not elsewhere
classified. Government policy is to bring the laws,
standards and infrastructure on the Indian Ocean Territories
of the Cocos (Keeling) Islands and Christmas Island
up to the standard of those on mainland Australia.
Department of Administrative Services
The Government's decision to withdraw from or to restructure
the common service businesses in DAS will result in
a large number of staff and properties becoming surplus
to requirements. Surplus staff are given short term
assistance with retraining and redeployment counselling
through the DAS Business Sale and Restructuring - Staff
Management Programme. These costs are met by the budget
and are reported under this subfunction. The decline
in outlays from 1998-99 reflects the progressive wind
down of the programme.
Other
This item covers outlays on the Administrative Appeals
Tribunal and other small agencies not elsewhere classified.
1F.
Government Superannuation Benefits
Nature
of Outlays
This function relates to the Finance and Defence portfolios
and comprises outlays associated with the Commonwealth's
provision of superannuation schemes for its employees,
military personnel and members of Parliament. The function
also includes reimbursements to certain State schemes
in respect of former State railway employees and the
outlays of the Commonwealth Superannuation Administration
(ComSuper).
The major Commonwealth civilian superannuation schemes
are the Public Sector Superannuation (PSS) Scheme and
the Commonwealth Superannuation Scheme (CSS), while
the Parliamentary Contributory Superannuation Scheme
exists for members of Parliament. The Military Superannuation
and Benefits Scheme and the Defence Force Retirement
and Death Benefits Scheme provide benefits to military
personnel.
Chart 1. Overview of Commonwealth Net Outlays on
Government
Superannuation Benefits
(1989-90 prices)
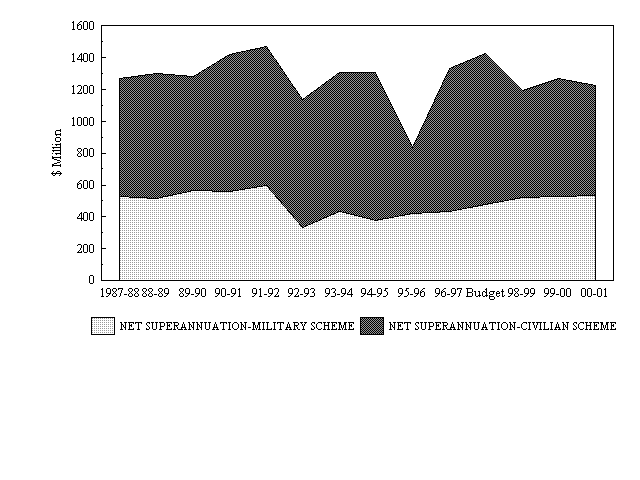
Trends
in Government Superannuation Outlays
Major features of Chart 1 are:
- decreased net outlays in 1992-93 reflecting the commencement
of payment by the Department of Defence of employer
superannuation contributions to the Consolidated Revenue
Fund;
- decreased net outlays in 1995-96, due to the commencement
of notional employer superannuation contributions by
running cost departments and agencies, so bringing
running cost departments and agencies into line with
other government agencies:
- these contributions reduce net superannuation outlays
but have a neutral net effect on total Commonwealth
budget outlays as they are offset by an equivalent
increase in running costs outlays in other functions;
and
- a large increase in net superannuation outlays in 1996-97,
which is expected to continue into 1997-98, due to
lump sum benefit payments associated with public sector
redundancies.
1997-98
and Forward Estimates
-
|
-
|
-
|
- 1996-97
|
- 1997-98
|
- 1998-99
|
- 1999-00
|
- 2000-01
|
-
|
-
|
-
|
- Estimate
|
- Budget
|
- Estimate
|
- Estimate
|
- Estimate
|
- 1F.1
|
- Military Schemes
|
- $m
|
- 500.7
|
- 560.1
|
- 632.7
|
- 652.9
|
- 675.4
|
-
|
-
|
- %
|
-
|
- 11.9
|
- 13.0
|
- 3.2
|
- 3.4
|
- 1F.2
|
- Civilian Schemes
|
- $m
|
- 1040.3
|
- 1128.9
|
- 810.9
|
- 919.5
|
- 882.8
|
-
|
-
|
- %
|
-
|
- 8.5
|
- -28.2
|
- 13.4
|
- -4.0
|
-
|
- TOTAL
|
- $m
|
- 1541.0
|
- 1689.0
|
- 1443.5
|
- 1572.4
|
- 1558.2
|
-
|
-
|
- %
|
-
|
- 9.6
|
- -14.5
|
- 8.9
|
- -0.9
|
-
2. Defence
Nature of Outlays
The Defence function covers outlays on military equipment
and technology, stores, Defence personnel and related
benefits, Defence industry support and Defence administration.
This function includes outlays of the following portfolios:
- Administrative Services;
- Defence; and
- Finance.
The bulk of Defence function outlays are transacted
through the Department of Defence.
Chart 1. Overview of Commonwealth Outlays on
Defence
(1989-90 prices)
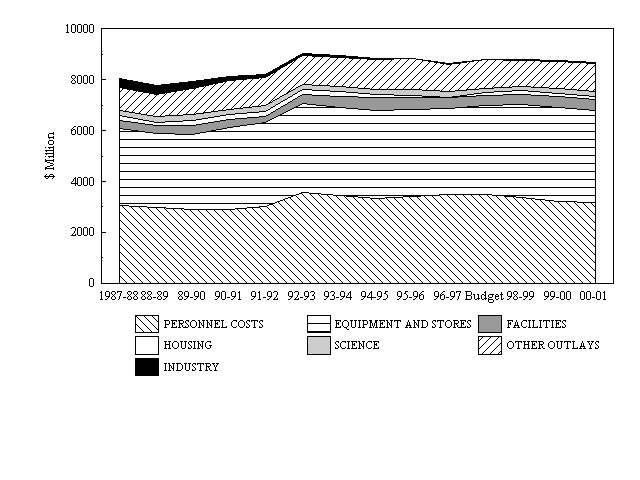
Trends
in Defence Outlays
Defence outlays declined between 1987-88 and 1988-89
as the global allocation for Defence's core activities
was reduced as part of general budgetary restraint.
Defence outlays grew between 1989-90 and 1991-92 reflecting
the impact of the introduction of user charging by
Commonwealth agencies, the provision of supplementary
resources for Defence participation in peacekeeping
activities and funding for special communications projects.
The inclusion of employer superannuation costs for
Defence staff who are members of Commonwealth superannuation
schemes resulted in an increase in Defence outlays
from 1992-93. Since then Defence outlays have declined,
reflecting the 1993-94 Budget decision to apply year
on year reductions to the Defence outlays base to 1996-97.
Estimates for 1997-98 onwards reflect zero real growth
in Defence base outlays.
Savings arising from the Commercial Support Programme
have been allocated by Defence to higher priority areas.
Defence also retains the proceeds from the sale of
most surplus or under-utilised properties. The Government's
policy is to reallocate funds from lower priority and
support areas to enhance Defence's combat capabilities.
This process will be reinforced by the Defence Reform
Programme (DRP) which will implement the agreed recommendations
of the 1997 Defence Efficiency Review report, Future
Directions for the Management of Australia's Defence.
The forward year estimates reflected in the preceding
chart and the following tables do not yet fully reflect
the impact of the DRP.
1997-98
and Forward Estimates
-
|
-
|
-
|
- 1996-97
|
- 1997-98
|
- 1998-99
|
- 1999-00
|
- 2000-01
|
-
|
-
|
-
|
- Estimate
|
- Budget
|
- Estimate
|
- Estimate
|
- Estimate
|
- 2.1
|
- Personnel Costs
|
- $m
|
- 4020.3
|
- 4114.3
|
- 4086.0
|
- 4003.9
|
- 4044.6
|
-
|
-
|
- %
|
-
|
- 2.3
|
- -0.7
|
- -2.0
|
- 1.0
|
- 2.2
|
- Defence Equipment and Stores
|
- $m
|
- 3945.0
|
- 4133.5
|
- 4401.9
|
- 4570.6
|
- 4597.2
|
-
|
-
|
- %
|
-
|
- 4.8
|
- 6.5
|
- 3.8
|
- 0.6
|
- 2.3
|
- Defence Facilities
|
- $m
|
- 485.0
|
- 489.2
|
- 520.3
|
- 529.3
|
- 543.8
|
-
|
-
|
- %
|
-
|
- 0.9
|
- 6.4
|
- 1.7
|
- 2.7
|
- 2.4
|
- Defence Housing
|
- $m
|
- 16.8
|
- 104.6
|
- 150.4
|
- 154.5
|
- 159.2
|
-
|
-
|
- %
|
-
|
- na
|
- 43.8
|
- 2.7
|
- 3.0
|
- 2.5
|
- Defence Industry
|
- $m
|
- 54.3
|
- 23.4
|
- 19.2
|
- 17.9
|
- 18.3
|
-
|
-
|
- %
|
-
|
- -56.9
|
- -17.9
|
- -6.8
|
- 2.2
|
- 2.6
|
- Defence Science
|
- $m
|
- 244.8
|
- 214.9
|
- 211.0
|
- 223.2
|
- 226.7
|
-
|
-
|
- %
|
-
|
- -12.2
|
- -1.8
|
- 5.8
|
- 1.6
|
- 2.7
|
- Other Defence Outlays
|
- $m
|
- 1237.1
|
- 1325.0
|
- 1248.6
|
- 1349.9
|
- 1431.7
|
-
|
-
|
- %
|
-
|
- 7.1
|
- -5.8
|
- 8.1
|
- 6.1
|
-
|
- TOTAL
|
- $m
|
- 10003.4
|
- 10404.8
|
- 10637.4
|
- 10849.3
|
- 11021.5
|
-
|
-
|
- %
|
-
|
- 4.0
|
- 2.2
|
- 2.0
|
- 1.6
|
1997-98 and forward year allocations do not yet fully
reflect the impact of the DRP.
2.1 Personnel
Costs
-
|
-
|
-
|
- 1996-97
|
- 1997-98
|
- 1998-99
|
- 1999-00
|
- 2000-01
|
-
|
-
|
-
|
- Estimate
|
- Budget
|
- Estimate
|
- Estimate
|
- Estimate
|
-
|
- Defence Force Personnel
|
- $m
|
- 2698.2
|
- 2757.3
|
- 2728.8
|
- 2713.9
|
- 2732.4
|
-
|
-
|
- %
|
-
|
- 2.2
|
- -1.0
|
- -0.5
|
- 0.7
|
-
|
- Civilian Personnel
|
- $m
|
- 670.8
|
- 700.3
|
- 713.3
|
- 635.4
|
- 645.6
|
-
|
-
|
- %
|
-
|
- 4.4
|
- 1.9
|
- -10.9
|
- 1.6
|
-
|
- Employer Superannuation Contribution - Military
|
- $m
|
- 528.8
|
- 524.0
|
- 514.1
|
- 522.9
|
- 532.4
|
-
|
-
|
- %
|
-
|
- -0.9
|
- -1.9
|
- 1.7
|
- 1.8
|
-
|
- Employer Superannuation Contribution - Civilian
|
- $m
|
- 122.5
|
- 132.8
|
- 129.8
|
- 131.8
|
- 134.2
|
-
|
-
|
- %
|
-
|
- 8.4
|
- -2.3
|
- 1.5
|
- 1.8
|
-
|
- TOTAL
|
- $m
|
- 4020.3
|
- 4114.3
|
- 4086.0
|
- 4003.9
|
- 4044.6
|
-
|
-
|
- %
|
-
|
- 2.3
|
- -0.7
|
- -2.0
|
- 1.0
|
Employer
Superannuation Contribution
The emerging employer liability for civilian and military
staff who are members of Commonwealth superannuation
schemes is met by making fortnightly payments to ComSuper,
the receipts for which are shown in 1F.
Government Superannuation Benefits.
2.2 Defence
Equipment and Stores
Outlays largely provide for an ongoing equipment procurement
programme undertaken in accordance with strategic priorities.
Outlays on equipment are expected to rise over the
budget and forward estimates period and beyond as savings
from the DRP become available for new investment.
The subfunction also provides for the acquisition of
stores, including ammunition and fuel, required to
maintain the operations of the Australian Defence Force
(ADF).
2.3 Defence
Facilities
This subfunction covers the development of bases, airfields,
communications, training and other facilities. It also
includes the provision of live-in accommodation for
single ADF personnel and repairs and maintenance projects
costing $0.25 million or more. It excludes the provision
of housing which is mostly provided through the Defence
Housing Authority, see 2.4 Defence Housing.
2.4 Defence
Housing
-
|
-
|
-
|
- 1996-97
|
- 1997-98
|
- 1998-99
|
- 1999-00
|
- 2000-01
|
-
|
-
|
-
|
- Estimate
|
- Budget
|
- Estimate
|
- Estimate
|
- Estimate
|
-
|
- Capital Contributions to Defence Housing Authority
|
- $m
|
- -71.0
|
- -51.1
|
- -1.2
|
- -1.2
|
- -1.3
|
-
|
-
|
- %
|
-
|
- -28.0
|
- -97.7
|
- -
|
- 8.3
|
-
|
- Rent Payments to Defence Housing Authority
|
- $m
|
- 183.9
|
- 253.6
|
- 254.6
|
- 264.2
|
- 274.2
|
-
|
-
|
- %
|
-
|
- 37.9
|
- 0.4
|
- 3.8
|
- 3.8
|
-
|
- Rent Recoveries
|
- $m
|
- -97.4
|
- -101.1
|
- -107.2
|
- -113.6
|
- -119.7
|
-
|
-
|
- %
|
-
|
- 3.8
|
- 6.0
|
- 6.0
|
- 5.4
|
-
|
- Other Housing Payments
|
- $m
|
- 1.3
|
- 3.2
|
- 4.2
|
- 5.1
|
- 6.0
|
-
|
-
|
- %
|
-
|
- 146.2
|
- 31.3
|
- 21.4
|
- 17.6
|
-
|
- TOTAL
|
- $m
|
- 16.8
|
- 104.6
|
- 150.4
|
- 154.5
|
- 159.2
|
-
|
-
|
- %
|
-
|
- na
|
- 43.8
|
- 2.7
|
- 3.0
|
This subfunction covers the cost of providing housing
for eligible ADF personnel and their families, largely
through the Defence Housing Authority (DHA). DHA administers
and maintains some 21,500 dwellings. DHA also has the
authority to develop and trade in land and buildings.
Dividends from the DHA, which became payable from 1996-97,
are included in Statement
5.
Capital
Contributions to Defence Housing Authority
Capital contributions (including reinvested interest
until 30 June 1996) were provided to enable DHA to
fund its housing investment programme, including the
Government's $750 million Defence housing improvement
programme, which commenced in 1986 and was completed
in 1996. This item also includes repayment of the principal
of former Commonwealth/State Housing Agreement (Service
Personnel) loans taken over by the authority and, up
to 1997-98, capital repayments by the authority. DHA
also funds its investment programme from retained earnings.
Rent
Payments to Defence Housing Authority and Rent Recoveries
Market rents charged by DHA are reviewed annually to
reflect current market conditions. Recoveries of rent
paid by ADF members under the Group Rent Scheme are
based on rank entitlements. Service personnel receive
significant rental assistance reflected in the difference
between rent payments by the Department of Defence
to the DHA and rent recoveries from personnel.
2.5 Defence
Industry
-
|
-
|
-
|
- 1996-97
|
- 1997-98
|
- 1998-99
|
- 1999-00
|
- 2000-01
|
-
|
-
|
-
|
- Estimate
|
- Budget
|
- Estimate
|
- Estimate
|
- Estimate
|
-
|
- Defence Production
|
- $m
|
- 22.1
|
- 17.8
|
- 17.6
|
- 17.9
|
- 18.3
|
-
|
-
|
- %
|
-
|
- -19.5
|
- -1.1
|
- 1.7
|
- 2.2
|
-
|
- AeroSpace Technologies of Australia
|
- $m
|
- 31.4
|
- 4.4
|
- 1.6
|
- -
|
- -
|
-
|
-
|
- %
|
-
|
- -86.0
|
- -63.6
|
- -100.0
|
- na
|
-
|
- ADI Limited
|
- $m
|
- 0.8
|
- 1.2
|
- 0.1
|
- 0.1
|
- 0.1
|
-
|
-
|
- %
|
-
|
- 50.0
|
- -91.7
|
- -
|
- -
|
-
|
- TOTAL
|
- $m
|
- 54.3
|
- 23.4
|
- 19.2
|
- 17.9
|
- 18.3
|
-
|
-
|
- %
|
-
|
- -56.9
|
- -17.9
|
- -6.8
|
- 2.2
|
Defence
Production
The item assists defence industry development projects
and the participation of Australian industry at various
Defence exhibitions in Australia and overseas.
Payments to Australian defence industries for goods
and services supplied to the Department of Defence
on a commercial basis are included under 2.2
Defence Equipment and Stores.
AeroSpace
Technologies of Australia
In 1994-95, the bulk of AeroSpace Technologies of Australia
Limited (ASTA) was sold by the Commonwealth. Payments
arising from the Sale and Purchase Agreement for ASTA
are included under this item. Also included in this
item are payments and receipts related to the winding
up or sale of remaining elements of ASTA.
ADI
Limited
This item provides for capital injections and other
assistance to ADI Limited. Dividends from ADI Limited
are included in Statement
5.
2.6 Defence
Science
This item covers the cost of the Defence Science and
Technology Organisation (DSTO), which gives advice
on the application of science and technology best suited
to Australia's defence and security needs.
DSTO seeks to enhance Australian use of future developments
in defence-relevant technologies through developing
new capabilities where Australia has special needs,
and supporting existing capabilities by increasing
operational performance and reducing costs of ownership.
DSTO also undertakes some commercial activities and
participates in a number of Cooperative Research Centres.
2.7 Other
Defence Outlays
-
|
-
|
-
|
- 1996-97
|
- 1997-98
|
- 1998-99
|
- 1999-00
|
- 2000-01
|
-
|
-
|
-
|
- Estimate
|
- Budget
|
- Estimate
|
- Estimate
|
- Estimate
|
-
|
- Defence Cooperation Programme
|
- $m
|
- 66.8
|
- 67.9
|
- 68.3
|
- 68.5
|
- 69.4
|
-
|
-
|
- %
|
-
|
- 1.6
|
- 0.6
|
- 0.3
|
- 1.3
|
-
|
- General Administration
|
- $m
|
- 1522.7
|
- 1569.2
|
- 1560.3
|
- 1602.0
|
- 1676.2
|
-
|
-
|
- %
|
-
|
- 3.1
|
- -0.6
|
- 2.7
|
- 4.6
|
-
|
- Recoveries and Repayments
|
- $m
|
- -352.4
|
- -312.1
|
- -380.0
|
- -320.6
|
- -313.9
|
-
|
-
|
- %
|
-
|
- -11.4
|
- 21.8
|
- -15.6
|
- -2.1
|
-
|
- TOTAL
|
- $m
|
- 1237.1
|
- 1325.0
|
- 1248.6
|
- 1349.9
|
- 1431.7
|
-
|
-
|
- %
|
-
|
- 7.1
|
- -5.8
|
- 8.1
|
- 6.1
|
Defence
Cooperation Programme
This programme aims to promote a favourable strategic
environment for Australia through the promotion of
shared security interests in the Asia-Pacific region.
The programme includes training of regional students,
professional exchanges, exercises and equipment and
facilities projects.
General
Administration
This category includes Fringe Benefits Tax, rent, office
requisites, compensation and legal expenses, postage
and telephones, fuel (but not fuel for Service operational
activities) and payments for medical, dental and computer
services.
Recoveries
and Repayments
Recoveries and repayments include charges made for
meals and accommodation at Defence establishments,
defence-related recoveries from other governments,
proceeds from the sale of under-utilised or surplus
properties and reimbursements from the United Nations
for part of the costs of overseas peacekeeping deployments.
Receipts from sales of former Defence properties that
are not attributable to the Defence function are shown
under 1E.General
Services and 14E.
Asset Sales.
3. Public Order
and Safety
Nature
of Outlays
The purpose of these outlays is to ensure that all
Australians have access to appropriate legal services
and protection under the law. They cover courts and
related legal services (other than those concerned
with industrial relations), legal aid, law enforcement,
security and intelligence services and a range of other
public safety activities.
This function includes outlays of the following portfolios:
- Attorney-General's;
- Foreign Affairs and Trade;
- Environment, Sport and Territories;
- Industry, Science and Tourism; and
- Prime Minister and Cabinet.
Chart 1. Overview of Commonwealth Outlays on
Public
Order and Safety
(1989-90 prices)
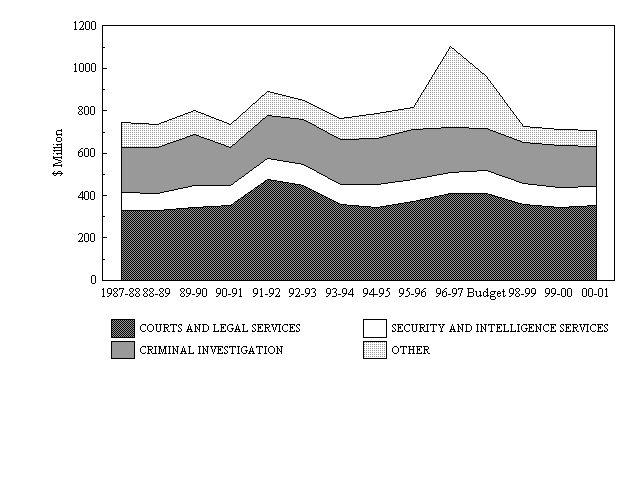
Trends
in Public Order and Safety Outlays
Outlays on Public Order and Safety increased in 1989-90
due to the creation of the Australian Transaction Reports
and Analysis Centre and funding provided to the Australian
Federal Police (AFP) for purposes such as a major office
refit and additional salary costs arising from decisions
of the Police Arbitral Tribunal.
The subsequent decline in outlays in 1990-91 reflected
the introduction of user charging by the Australian
Protective Service and the transfer of funding to the
Australian Capital Territory (ACT) Government for the
ACT Magistrates Court and the AFP's policing activities
in the ACT.
1991-92 saw another increase in outlays, largely associated
with the purchase of land for the Brisbane court building,
the installation of the Legal Office Information System
(LOIS) within the Attorney-General's Department and
the preparation of war crimes legislation.
The transfer of funding for legal services to other
functions in 1992-93 led to a reduction in outlays
in this function. This trend continued in 1993-94
as projects under the Courts Construction Programme
and LOIS were completed. Outlays rose again in 1995-96
as the first initiatives of the previous government's
Justice Statement commenced.
The peak in 1996-97 reflects the Commonwealth Government's
contribution to the National Firearms Program. These
costs mainly constitute the Commonwealth's reimbursement
of payments made by the States and Territories to firearm
owners, dealers and collectors who surrender guns as
part of the compensation-for-surrender scheme. The
reimbursement has been funded from the gun levy collected
as a one-off increase in 1996-97 of 0.2 per cent in
the Medicare levy raising approximately $500 million.
It is now estimated that $169 million of the $500
million will be expended in 1997-98, as the gun amnesty
expires in September 1997. Commonwealth reimbursements
to the States may continue to be made after this date.
The forward estimates indicate that the real value
of outlays will decline from a peak in 1996-97, despite
temporary increases in two subfunctions in 1997-98.
The measures that most affected the forward estimates
include: changes to the financing arrangements for
the construction of the Melbourne Law Courts building;
the limiting of Commonwealth legal aid contributions
to matters arising under Commonwealth law; divestment
and restructuring of commercial business units in the
Attorney-General's portfolio; and savings identified
by the Attorney-General (including a 4 per cent reduction
to the portfolio's running costs) to contribute to
the achievement of the Government's fiscal targets.
These reductions have been partly offset by increases
in funding to the Federal Court of Australia for native
title matters, and to the National Crime Authority
to target fraud against the Commonwealth and related
crime.
1997-98
and Forward Estimates
-
|
-
|
-
|
- 1996-97
|
- 1997-98
|
- 1998-99
|
- 1999-00
|
- 2000-01
|
-
|
-
|
-
|
- Estimate
|
- Budget
|
- Estimate
|
- Estimate
|
- Estimate
|
- 3.1
|
- Courts and Legal Services
|
- $m
|
- 472.6
|
- 483.0
|
- 434.8
|
- 425.3
|
- 446.7
|
-
|
-
|
- %
|
-
|
- 2.2
|
- -10.0
|
- -2.2
|
- 5.0
|
- 3.2
|
- Security and Intelligence Services
|
- $m
|
- 118.7
|
- 130.8
|
- 118.0
|
- 120.0
|
- 119.4
|
-
|
-
|
- %
|
-
|
- 10.2
|
- -9.8
|
- 1.7
|
- -0.5
|
- 3.3
|
- Criminal Investigation
|
- $m
|
- 242.4
|
- 234.3
|
- 233.4
|
- 241.4
|
- 236.7
|
-
|
-
|
- %
|
-
|
- -3.3
|
- -0.4
|
- 3.4
|
- -1.9
|
- 3.4
|
- Other Public Order and Safety
|
- $m
|
- 443.1
|
- 290.8
|
- 94.6
|
- 94.4
|
- 94.2
|
-
|
-
|
- %
|
-
|
- -34.4
|
- -67.5
|
- -0.2
|
- -0.2
|
-
|
- TOTAL
|
- $m
|
- 1276.8
|
- 1139.0
|
- 880.8
|
- 881.1
|
- 896.9
|
-
|
-
|
- %
|
-
|
- -10.8
|
- -22.7
|
- -
|
- 1.8
|
-
3.1 Courts
and Legal Services
-
|
-
|
-
|
- 1996-97
|
- 1997-98
|
- 1998-99
|
- 1999-00
|
- 2000-01
|
-
|
-
|
-
|
- Estimate
|
- Budget
|
- Estimate
|
- Estimate
|
- Estimate
|
-
|
- High Court
|
- $m
|
- 9.6
|
- 9.2
|
- 9.3
|
- 9.4
|
- 9.6
|
-
|
-
|
- %
|
-
|
- -4.2
|
- 1.1
|
- 1.1
|
- 2.1
|
-
|
- Other Commonwealth Courts
|
- $m
|
- 174.4
|
- 188.6
|
- 173.6
|
- 172.7
|
- 190.6
|
-
|
-
|
- %
|
-
|
- 8.1
|
- -8.0
|
- -0.5
|
- 10.4
|
-
|
- Legal Services
|
- $m
|
- 121.5
|
- 140.2
|
- 119.1
|
- 108.6
|
- 109.8
|
-
|
-
|
- %
|
-
|
- 15.4
|
- -15.0
|
- -8.8
|
- 1.1
|
-
|
- Legal Aid
|
- $m
|
- 147.8
|
- 127.1
|
- 121.0
|
- 122.9
|
- 125.0
|
-
|
-
|
- %
|
-
|
- -14.0
|
- -4.8
|
- 1.6
|
- 1.7
|
-
|
- Protection of Human Rights
|
- $m
|
- 19.3
|
- 17.8
|
- 11.8
|
- 11.7
|
- 11.7
|
-
|
-
|
- %
|
-
|
- -7.8
|
- -33.7
|
- -0.8
|
- -
|
-
|
- TOTAL
|
- $m
|
- 472.6
|
- 483.0
|
- 434.8
|
- 425.3
|
- 446.7
|
-
|
-
|
- %
|
-
|
- 2.2
|
- -10.0
|
- -2.2
|
- 5.0
|
Outlays under this subfunction include:
- the High Court, the Federal Court of Australia, the
Family Court of Australia and the Human Rights and
Equal Opportunity Commission;
- the regulation and administration of bankruptcies by
the Insolvency and Trustee Service, Australia;
- the running costs of the Office of the Director of
Public Prosecutions, the operational expenses of the
Law Reform Commission, and the Legal Practice of the
Attorney-General's Department; and
- the Commonwealth's contribution to funding for State
Legal Aid Commissions for general legal aid services
and specific legal aid programmes including the defence
of claims under the Native Title Act 1993. The Commonwealth's
funding arrangements for legal aid are currently being
negotiated with each State and Territory and aim to
better target legal aid funding to matters arising
under Commonwealth law.
3.2 Security
and Intelligence Services
Outlays under this subfunction largely include the
operations of the Australian Security Intelligence
Organization, the Australian Secret Intelligence Service
and the Office of National Assessments. These agencies
collect and assess information relevant to protection
against threats to Australia's national interests.
Other activities include the physical and technical
security at overseas posts, counter-terrorist training
and equipment, and the operations of the Office of
the Inspector-General of Intelligence and Security.
3.3 Criminal
Investigation
-
|
-
|
-
|
- 1996-97
|
- 1997-98
|
- 1998-99
|
- 1999-00
|
- 2000-01
|
-
|
-
|
-
|
- Estimate
|
- Budget
|
- Estimate
|
- Estimate
|
- Estimate
|
-
|
- Australian Federal Police
|
- $m
|
- 187.7
|
- 173.6
|
- 177.8
|
- 185.4
|
- 186.8
|
-
|
-
|
- %
|
-
|
- -7.5
|
- 2.4
|
- 4.3
|
- 0.8
|
-
|
- Other Criminal Investigation
|
- $m
|
- 54.7
|
- 60.8
|
- 55.6
|
- 56.0
|
- 49.9
|
-
|
-
|
- %
|
-
|
- 11.2
|
- -8.6
|
- 0.7
|
- -10.9
|
-
|
- TOTAL
|
- $m
|
- 242.4
|
- 234.3
|
- 233.4
|
- 241.4
|
- 236.7
|
-
|
-
|
- %
|
-
|
- -3.3
|
- -0.4
|
- 3.4
|
- -1.9
|
These outlays provide for law enforcement and associated
investigation activities and include:
- the AFP's enforcement of the law in relation to drug
trafficking, organised crime, fraud against the Commonwealth,
counter terrorism, and community policing in the ACT;
and
- police and criminology support activities such as those
provided by the Australian Bureau of Criminal Intelligence,
the Australian Institute of Criminology, the National
Crime Authority and Australian Transaction Reports
and Analysis Centre.
3.4 Other
Public Order and Safety
-
|
-
|
-
|
- 1996-97
|
- 1997-98
|
- 1998-99
|
- 1999-00
|
- 2000-01
|
-
|
-
|
-
|
- Estimate
|
- Budget
|
- Estimate
|
- Estimate
|
- Estimate
|
-
|
- General Administration
|
- $m
|
- 28.2
|
- 27.2
|
- 27.0
|
- 27.4
|
- 27.4
|
-
|
-
|
- %
|
-
|
- -3.5
|
- -0.7
|
- 1.5
|
- -
|
-
|
- Coastwatch
|
- $m
|
- 34.8
|
- 34.9
|
- 35.5
|
- 36.1
|
- 36.8
|
-
|
-
|
- %
|
-
|
- 0.3
|
- 1.7
|
- 1.7
|
- 1.9
|
-
|
- National Firearms Programme
|
- $m
|
- 331.0
|
- 169.0
|
- -
|
- -
|
- -
|
-
|
-
|
- %
|
-
|
- -48.9
|
- -100.0
|
- na
|
- na
|
-
|
- Other
|
- $m
|
- 49.0
|
- 59.7
|
- 32.1
|
- 30.8
|
- 30.0
|
-
|
-
|
- %
|
-
|
- 21.8
|
- -46.2
|
- -4.0
|
- -2.6
|
-
|
- TOTAL
|
- $m
|
- 443.1
|
- 290.8
|
- 94.6
|
- 94.4
|
- 94.2
|
-
|
-
|
- %
|
-
|
- -34.4
|
- -67.5
|
- -0.2
|
- -0.2
|
This subfunction incorporates all other outlays on
Public Order and Safety activities such as:
- the residual general administration costs of the Attorney-General's
Department, grants and payments to Australian and overseas
bodies, and the costs of publishing legislation;
- the Coastwatch unit of the Australian Customs Service,
which is responsible for the aerial surveillance of
Australian Coastal and Fishing Zone areas, for the
purposes of detecting smuggling, illegal entry, unauthorised
fishing and quarantine breaches;
- the National Firearms Program which provides compensation
to gun owners, dealers and collectors for the surrender
of certain categories of firearms;
- provision of community policing in the Territories
of Christmas Island and Cocos (Keeling) Islands; and
- the protection of Commonwealth property.
4. Education
Nature of
Outlays
The bulk of Commonwealth funding is provided, as grants,
to the suppliers of education services, namely:
- higher education institutions;
- vocational education and training (VET) providers including
Technical and Further Education (TAFE) institutions;
and
- government (State and Territory) and non-government
schools.
Other funds, sourced from general purpose grants to
the States, which also flow to the schools and VET
sectors, are reported in 14B.
General Purpose Inter-Government Transactions.
Outlays under this function also include income or
other support for students (mainly through the Student
Assistance Scheme (AUSTUDY) and the Aboriginal Student
Assistance Scheme (ABSTUDY)), English language tuition
for recently arrived migrants and running costs associated
with the education function within the Employment,
Education, Training and Youth Affairs portfolio.
Offsets to outlays include the repayment of Higher
Education Contribution Scheme (HECS) liabilities and
AUSTUDY supplement loans.
This function includes outlays of the following portfolios:
- Employment, Education, Training and Youth Affairs;
and
- Immigration and Multicultural Affairs.
Chart 1. Overview of Commonwealth Outlays on
Education
(1989-90
prices)
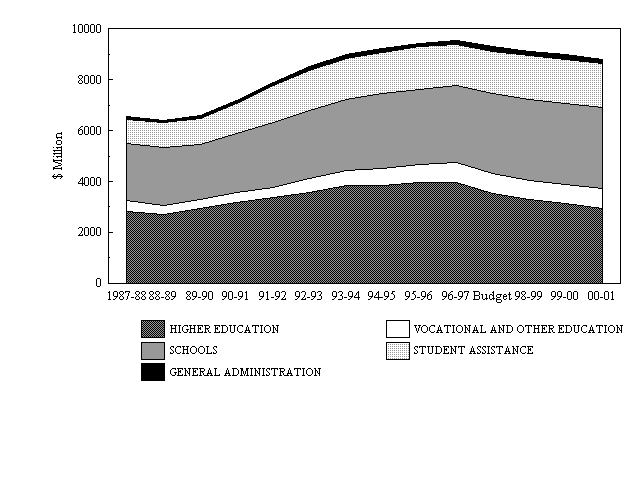
Trends
in Education Outlays
Education outlays have increased in real terms for
all sectors since 1989-90, with increases coming from:
- a significant expansion of the higher education sector
(from around 370,000 places in 1985 to over 634,000
in 1996), with a flow-on to student assistance programmes,
partly offset by revenue collected under HECS;
- major increases in funding for vocational education
from 1991;
- enhanced Commonwealth support for schools, particularly
since the early 1990s; and
- the restructuring of student assistance schemes in
1987 to improve incentives for students to undertake
secondary and tertiary studies beyond the level of
compulsory education including, in 1993, the introduction
of the AUSTUDY Supplement Loans Scheme.
The forward years reflect a decline in higher education
outlays resulting from increases in HECS revenue and
reductions to operating grants. This is partly offset
by continuing growth in non-government school enrolments
and per capita grant payments to needier non-government
schools and the buying back of AUSTUDY Supplement Loan
debt from the Commonwealth Bank of Australia.
1997-98
and Forward Estimates
-
|
-
|
-
|
- 1996-97
|
- 1997-98
|
- 1998-99
|
- 1999-00
|
- 2000-01
|
-
|
-
|
-
|
- Estimate
|
- Budget
|
- Estimate
|
- Estimate
|
- Estimate
|
- 4.1
|
- Higher Education
|
- $m
|
- 4580.3
|
- 4186.4
|
- 3988.3
|
- 3890.0
|
- 3747.0
|
-
|
-
|
- %
|
-
|
- -8.6
|
- -4.7
|
- -2.5
|
- -3.7
|
- 4.2
|
- Vocational and Other Education
|
- $m
|
- 900.3
|
- 919.7
|
- 925.5
|
- 944.4
|
- 967.4
|
-
|
-
|
- %
|
-
|
- 2.2
|
- 0.6
|
- 2.0
|
- 2.4
|
- 4.3
|
- Schools
|
- $m
|
- 3533.4
|
- 3691.4
|
- 3830.7
|
- 3941.1
|
- 4064.6
|
-
|
-
|
- %
|
-
|
- 4.5
|
- 3.8
|
- 2.9
|
- 3.1
|
- 4.4
|
- Student Assistance
|
- $m
|
- 1865.2
|
- 1984.7
|
- 2086.0
|
- 2155.2
|
- 2216.4
|
-
|
-
|
- %
|
-
|
- 6.4
|
- 5.1
|
- 3.3
|
- 2.8
|
- 4.5
|
- General Administration
|
- $m
|
- 187.4
|
- 198.0
|
- 216.4
|
- 209.0
|
- 209.6
|
-
|
-
|
- %
|
-
|
- 5.7
|
- 9.3
|
- -3.4
|
- 0.3
|
-
|
- TOTAL
|
- $m
|
- 11066.6
|
- 10980.1
|
- 11046.8
|
- 11139.8
|
- 11204.9
|
-
|
-
|
- %
|
-
|
- -0.8
|
- 0.6
|
- 0.8
|
- 0.6
|
4.1 Higher
Education
-
|
-
|
-
|
- 1996-97
|
- 1997-98
|
- 1998-99
|
- 1999-00
|
- 2000-01
|
-
|
-
|
-
|
- Estimate
|
- Budget
|
- Estimate
|
- Estimate
|
- Estimate
|
-
|
- Higher Education Grants to Institutions
|
- $m
|
- 3906.9
|
- 3690.0
|
- 3464.9
|
- 3362.0
|
- 3352.7
|
-
|
-
|
- %
|
-
|
- -5.6
|
- -6.1
|
- -3.0
|
- -0.3
|
-
|
- Net Payments from Higher Education Trust Fund
|
- $m
|
- 629.2
|
- 466.1
|
- 497.8
|
- 502.2
|
- 367.7
|
-
|
-
|
- %
|
-
|
- -25.9
|
- 6.8
|
- 0.9
|
- -26.8
|
-
|
- Open Learning Initiative
|
- $m
|
- 18.0
|
- 5.2
|
- 5.3
|
- 5.4
|
- 5.5
|
-
|
-
|
- %
|
-
|
- -71.1
|
- 1.9
|
- 1.9
|
- 1.9
|
-
|
- Other Higher Education
|
- $m
|
- 15.7
|
- 15.6
|
- 15.3
|
- 15.4
|
- 15.9
|
-
|
-
|
- %
|
-
|
- -0.6
|
- -1.9
|
- 0.7
|
- 3.2
|
-
|
- Sub-total
|
- $m
|
- 4569.8
|
- 4176.9
|
- 3983.3
|
- 3884.9
|
- 3741.8
|
-
|
-
|
- %
|
-
|
- -8.6
|
- -4.6
|
- -2.5
|
- -3.7
|
-
|
- International Education
|
- $m
|
- 10.6
|
- 9.5
|
- 5.0
|
- 5.1
|
- 5.2
|
-
|
-
|
- %
|
-
|
- -10.4
|
- -47.4
|
- 2.0
|
- 2.0
|
-
|
- TOTAL
|
- $m
|
- 4580.3
|
- 4186.4
|
- 3988.3
|
- 3890.0
|
- 3747.0
|
-
|
-
|
- %
|
-
|
- -8.6
|
- -4.7
|
- -2.5
|
- -3.7
|
Higher
Education Grants to Institutions and Net Payments from
the Higher Education Trust Fund
Support for higher education institutions involves
direct grants and payments from the Higher Education
Trust Fund. Funding is legislated for three forward
years on a calendar year basis. Research grants are
reported under 1D.
General Research.
Funding for the John Curtin School of Medical Research
which was previously reported in 5.6
Other Health Services is now reported in this subfunction.
Higher
Education Contribution Scheme
All Australian citizens, New Zealand citizens and Australian
permanent residents enrolled in higher education student
places funded by the Commonwealth, unless specifically
exempt, are required to make a contribution to the
cost of their course through the Higher Education Contribution
Scheme (HECS). Since the introduction of HECS in 1989,
a proportion of total operating grants for State and
Commonwealth institutions has been paid through the
Higher Education Trust Fund each year, equal to all
contributions deferred by students and discounts provided
for up-front payments.
Differential HECS contributions apply to students commencing
a HECS liable course from 1997 onwards on the basis
of the units of study undertaken. Units of study have
been divided into three different bands with a contribution
rate of $3,300, $4,700 and $5,500 for Bands 1, 2 and
3 respectively for a full-time equivalent load. Continuing
students will be charged HECS under the previously
existing arrangements until the completion of their
course. The contribution rate for these students in
1997 is $2,478 for a full-time student load.
The income threshold for compulsory HECS repayments
is $20,701 for income earned in 1997-98. From 1 July
1997 people who have deferred their HECS liability
and who have a spouse or dependent children and would
otherwise be required to make a repayment under the
new arrangements will be exempted from making a repayment
in any income year in which they receive an exemption
or reduction of the Medicare levy because of low family
income.
4.2 Vocational
and Other Education
-
|
-
|
-
|
- 1996-97
|
- 1997-98
|
- 1998-99
|
- 1999-00
|
- 2000-01
|
-
|
-
|
-
|
- Estimate
|
- Budget
|
- Estimate
|
- Estimate
|
- Estimate
|
-
|
- Vocational Education and Training Grants
|
- $m
|
- 875.6
|
- 900.0
|
- 905.2
|
- 923.9
|
- 946.6
|
-
|
-
|
- %
|
-
|
- 2.8
|
- 0.6
|
- 2.1
|
- 2.5
|
-
|
- Other Vocational Education and Training
|
- $m
|
- 24.7
|
- 19.7
|
- 20.3
|
- 20.5
|
- 20.8
|
-
|
-
|
- %
|
-
|
- -20.2
|
- 3.0
|
- 1.0
|
- 1.5
|
-
|
- TOTAL
|
- $m
|
- 900.3
|
- 919.7
|
- 925.5
|
- 944.4
|
- 967.4
|
-
|
-
|
- %
|
-
|
- 2.2
|
- 0.6
|
- 2.0
|
- 2.4
|
Vocational
Education and Training Grants
The Commonwealth's primary involvement in vocational
education and training is conducted through the joint
Commonwealth-State body, the Australian National Training
Authority (ANTA).
Under the current ANTA agreement (which is subject
to revision in 1997), the States are to maintain their
effort in vocational education and training, while
the Commonwealth has committed itself to maintaining
a base level of financial support and to providing
funding for growth in the VET sector.
Other
Vocational Education and Training
The Commonwealth also provides funds to the States
for operating the Advanced English for Migrants Programme,
for ANTA's operating expenses and for developing innovative
approaches to VET programmes.
4.3 Schools
-
|
-
|
-
|
- 1996-97
|
- 1997-98
|
- 1998-99
|
- 1999-00
|
- 2000-01
|
-
|
-
|
-
|
- Estimate
|
- Budget
|
- Estimate
|
- Estimate
|
- Estimate
|
-
|
- Schools in the States and Territories
|
-
|
-
|
-
|
-
|
-
|
-
|
-
|
- Government
|
- $m
|
- 1167.1
|
- 1178.3
|
- 1195.0
|
- 1204.9
|
- 1236.8
|
-
|
-
|
- %
|
-
|
- 1.0
|
- 1.4
|
- 0.8
|
- 2.6
|
-
|
- Non-Government
|
- $m
|
- 1881.5
|
- 2006.4
|
- 2146.8
|
- 2283.5
|
- 2376.7
|
-
|
-
|
- %
|
-
|
- 6.6
|
- 7.0
|
- 6.4
|
- 4.1
|
-
|
- Targeted Programmes
|
- $m
|
- 341.1
|
- 366.4
|
- 342.6
|
- 349.3
|
- 356.2
|
-
|
-
|
- %
|
-
|
- 7.4
|
- -6.5
|
- 2.0
|
- 2.0
|
-
|
- Indigenous Education Strategic Initiatives Programme
|
- $m
|
- 110.1
|
- 111.2
|
- 117.3
|
- 80.9
|
- 80.8
|
-
|
-
|
- %
|
-
|
- 1.0
|
- 5.5
|
- -31.0
|
- -0.1
|
-
|
- Other Assistance
|
- $m
|
- 33.6
|
- 29.1
|
- 29.1
|
- 22.5
|
- 14.0
|
-
|
-
|
- %
|
-
|
- -13.4
|
- -
|
- -22.7
|
- -37.8
|
-
|
- TOTAL
|
- $m
|
- 3533.4
|
- 3691.4
|
- 3830.7
|
- 3941.1
|
- 4064.6
|
-
|
-
|
- %
|
-
|
- 4.5
|
- 3.8
|
- 2.9
|
- 3.1
|
Government
and Non-Government Schools
The major part of Commonwealth funding for schools
is provided on a calendar year basis under the States
Grants (Primary and Secondary Education Assistance)
Act 1996 which provides funding for the 1997 to 2000
quadrennium. This includes funding for recurrent and
capital grants. Commonwealth grants represent about
12 per cent of total spending on government schools
with the balance being met by State governments either
from General Purpose Grants or from their own revenue
sources. About 38 per cent of total support for non-government
schools is provided by the Commonwealth with the balance
being met by other governments (19 per cent) and private
sources (43 per cent).
Targeted
Programmes
On 1 January 1997 Commonwealth programmes for schools
were broadbanded, effectively streamlining over 40
smaller programmes into five priority areas of Literacy,
Languages, Special Learning Needs, School-to-Work and
Quality Outcomes. Programmes funded under these priority
areas aim to enhance educational outcomes across both
government and non-government schools. For example,
funding under the literacy programme goes to such projects
as providing grants to schools to improve literacy
outcomes for students from educationally disadvantaged
backgrounds, including students from low socio-economic
backgrounds and those needing to improve their English
language competency.
Indigenous
Education Strategic Initiatives Programme
The Indigenous Education Strategic Initiatives Programme
provides supplementary funding assistance to pre-schools,
government and non-government school systems, TAFE
authorities and independent Indigenous education providers
to improve educational outcomes for Indigenous peoples.
Other
Assistance
The Commonwealth also provides other assistance through
its Grants and Awards Programme. This includes Grants
in Aid, the Australian Students Prize and grants to
the Asia Education Foundation, Language Australia and
the Curriculum Corporation.
4.4 Student
Assistance
-
|
-
|
-
|
- 1996-97
|
- 1997-98
|
- 1998-99
|
- 1999-00
|
- 2000-01
|
-
|
-
|
-
|
- Estimate
|
- Budget
|
- Estimate
|
- Estimate
|
- Estimate
|
-
|
- AUSTUDY
|
- $m
|
- 1570.2
|
- 1677.1
|
- 1787.1
|
- 1855.3
|
- 1911.0
|
-
|
-
|
- %
|
-
|
- 6.8
|
- 6.6
|
- 3.8
|
- 3.0
|
-
|
- ABSTUDY and Other Assistance to Aboriginals
|
- $m
|
- 184.4
|
- 181.5
|
- 179.8
|
- 180.2
|
- 184.9
|
-
|
-
|
- %
|
-
|
- -1.6
|
- -0.9
|
- 0.2
|
- 2.6
|
-
|
- Migrant Education
|
- $m
|
- 76.1
|
- 95.6
|
- 83.0
|
- 83.3
|
- 83.9
|
-
|
-
|
- %
|
-
|
- 25.6
|
- -13.2
|
- 0.4
|
- 0.7
|
-
|
- Other
|
- $m
|
- 34.5
|
- 30.5
|
- 36.1
|
- 36.3
|
- 36.6
|
-
|
-
|
- %
|
-
|
- -11.6
|
- 18.4
|
- 0.6
|
- 0.8
|
-
|
- TOTAL
|
- $m
|
- 1865.2
|
- 1984.7
|
- 2086.0
|
- 2155.2
|
- 2216.4
|
-
|
-
|
- %
|
-
|
- 6.4
|
- 5.1
|
- 3.3
|
- 2.8
|
AUSTUDY
AUSTUDY provides income support grants to full-time
students 16 years of age and older undertaking approved
courses of study in secondary schools, TAFE colleges,
approved TAFE equivalent courses offered by private
providers and higher education institutions.
Under the AUSTUDY Supplement Loans Scheme eligible
students have the option of trading-in part of their
grant for a loan of twice that amount, up to a maximum
of $7,000 a year.
ABSTUDY
and Other Assistance to Aboriginals
ABSTUDY is similar to AUSTUDY, assisting Aboriginal
and Torres Strait Islander students in primary, secondary
and tertiary education by providing income support
and other assistance tailored to their needs. Retention
rates for Aboriginal and Torres Strait Islander students
were estimated at 30 per cent in 1995 compared to 74
per cent for the general population.
The Aboriginal Tutorial Assistance Scheme provides
Aboriginal students with tutorial assistance by contracting
tutors and with assistance for the establishment and
operation of homework centres. The Aboriginal Student
Support and Parental Awareness programme funds school-based
parents' committees to undertake activities aimed at
increasing education participation.
Migrant
Education
The Adult Migrant English Programme provides access
to English as a second language tuition for all recently
arrived migrants without functional English.
4.5 General
Administration
Outlays under this subfunction consist almost entirely
of running costs associated with the administration
of the Education function.
5. Health
Nature of Outlays
The Health function covers outlays on facilities or
services for the prevention and treatment of human
illness, setting standards for safety and efficacy
of therapeutic goods and services, support for health
research and the promotion of better health. Aged
persons' hostels and most outlays on Aboriginals are
classified to 6.
Social Security and Welfare. The major purpose
of Commonwealth health outlays is to ensure that all
Australians have access to necessary health services
without excessive price barriers.
Universal health cover under Medicare includes subsidised
medical and pharmaceutical services and public hospital
services. Other Commonwealth assistance in the health
area includes subsidised residential care services
and certain allied health services (e.g. hearing services).
Assistance is also provided through a number of tax
measures (e.g. sales tax exemptions on a range of medical
related goods and tax rebates under the private health
insurance incentives).
Medical and pharmaceutical benefits under Medicare
are provided directly by the Commonwealth. Financial
assistance for State hospitals under the Medicare Agreements
ensure public hospital patients have free shared ward
accommodation and treatment for both inpatient and
outpatient services.
The Commonwealth promotes access of Aboriginal and
Torres Strait Islander people to a range of health
services through its own programmes and by working
with the States in the planning and funding of mainstream
health services.
A group of broadbanded public health programmes (a
major component of 5.6
Other Health Services) provide for the promotion
of better health, health research and direct responses
to national health issues such as HIV/AIDS and drug
abuse.
This function includes outlays of the following portfolios:
- Health and Family Services; and
- Veterans' Affairs.
Chart 1. Overview of Commonwealth Outlays on Health
(1989-90
prices)
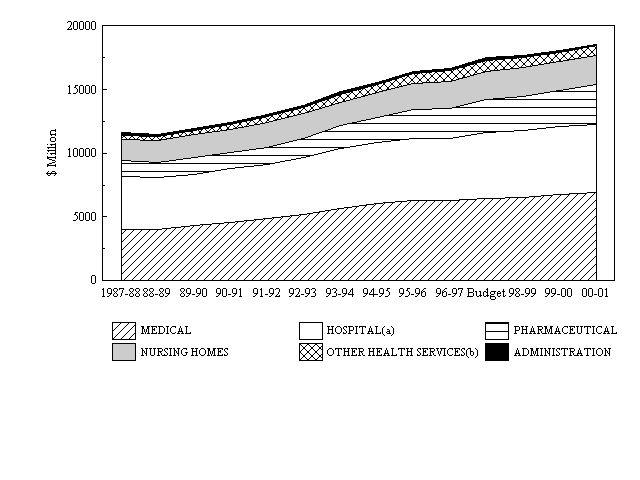
- (a) Includes Identified Health Grants, which were classified
to 14B. General Purpose Inter-Government Transactions
during the period 1981-82 to 1987-88.
- (b) Includes Aboriginal and Torres Strait Islander
Health.
Trends
in Health Outlays
Growth in Commonwealth health outlays has averaged
around 4 per cent a year in real terms since 1987-88
(refer Chart 1). The growth mainly reflects a steady
increase in utilisation of medical services and pharmaceutical
services over the period and a drift towards more costly
drugs and medical services.
In the forward years real growth in Commonwealth health
outlays is expected to continue, but at a rate less
than recent years. The reduced growth reflects mainly
lower growth in outlays on Medical Services and Benefits
as a result of a range of measures taken over a number
of years to constrain the growth in the Medicare Benefits
Scheme. The rapid growth in pharmaceutical benefits
is expected to moderate over the next two years as
a result of measures, particularly in this and the
previous budget, but with an outlook for renewed growth
as demand for new, more effective but high cost drugs
continues. Outlays for Hospital Services are projected
to grow at the rate specified in the current Medicare
Agreements. The current agreements conclude in June
1998 and new agreements with the States are to be negotiated
during 1997-98.
1997-98
and Forward Estimates
-
|
-
|
-
|
- 1996-97
|
- 1997-98
|
- 1998-99
|
- 1999-00
|
- 2000-01
|
-
|
-
|
-
|
- Estimate
|
- Budget
|
- Estimate
|
- Estimate
|
- Estimate
|
- 5.1
|
- Medical Services and Benefits
|
- $m
|
- 7300.6
|
- 7584.2
|
- 7904.8
|
- 8351.4
|
- 8768.0
|
-
|
-
|
- %
|
-
|
- 3.9
|
- 4.2
|
- 5.6
|
- 5.0
|
- 5.2
|
- Hospital Services
|
- $m
|
- 5613.1
|
- 6206.7
|
- 6402.3
|
- 6612.0
|
- 6838.7
|
-
|
-
|
- %
|
-
|
- 10.6
|
- 3.2
|
- 3.3
|
- 3.4
|
- 5.3
|
- Pharmaceutical Services and Benefits
|
- $m
|
- 2678.4
|
- 3013.0
|
- 3175.5
|
- 3555.8
|
- 3986.1
|
-
|
-
|
- %
|
-
|
- 12.5
|
- 5.4
|
- 12.0
|
- 12.1
|
- 5.4
|
- Nursing Home Subsidies and Domiciliary Care Services
|
- $m
|
- 2484.2
|
- 2636.1
|
- 2757.0
|
- 2827.5
|
- 2905.5
|
-
|
-
|
- %
|
-
|
- 6.1
|
- 4.6
|
- 2.6
|
- 2.8
|
- 5.5
|
- Aboriginal and Torres Strait Islander Health
|
- $m
|
- 112.0
|
- 127.1
|
- 130.9
|
- 131.9
|
- 125.7
|
-
|
-
|
- %
|
-
|
- 13.5
|
- 3.0
|
- 0.8
|
- -4.7
|
- 5.6
|
- Other Health Services
|
- $m
|
- 898.8
|
- 904.3
|
- 842.6
|
- 796.4
|
- 813.3
|
-
|
-
|
- %
|
-
|
- 0.6
|
- -6.8
|
- -5.5
|
- 2.1
|
- 5.7
|
- General Administration
|
- $m
|
- 207.0
|
- 228.2
|
- 209.0
|
- 173.8
|
- 179.3
|
-
|
-
|
- %
|
-
|
- 10.2
|
- -8.4
|
- -16.8
|
- 3.2
|
-
|
- TOTAL
|
- $m
|
- 19294.1
|
- 20699.5
|
- 21422.1
|
- 22448.7
|
- 23616.6
|
-
|
-
|
- %
|
-
|
- 7.3
|
- 3.5
|
- 4.8
|
- 5.2
|
5.1 Medical
Services and Benefits
-
|
-
|
-
|
- 1996-97
|
- 1997-98
|
- 1998-99
|
- 1999-00
|
- 2000-01
|
-
|
-
|
-
|
- Estimate
|
- Budget
|
- Estimate
|
- Estimate
|
- Estimate
|
-
|
- Medical Benefits
|
- $m
|
- 6073.2
|
- 6368.1
|
- 6538.6
|
- 6917.2
|
- 7243.1
|
-
|
-
|
- %
|
-
|
- 4.9
|
- 2.7
|
- 5.8
|
- 4.7
|
-
|
- Health Insurance Commission Administrative Costs
|
- $m
|
- 251.1
|
- 248.8
|
- 252.1
|
- 250.1
|
- 257.2
|
-
|
-
|
- %
|
-
|
- -0.9
|
- 1.3
|
- -0.8
|
- 2.8
|
-
|
- Veterans and Dependants
|
- $m
|
- 598.4
|
- 629.7
|
- 686.6
|
- 746.8
|
- 813.0
|
-
|
-
|
- %
|
-
|
- 5.2
|
- 9.0
|
- 8.8
|
- 8.9
|
-
|
- Other Services
|
- $m
|
- 377.9
|
- 337.8
|
- 427.5
|
- 437.2
|
- 454.7
|
-
|
-
|
- %
|
-
|
- -10.6
|
- 26.6
|
- 2.3
|
- 4.0
|
-
|
- TOTAL
|
- $m
|
- 7300.6
|
- 7584.2
|
- 7904.8
|
- 8351.4
|
- 8768.0
|
-
|
-
|
- %
|
-
|
- 3.9
|
- 4.2
|
- 5.6
|
- 5.0
|
The purpose of these outlays is to achieve high quality
health outcomes for people by enabling access to timely
and appropriate health care services at reasonable
cost.
Chart 2. Medicare Benefits Outlays
(1989-90 prices)
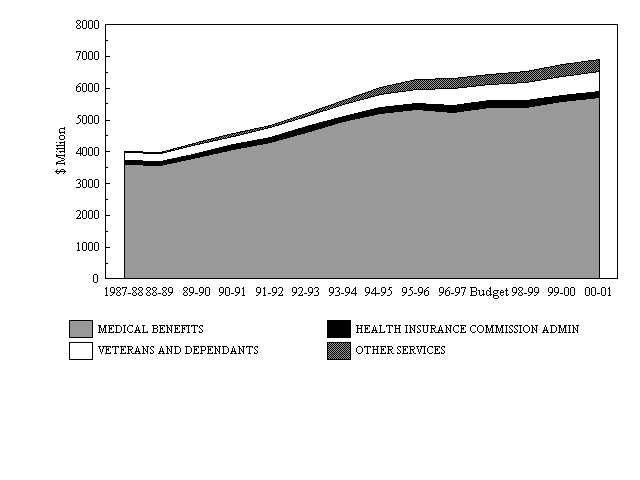
Medical
Benefits
The Commonwealth provides assistance under Medicare
towards the cost of out-of-hospital medical services
(85 per cent of the schedule fee with a limit on the
gap between the benefit and schedule fee for individual
claims) and towards the cost of medical services provided
to patients under private care in hospital (75 per
cent of the schedule fee with no limit on the gap between
the benefit and schedule fee on individual claims).
A safety net applies to out-of-hospital medical services.
For medical services rendered to private patients in
either public or private hospitals, registered health
insurers are required to offer gap insurance in their
hospital tables to cover the difference between 75
per cent and the full amount of the schedule fee. Insurers
are not permitted to provide cover for payments above
the schedule fee, unless they have a contract with
the medical practitioner providing the service.
Medical practitioners may direct bill the Commonwealth
on behalf of any patient and accept the Medicare benefit
as full payment for their services.
The increase in outlays over the decade to 1996-97,
averaging growth in real terms of 5 per cent a year,
reflects the following components:
- about half from growth in the volume of services, mostly
driven by increased utilisation of services per person
with some growth due to increases in the size and age
of the population; and
- the remainder from increases in the schedule fee and
the drift to more expensive services and procedures.
Health
Insurance Commission - Administration of Medicare Benefits
The Health Insurance Commission (HIC) is a budget funded
agency which pays Medicare benefits in respect of services
listed in the Medicare Benefits Schedule to the Health
Insurance Act 1973. Medicare benefits may be claimed
through Medicare shopfronts, direct billing and also
through pharmacies in some rural and regional areas.
Electronic claiming will also be available through
some medical practices commencing in 1997-98.
Veterans
and Dependants
The Commonwealth meets the costs, for eligible veterans
and their dependants, of local medical officer, specialist,
paramedical and dental services, the supply and maintenance
of surgical aids and travelling and other expenses
incurred in obtaining medical treatment.
Other
Services
The largest item under this category is the General
Practice Reforms (including grants to Divisions of
General Practice, Better Practice Payments and the
Rural Incentives Programme), which are designed to
improve the service quality of general practice and
address the structural issues contributing to growth
in Medicare benefits outlays.
5.2 Hospital
Services
-
|
-
|
-
|
- 1996-97
|
- 1997-98
|
- 1998-99
|
- 1999-00
|
- 2000-01
|
-
|
-
|
-
|
- Estimate
|
- Budget
|
- Estimate
|
- Estimate
|
- Estimate
|
-
|
- Public Hospitals
|
- $m
|
- 4782.0
|
- 4947.8
|
- 5132.9
|
- 5310.2
|
- 5501.6
|
-
|
-
|
- %
|
-
|
- 3.5
|
- 3.7
|
- 3.5
|
- 3.6
|
-
|
- Veterans and Dependants
|
- $m
|
- 825.7
|
- 806.7
|
- 812.9
|
- 840.7
|
- 871.5
|
-
|
-
|
- %
|
-
|
- -2.3
|
- 0.8
|
- 3.4
|
- 3.7
|
-
|
- Private Health Insurance Incentives
|
- $m
|
- -
|
- 451.3
|
- 455.8
|
- 460.3
|
- 464.9
|
-
|
-
|
- %
|
-
|
- na
|
- 1.0
|
- 1.0
|
- 1.0
|
-
|
- Other Hospital Services
|
- $m
|
- 5.4
|
- 1.0
|
- 0.8
|
- 0.7
|
- 0.7
|
-
|
-
|
- %
|
-
|
- -81.5
|
- -20.0
|
- -12.5
|
- -
|
-
|
- TOTAL
|
- $m
|
- 5613.1
|
- 6206.7
|
- 6402.3
|
- 6612.0
|
- 6838.7
|
-
|
-
|
- %
|
-
|
- 10.6
|
- 3.2
|
- 3.3
|
- 3.4
|
Outlays under this subfunction are designed to ensure
efficient and effective delivery of hospital care under
Medicare, which entitles all Australian residents to
free shared ward accommodation and treatment, and free
outpatient, accident and emergency treatment at public
hospitals. Those electing to have 'doctor-of-choice'
or private ward accommodation in a public hospital
must bear the cost or take out appropriate hospital
insurance cover. From July 1997, the Commonwealth
will provide incentives to people to take out private
health insurance through the Private Health Insurance
Incentive Programme.
Public
Hospitals
To support free hospital care under Medicare, the Commonwealth
provides substantial financial assistance to the States
through Medicare Agreements. The current Medicare Agreements
cover the period 1 July 1993 to 30 June 1998 and focus
on increasing public patient access and improving the
efficiency and effectiveness of service delivery.
Hospital funding is indexed for wage and price increases
and age/sex weighted population growth.
The Agreements also include:
- arrangements under which a proportion of funding is
linked to the achievement of performance targets in
areas of public patient activity (inpatient and outpatient),
elective surgery waiting times and emergency department
waiting times; and
- a specific Commonwealth contribution for the treatment
of AIDS patients in public hospitals, which is indexed
to the actual growth in cases treated, in recognition
of the impact of AIDS on public hospital systems.
Veterans
and Dependants
All Repatriation General Hospitals have been either
integrated into the States' public hospital systems
or sold to the private sector. Formal proposals have
been invited from the private sector for the purchase
and operation of the remaining Repatriation Auxiliary
Hospital, Lady Davidson. Veterans are now treated under
the Repatriation Private Patient Scheme which allows
them to be treated at public hospitals or private hospitals
with which the Department of Veterans' Affairs (DVA)
has a contract. Consequently, veterans can be treated
closer to home and linked into their local health care
networks.
Private
Health Insurance Incentives
The Private Health Insurance Incentives Scheme, which
commences on 1 July 1997, will provide an income-tested
financial incentive to families and individuals to
take out and maintain private health insurance cover.
The amount of incentive paid will depend on the type
and level of private health insurance coverage held.
Recipients will have the choice of claiming the incentives
through their health insurance fund in the form of
reduced premiums or as an income tax rebate, claimable
after the end of the income year.
5.3 Pharmaceutical
Services and Benefits
-
|
-
|
-
|
- 1996-97
|
- 1997-98
|
- 1998-99
|
- 1999-00
|
- 2000-01
|
-
|
-
|
-
|
- Estimate
|
- Budget
|
- Estimate
|
- Estimate
|
- Estimate
|
-
|
- Pharmaceutical Benefits Scheme
|
-
|
-
|
-
|
-
|
-
|
-
|
-
|
- General
|
- $m
|
- 445.6
|
- 495.4
|
- 533.7
|
- 604.3
|
- 685.0
|
-
|
-
|
- %
|
-
|
- 11.2
|
- 7.7
|
- 13.2
|
- 13.4
|
-
|
- Concessional
|
- $m
|
- 1824.6
|
- 2012.8
|
- 2106.6
|
- 2374.0
|
- 2676.7
|
-
|
-
|
- %
|
-
|
- 10.3
|
- 4.7
|
- 12.7
|
- 12.8
|
-
|
- Sub-total
|
- $m
|
- 2270.2
|
- 2508.2
|
- 2640.3
|
- 2978.3
|
- 3361.7
|
-
|
-
|
- %
|
-
|
- 10.5
|
- 5.3
|
- 12.8
|
- 12.9
|
-
|
- Repatriation Pharmaceutical Benefits Scheme
|
- $m
|
- 160.8
|
- 188.4
|
- 194.5
|
- 211.7
|
- 231.9
|
-
|
-
|
- %
|
-
|
- 17.2
|
- 3.2
|
- 8.8
|
- 9.5
|
-
|
- Alternative Arrangements for the Supply of Drugs
|
- $m
|
- 201.6
|
- 269.8
|
- 295.0
|
- 320.4
|
- 346.6
|
-
|
-
|
- %
|
-
|
- 33.8
|
- 9.3
|
- 8.6
|
- 8.2
|
-
|
- Pharmacy Restructuring
|
- $m
|
- 7.0
|
- 8.7
|
- 8.8
|
- 8.9
|
- 9.0
|
-
|
-
|
- %
|
-
|
- 24.3
|
- 1.1
|
- 1.1
|
- 1.1
|
-
|
- Health Insurance Commission Administrative Costs
|
- $m
|
- 38.7
|
- 38.0
|
- 37.0
|
- 36.5
|
- 36.9
|
-
|
-
|
- %
|
-
|
- -1.8
|
- -2.6
|
- -1.4
|
- 1.1
|
-
|
- TOTAL
|
- $m
|
- 2678.4
|
- 3013.0
|
- 3175.5
|
- 3555.8
|
- 3986.1
|
-
|
-
|
- %
|
-
|
- 12.5
|
- 5.4
|
- 12.0
|
- 12.1
|
Through Pharmaceutical Services and Benefits, the Commonwealth
aims to ensure access by the Australian community to
necessary, cost-effective medicines at the lowest cost
to Government and consumers, consistent with reliable
supply.
Chart 3. Pharmaceutical Services and Benefits
(1989-90
prices)
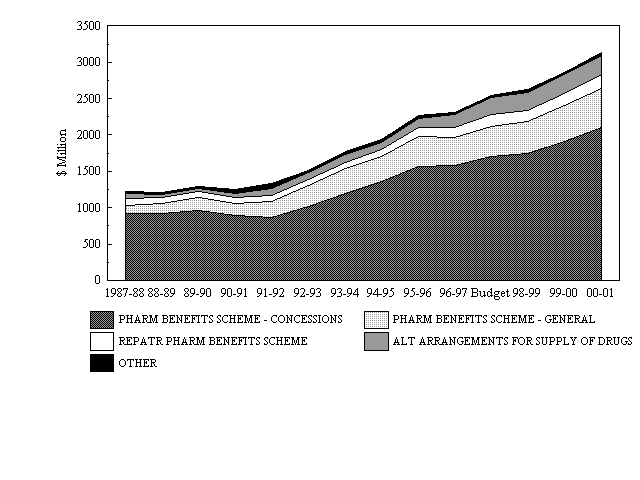
Pharmaceutical
Benefits Scheme and the Repatriation Pharmaceutical
Benefits Scheme
Under the Pharmaceutical Benefits Scheme (PBS), the
Commonwealth provides assistance towards the cost of
pharmaceuticals. Concessional patients (pensioners,
the unemployed and low income families) are entitled
to a higher subsidy than the general public. A safety
net applies to both the general public and concessionals
on a calendar year basis.
Under the Repatriation Pharmaceutical Benefits Scheme
(RPBS), beneficiaries (veterans with recognised war
or service related disabilities) have access to both
pharmaceuticals under the PBS and a supplementary Repatriation
list, at the same cost as patients entitled to the
concessional payment.
Patient contributions and safety net levels are indexed
annually in accordance with movements in the Consumer
Price Index (CPI).
The Commonwealth presently has an agreement with retail
pharmacies under which pharmacists are approved to
supply benefits under these schemes, and remuneration
levels for pharmacists in respect of pharmaceutical
benefits are determined.
The key determinants of growth in pharmaceutical benefits
have been the listing of new, more expensive drugs
and the shift in prescribing patterns towards those
drugs; and underlying growth in demand reflecting both
growth in utilisation and changes in the size and composition
of the population (as a result of ageing).
Alternative
Arrangements for the Supply of Drugs
In certain circumstances some pharmaceuticals are not
suitable for the normal supply arrangements under the
PBS and alternative arrangements are made. These include:
- human growth hormone which is supplied free of charge
through doctors, mainly paediatricians;
- selected highly specialised drugs (including drugs
for the treatment of HIV/AIDS), which are supplied
by States through hospitals to outpatients. The Commonwealth
funds part of the costs of these drugs through grants
to the States, with additional costs met by patient
contributions; and
- some essential vaccines, as part of the National Childhood
Immunisation Programme (part of the new broadbanded
National Public Health Programme), which will be provided
free of charge through doctors and other immunisation
providers.
Health
Insurance Commission - Administration of Pharmaceutical
Benefits
The Health Insurance Commission (HIC) administers the
PBS. It reimburses pharmacists for the difference between
the Commonwealth price of pharmaceuticals and patient
contributions. It also undertakes measures to ensure
that benefits are supplied correctly and only to eligible
people.
5.4 Residential
Care Subsidies and Domiciliary Care Services
-
|
-
|
-
|
- 1996-97
|
- 1997-98
|
- 1998-99
|
- 1999-00
|
- 2000-01
|
-
|
-
|
-
|
- Estimate
|
- Budget
|
- Estimate
|
- Estimate
|
- Estimate
|
-
|
- Nursing Home Subsidies for the Aged
|
- $m
|
- 2204.3
|
- 2338.1
|
- 2415.4
|
- 2460.9
|
- 2508.0
|
-
|
-
|
- %
|
-
|
- 6.1
|
- 3.3
|
- 1.9
|
- 1.9
|
-
|
- Nursing Care for Veterans and Dependants
|
- $m
|
- 83.9
|
- 84.8
|
- 88.3
|
- 91.9
|
- 96.8
|
-
|
-
|
- %
|
-
|
- 1.1
|
- 4.1
|
- 4.1
|
- 5.3
|
-
|
- Domiciliary Nursing Care Benefit
|
- $m
|
- 64.9
|
- 71.6
|
- 102.3
|
- 114.8
|
- 128.8
|
-
|
-
|
- %
|
-
|
- 10.3
|
- 42.9
|
- 12.2
|
- 12.2
|
-
|
- Home Nursing Service
|
- $m
|
- 131.0
|
- 141.6
|
- 150.9
|
- 159.8
|
- 171.9
|
-
|
-
|
- %
|
-
|
- 8.1
|
- 6.6
|
- 5.9
|
- 7.6
|
-
|
- TOTAL
|
- $m
|
- 2484.2
|
- 2636.1
|
- 2757.0
|
- 2827.5
|
- 2905.5
|
-
|
-
|
- %
|
-
|
- 6.1
|
- 4.6
|
- 2.6
|
- 2.8
|
The Commonwealth provides funding for aged persons
living in residential care facilities and receiving
care in the community. In 1997-98 nursing homes and
hostels will be brought together under one set of arrangements
for residential care. The outlays shown here relate
to the higher levels of care provided by services currently
classified as nursing homes. Hostel-type facilities
and community based care funding are covered under
6. Social Security and Welfare. Access to residential
care services and Community Aged Care Packages follows
identification of care needs by Aged Care Assessment
Teams which are administered by the States with recurrent
funding provided by the Commonwealth.
Nursing
Home Subsidies for the Aged
The Commonwealth sets fees based on the assessed care
needs of residents. The amount of subsidy paid by
the Commonwealth is determined by the fee, less a statutory
resident contribution. This subsidy will be income
tested from 1997-98. The fee provides for the nursing
and personal care costs of residents, and their accommodation
costs.
Refundable accommodation bonds will apply across residential
care services from 1997-98. The interest earnings
and administration fee will provide the principal funding
source for the construction, extension and upgrading
of the former nursing home sector.
Nursing
Care for Veterans and Dependants
Nursing care for veterans and dependants is funded
through the Department of Veterans' Affairs. Funds
are paid directly to the Department of Health and Family
Services which acts as agent in the delivery of these
services.
Domiciliary
Nursing Care Benefit
The Commonwealth pays a fortnightly benefit (adjusted
by the Consumer Price Index (CPI) each January) to
eligible persons who provide care at home for persons
aged 16 years or more who would otherwise be eligible
for a high level of residential care.
Home
Nursing Service
Home nursing services are one of a range of services
offered through the Home and Community Care programme.
Others include respite care, home help and dementia
projects (see 6. Social Security and Welfare).
5.5 Aboriginal
and Torres Strait Islander Health
-
|
-
|
-
|
- 1996-97
|
- 1997-98
|
- 1998-99
|
- 1999-00
|
- 2000-01
|
-
|
-
|
-
|
- Estimate
|
- Budget
|
- Estimate
|
- Estimate
|
- Estimate
|
-
|
- Aboriginal and Torres Strait Islander Health
|
- $m
|
- 112.0
|
- 127.1
|
- 130.9
|
- 131.9
|
- 125.7
|
-
|
-
|
- %
|
-
|
- 13.5
|
- 3.0
|
- 0.8
|
- -4.7
|
-
|
- TOTAL
|
- $m
|
- 112.0
|
- 127.1
|
- 130.9
|
- 131.9
|
- 125.7
|
-
|
-
|
- %
|
-
|
- 13.5
|
- 3.0
|
- 0.8
|
- -4.7
|
The Commonwealth contributes to the health of Aboriginal
and Torres Strait Islander people through funding community-controlled
Aboriginal Health Services. Commonwealth funding also
supports a range of specialist services, including
mental health and hearing services. In addition, the
Commonwealth is involved in seeking to improve the
access of indigenous people to mainstream health services
by working with the States in the planning and funding
of these services.
5.6 Other
Health Services
-
|
-
|
-
|
- 1996-97
|
- 1997-98
|
- 1998-99
|
- 1999-00
|
- 2000-01
|
-
|
-
|
-
|
- Estimate
|
- Budget
|
- Estimate
|
- Estimate
|
- Estimate
|
-
|
- Health Research
|
- $m
|
- 163.4
|
- 174.1
|
- 149.2
|
- 128.2
|
- 130.8
|
-
|
-
|
- %
|
-
|
- 6.5
|
- -14.3
|
- -14.1
|
- 2.0
|
-
|
- Health Promotion & Disease Prevention
|
- $m
|
- 292.5
|
- 259.9
|
- 215.2
|
- 210.5
|
- 214.3
|
-
|
-
|
- %
|
-
|
- -11.1
|
- -17.2
|
- -2.2
|
- 1.8
|
-
|
- Health Support Services
|
- $m
|
- 419.6
|
- 403.1
|
- 426.3
|
- 448.1
|
- 459.6
|
-
|
-
|
- %
|
-
|
- -3.9
|
- 5.8
|
- 5.1
|
- 2.6
|
-
|
- Other
|
- $m
|
- 23.3
|
- 67.2
|
- 51.9
|
- 9.5
|
- 8.7
|
-
|
-
|
- %
|
-
|
- 188.4
|
- -22.8
|
- -81.7
|
- -8.4
|
-
|
- TOTAL
|
- $m
|
- 898.8
|
- 904.3
|
- 842.6
|
- 796.4
|
- 813.3
|
-
|
-
|
- %
|
-
|
- 0.6
|
- -6.8
|
- -5.5
|
- 2.1
|
The Commonwealth, in partnership with other levels
of government and the non-government sector, aims to
support an improvement in the health of all Australians
and help reduce the disparities between social groups.
Health
Research
Commonwealth support for health research activities
includes funding for medical and public health research
through the Medical Research Endowment Fund, the Public
Health Research and Development Committee and the Australian
Institute of Health and Welfare. Funding is also provided
to supplement capital spending at medical research
institutes.
The John Curtin School of Medical Research, which was
previously reported in this section, has been moved
to 4.1
Higher Education, and its funding has been combined
with other higher education funding.
Health
Promotion and Disease Prevention
The bulk of funding is provided under the National
Public Health Programme, which aims to promote and
protect the health of all Australians and to minimise
the incidence and severity of preventable illness,
injury and disability. This includes elements such
as women's health, family planning, AIDS control, drug
strategies and childhood immunisation. The Commonwealth
is currently negotiating new outcome-based agreements
with the States to cover the period to 1998-99. These
agreements will allow funds, previously provided through
a variety of specific purpose payments, to be pooled
into one block grant, giving the States greater flexibility
in managing the nation's public health agenda.
The National Youth Suicide Prevention Strategy provides
funding for counselling services, information programmes,
education and research. The Commonwealth also provides
funding under the National Mental Health Strategy to
accelerate the transfer of mental health services out
of stand-alone psychiatric institutions into the acute
hospital and community care systems, and for innovative
mental health projects of national significance.
Health
Support Services
These services include:
- provision of a range of blood products from Australian
sourced plasma, through a commercial contract with
Commonwealth Serum Laboratories Limited;
- the annual operating and capital costs of the Red Cross
Society's Blood Transfusion Service which are shared
by the States and the Commonwealth;
- health support services under the National Rural and
Remote Health Support programme: aero-medical services
to rural and remote communities by the Royal Flying
Doctor Service; training of medical professionals
under the Advanced Specialist Training Post programme
and university departments of rural health; innovative
delivery of health services to rural and remote communities;
and rural health research;
- the provision of a range of hearing services through
the Australian Hearing Services Authority and private
sector providers, to eligible pensioners and all people
under the age of 21 years. Increased consumer choice
in hearing services will be available in 1997-98 with
the planned introduction of a voucher funding system;
- the Therapeutic Goods Administration (TGA), which is
responsible for ensuring the safety and effectiveness
of therapeutic goods available in Australia. The TGA
currently recovers a large proportion of its costs
from the therapeutic goods industry. This will increase
to 100 per cent by 1998-99;
- medical assessments of Commonwealth personnel and applicants
for Commonwealth income support payments by the Australian
Government Health Service (AGHS). The AGHS is scheduled
to become a Commonwealth owned company by 1 July 1997;
and
- the development and maintenance of appropriate food
standards for Australia and New Zealand by the Australia
New Zealand Food Authority.
5.7 General
Administration
-
|
-
|
-
|
- 1996-97
|
- 1997-98
|
- 1998-99
|
- 1999-00
|
- 2000-01
|
-
|
-
|
-
|
- Estimate
|
- Budget
|
- Estimate
|
- Estimate
|
- Estimate
|
-
|
- Department of Health and Family Services
|
- $m
|
- 173.9
|
- 192.7
|
- 179.4
|
- 143.7
|
- 148.6
|
-
|
-
|
- %
|
-
|
- 10.8
|
- -6.9
|
- -19.9
|
- 3.4
|
-
|
- Department of Veterans' Affairs
|
- $m
|
- 33.1
|
- 35.4
|
- 29.6
|
- 30.1
|
- 30.7
|
-
|
-
|
- %
|
-
|
- 6.9
|
- -16.4
|
- 1.7
|
- 2.0
|
-
|
- TOTAL
|
- $m
|
- 207.0
|
- 228.2
|
- 209.0
|
- 173.8
|
- 179.3
|
-
|
-
|
- %
|
-
|
- 10.2
|
- -8.4
|
- -16.8
|
- 3.2
|
Outlays under this subfunction comprise part of the
general administrative and capital expenses of the
Department of Health and Family Services (DHFS) and
the Department of Veterans' Affairs.
Department
of Health and Family Services
This item comprises a proportion of the operating costs
of DHFS. The balance of the operating costs of DHFS
is classified under 6.
Social Security and Welfare.
6. Social
Security and Welfare
Nature
of Outlays
Most social security assistance is provided in the
form of benefits paid directly to recipients and/or
families who satisfy eligibility criteria. Payments
are generally indexed to movements in the Consumer
Price Index to maintain their real value.
This function also includes funding for a wide range
of welfare services for people with special needs.
These services are provided directly or through State
and local government authorities and voluntary agencies.
They include services to the aged and people with disabilities,
a variety of child care services and advancement programmes
for Aboriginal and Torres Strait Islander peoples.
Not included under this function is assistance provided
indirectly through the personal income tax system.
This assistance includes concessional income tax rebates
for pensioners and beneficiaries; dependent spouse
rebates, family tax assistance and sole parent rebates
which mainly assist low to middle income families;
and deductions allowed for gifts to certain welfare
bodies which provide indirect assistance to the organisations
concerned.
This function includes outlays of the following portfolios:
- Social Security;
- Veterans' Affairs;
- Health and Family Services;
- Treasury;
- Immigration and Multicultural Affairs;
- Transport and Regional Development;
- Employment, Education, Training and Youth Affairs;
and
- Prime Minister and Cabinet (Aboriginal and Torres Strait
Islander Affairs).
Chart 1. Overview of Commonwealth Outlays on
Social
Security
(1989-90 prices
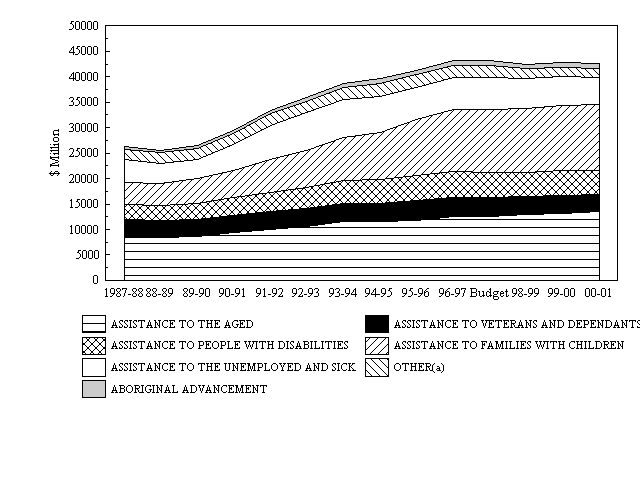
(a) 'Other' includes Other Welfare Programmes; General
Administration and Recoveries and Repayments
Trends
in Social Security and Welfare Outlays
Priorities within the Social Security and Welfare function
have over time moved away from universal provision
of benefits towards means-tested benefits targeted
to those most in need. At the same time, measures have
been introduced to increase the adequacy of payments
and to enhance incentives for self-help.
Policy changes have sought to:
- expand the capacity of people to meet their own needs
through strategies to maximise private income and use
of assets, such as improved arrangements for the collection
of child support payments from the non-custodial parent
and deeming income from financial assets;
- direct new spending initiatives towards areas of greatest
need - for example, increased assistance to families
with children, focusing in particular on low income
families;
- improve the targeting of assistance, including the
means testing of payments to families and the introduction
of a 2 year waiting period for most social security
payments for newly arrived immigrants, other than refugees
and humanitarian migrants;
- minimise incorrect receipt of entitlements through
the introduction of initiatives such as data matching
with the Australian Taxation Office and measures to
tighten administration of the activity test for receipt
of Newstart Allowance;
- encourage sole parents and the unemployed to enter
or re-enter the labour market, particularly through
the provision of assistance for child care, and the
introduction of specific programmes for the long-term
unemployed and sole parents; and
- introduce a more active approach for those on Disability
Support Pension to improve the workforce attachment
of people with disabilities.
The major factors contributing to growth in outlays
over the past decade have been the indexation of pensions
and benefits; growth in client numbers in demand driven
programmes; and changes in outlays resulting from Government
policy initiatives.
Of particular interest is the growth in outlays between
1989-90 and 1993-94. Major contributors to this were:
- increases in unemployment outlays, largely as a result
of a deterioration in economic conditions; and
- increases in the real level of assistance, such as
higher rates of payment and the introduction of supplementary
payments, for clients such as families with children,
people with disabilities and the aged.
The main outlays expected to contribute to growth over
the budget and forward years include assistance to
families with children (including the Family Tax Payment
component of the Family Tax Initiative), assistance
to the aged and Aboriginal advancement programmes.
1997-98
And Forward Estimates
-
|
-
|
-
|
- 1996-97
|
- 1997-98
|
- 1998-99
|
- 1999-00
|
- 2000-01
|
-
|
-
|
-
|
- Estimate
|
- Budget
|
- Estimate
|
- Estimate
|
- Estimate
|
- 6.1
|
- Assistance to the Aged
|
- $m
|
- 14455.3
|
- 14791.9
|
- 15588.4
|
- 16415.8
|
- 17114.8
|
-
|
-
|
- %
|
-
|
- 2.3
|
- 5.4
|
- 5.3
|
- 4.3
|
- 6.2
|
- Assistance to Veterans and Dependants
|
- $m
|
- 4468.5
|
- 4371.7
|
- 4349.9
|
- 4338.3
|
- 4292.9
|
-
|
-
|
- %
|
-
|
- -2.2
|
- -0.5
|
- -0.3
|
- -1.0
|
- 6.3
|
- Assistance to People with Disabilities
|
- $m
|
- 5895.0
|
- 5798.0
|
- 5756.5
|
- 6032.1
|
- 6149.9
|
-
|
-
|
- %
|
-
|
- -1.6
|
- -0.7
|
- 4.8
|
- 2.0
|
- 6.4
|
- Assistance to Families with Children
|
- $m
|
- 14005.6
|
- 14707.6
|
- 15076.6
|
- 15823.3
|
- 16323.0
|
-
|
-
|
- %
|
-
|
- 5.0
|
- 2.5
|
- 5.0
|
- 3.2
|
- 6.5
|
- Assistance to the Unemployed and Sick
|
- $m
|
- 7326.9
|
- 7515.3
|
- 7223.6
|
- 7014.9
|
- 6914.0
|
-
|
-
|
- %
|
-
|
- 2.6
|
- -3.9
|
- -2.9
|
- -1.4
|
- 6.6
|
- Other Welfare Programmes
|
- $m
|
- 1121.7
|
- 852.0
|
- 778.4
|
- 771.8
|
- 770.2
|
-
|
-
|
- %
|
-
|
- -24.0
|
- -8.6
|
- -0.8
|
- -0.2
|
- 6.7
|
- Aboriginal Advancement Programmes nec
|
- $m
|
- 974.2
|
- 1061.0
|
- 1113.9
|
- 1138.4
|
- 1161.6
|
-
|
-
|
- %
|
-
|
- 8.9
|
- 5.0
|
- 2.2
|
- 2.0
|
- 6.8
|
- General Administration
|
- $m
|
- 1767.6
|
- 1919.2
|
- 1697.6
|
- 1573.5
|
- 1569.0
|
-
|
-
|
- %
|
-
|
- 8.6
|
- -11.5
|
- -7.3
|
- -0.3
|
- 6.9
|
- Recoveries and Repayments
|
- $m
|
- -62.1
|
- -78.5
|
- -89.3
|
- -89.3
|
- -89.3
|
-
|
-
|
- %
|
-
|
- 26.4
|
- 13.8
|
- -
|
- -
|
-
|
- TOTAL
|
- $m
|
- 49952.8
|
- 50938.3
|
- 51495.7
|
- 53018.9
|
- 54206.1
|
-
|
-
|
- %
|
-
|
- 2.0
|
- 1.1
|
- 3.0
|
- 2.2
|
6.1 Assistance
to the Aged
-
|
-
|
-
|
- 1996-97
|
- 1997-98
|
- 1998-99
|
- 1999-00
|
- 2000-01
|
-
|
-
|
-
|
- Estimate
|
- Budget
|
- Estimate
|
- Estimate
|
- Estimate
|
-
|
- Age Pension and Allowances
|
- $m
|
- 13258.3
|
- 13468.6
|
- 14167.1
|
- 14884.2
|
- 15491.7
|
-
|
-
|
- %
|
-
|
- 1.6
|
- 5.2
|
- 5.1
|
- 4.1
|
-
|
- Aged Persons' Hostels
|
- $m
|
- 626.1
|
- 667.5
|
- 685.5
|
- 722.5
|
- 748.1
|
-
|
-
|
- %
|
-
|
- 6.6
|
- 2.7
|
- 5.4
|
- 3.5
|
-
|
- Home and Community Care and Community Aged Care Packages
|
- $m
|
- 412.0
|
- 458.6
|
- 509.0
|
- 556.4
|
- 607.9
|
-
|
-
|
- %
|
-
|
- 11.3
|
- 11.0
|
- 9.3
|
- 9.3
|
-
|
- Partner Pension
|
- $m
|
- 159.0
|
- 197.1
|
- 226.9
|
- 252.7
|
- 267.1
|
-
|
-
|
- %
|
-
|
- 24.0
|
- 15.1
|
- 11.4
|
- 5.7
|
-
|
- TOTAL
|
- $m
|
- 14455.3
|
- 14791.9
|
- 15588.4
|
- 16415.8
|
- 17114.8
|
-
|
-
|
- %
|
-
|
- 2.3
|
- 5.4
|
- 5.3
|
- 4.3
|
Outlays provide income support for aged people and
their dependants, residential care for those aged people
who are unable to live at home but who do not require
intensive nursing care, and community care alternatives
for those frail aged and younger people with a disability
for whom long-term residential accommodation would
be inappropriate.
Age
Pension and Allowances
Age Pension is payable to women aged 60.5 years and
over (increasing to 65 years by 2014) and to men aged
65 years and over, subject to residency requirements
and income and assets tests. Pensioners (as well as
allowance recipients and some family payment recipients)
may also qualify for Rent Assistance if they are renting
privately.
Aged
Persons' Hostels
The Commonwealth pays subsidies for personal care and
respite care for aged or disabled persons in approved
residential care facilities. In 1997-98, nursing homes
and hostels will be brought together under one set
of residential care service arrangements. The expenditures
shown here are those related to the lower levels of
personal care provided by services currently classified
as hostels. Funding for more intensive assistance is
shown under the Health Function (see 5.4
Residential Care Subsidies and Domiciliary Care Services).
Home
and Community Care and Community Aged Care Packages
The Commonwealth, in conjunction with the States, funds
a range of services for frail aged and younger people
with a disability at risk of institutionalisation to
enable them to continue to live in their own homes.
Funding for Home and Community Care (HACC) is shared
with the States (see also 5.4
Residential Care Subsidies and Domiciliary Care Services).
The level of Commonwealth funds made available for
the HACC program each year increases by six per cent
(in real terms), with some adjustment of this rate
for expected changes in the level of user charging.
Funding for Community Aged Care Packages is growing
at an even higher rate as the number of Packages grows
towards the target of ten per thousand people aged
70 and over.
Partner
Pension
Partner Pension is paid to partners (of pensioners)
born on or before 1 July 1955 who have no recent workforce
experience and no dependent children.
6.2 Assistance
to Veterans and Dependants
-
|
-
|
-
|
- 1996-97
|
- 1997-98
|
- 1998-99
|
- 1999-00
|
- 2000-01
|
-
|
-
|
-
|
- Estimate
|
- Budget
|
- Estimate
|
- Estimate
|
- Estimate
|
-
|
- Disability Pensions and Allowances
|
- $m
|
- 1823.2
|
- 1841.7
|
- 1872.9
|
- 1914.0
|
- 1934.4
|
-
|
-
|
- %
|
-
|
- 1.0
|
- 1.7
|
- 2.2
|
- 1.1
|
-
|
- Service Pensions
|
- $m
|
- 2626.1
|
- 2511.1
|
- 2461.1
|
- 2407.7
|
- 2347.1
|
-
|
-
|
- %
|
-
|
- -4.4
|
- -2.0
|
- -2.2
|
- -2.5
|
-
|
- Other
|
- $m
|
- 19.3
|
- 18.9
|
- 15.9
|
- 16.7
|
- 11.4
|
-
|
-
|
- %
|
-
|
- -2.1
|
- -15.9
|
- 5.0
|
- -31.7
|
-
|
- TOTAL
|
- $m
|
- 4468.5
|
- 4371.7
|
- 4349.9
|
- 4338.3
|
- 4292.9
|
-
|
-
|
- %
|
-
|
- -2.2
|
- -0.5
|
- -0.3
|
- -1.0
|
Outlays provide income support and compensation, in
the form of pensions, to veterans and their dependants
for incapacity or death resulting from war or defence
service. The number of veterans is declining, resulting
in reduced outlays on Service Pensions. However, due
to veterans' increased mortality and worsening of their
war-caused disabilities, outlays on War Widows' Pensions
and on Disability Pensions and Allowances is increasing.
Disability
Pensions and Allowances
Disability pensions and allowances are paid to ex-service
men and women for service-related incapacities at rates
which vary with the level of incapacity. War Widows'
Pension is payable to the widow(er)s of veterans, peacekeepers,
mariners and defence personnel whose death was service-related
(and in certain other limited circumstances). Disability
Pension and Allowances and War Widows' Pension are
not subject to personal income tax or income and assets
tests.
Service
Pensions
These are payable to veterans who have qualifying service,
and are of qualifying age (60 years for men and 55.5
years for women, increasing to age 60 by 2014), or
who are incapacitated for work. Service Pension carries
the same rates and range of additional payments as
the Age Pension. It also has the same income test
as the Age Pension, except that any Disability Pension
and related allowances received are not regarded as
income for these purposes.
Other
This item includes grants to veterans' associations
and to community groups in relation to non-institutional
care and hostel accommodation for veterans.
6.3 Assistance
to People with Disabilities
-
|
-
|
-
|
- 1996-97
|
- 1997-98
|
- 1998-99
|
- 1999-00
|
- 2000-01
|
-
|
-
|
-
|
- Estimate
|
- Budget
|
- Estimate
|
- Estimate
|
- Estimate
|
-
|
- Disability Support Pension and Allowances
|
- $m
|
- 5193.9
|
- 5074.9
|
- 5032.8
|
- 5286.3
|
- 5384.5
|
-
|
-
|
- %
|
-
|
- -2.3
|
- -0.8
|
- 5.0
|
- 1.9
|
-
|
- Other Payments to People with Disabilities
|
- $m
|
- 40.2
|
- 45.7
|
- 51.1
|
- 57.2
|
- 63.8
|
-
|
-
|
- %
|
-
|
- 13.7
|
- 11.8
|
- 11.9
|
- 11.5
|
-
|
- Disability and Rehabilitation Services
|
- $m
|
- 660.9
|
- 677.4
|
- 672.5
|
- 688.6
|
- 701.7
|
-
|
-
|
- %
|
-
|
- 2.5
|
- -0.7
|
- 2.4
|
- 1.9
|
-
|
- TOTAL
|
- $m
|
- 5895.0
|
- 5798.0
|
- 5756.5
|
- 6032.1
|
- 6149.9
|
-
|
-
|
- %
|
-
|
- -1.6
|
- -0.7
|
- 4.8
|
- 2.0
|
Outlays provide means tested income support to people
with disabilities as well as partners and carers of
people with disabilities, assistance with labour force
related transport costs, and services which increase
the independence and employment opportunities for people
with disabilities. Payments are made to the States
under the Commonwealth State Disability Agreement (CSDA)
for accommodation and related services. The current
CSDA expires on 30 June 1997 and negotiations are underway
for a second agreement.
Disability
Support Pension
Eligibility for the Disability Support Pension requires
at least a 20 per cent level of medical impairment
and a continuing inability to work or undertake educational
or vocational training within the following two years.
Disability support pensioners are assessed with a view
to their undertaking suitable training, rehabilitation
or job search (where appropriate), to increase their
chances of employment.
Other
Payments to People with Disabilities
Mobility Allowance is payable to people with a disability
who are in employment, vocational training, a combination
of work or training, or voluntary work and who are
unable to use public transport without substantial
assistance. Disability Wage Supplement provides supplementary
assistance to people with a disability working under
the Supported Wages System administered by the Department
of Health and Family Services.
Disability
and Rehabilitation Services
The CSDA delineates the roles and responsibilities
of the Commonwealth and the States. The States provide
accommodation and support services with funding assistance
from the Commonwealth through specific purpose grants.
Assistance directed at helping people with a disability
to gain employment is provided by the Commonwealth
under this agreement through the Disability Services
Programme. The Commonwealth Rehabilitation Service
provides vocational rehabilitation programmes to people
with disabilities who are of working age.
6.4 Assistance
to Families with Children
-
|
-
|
-
|
- 1996-97
|
- 1997-98
|
- 1998-99
|
- 1999-00
|
- 2000-01
|
-
|
-
|
-
|
- Estimate
|
- Budget
|
- Estimate
|
- Estimate
|
- Estimate
|
-
|
- Family Payments
|
- $m
|
- 6305.0
|
- 6428.6
|
- 6516.7
|
- 6706.9
|
- 6812.4
|
-
|
-
|
- %
|
-
|
- 2.0
|
- 1.4
|
- 2.9
|
- 1.6
|
-
|
- Sole Parent Pensions and Allowances
|
- $m
|
- 3010.5
|
- 2176.9
|
- -
|
- -
|
- -
|
-
|
-
|
- %
|
-
|
- -27.7
|
- -100.0
|
- na
|
- na
|
-
|
- Parenting Allowance
|
- $m
|
- 2258.6
|
- 1647.4
|
- -
|
- -
|
- -
|
-
|
-
|
- %
|
-
|
- -27.1
|
- -100.0
|
- na
|
- na
|
-
|
- Parenting Payment
|
- $m
|
- -
|
- 1636.8
|
- 5741.4
|
- 6078.8
|
- 6390.4
|
-
|
-
|
- %
|
-
|
- na
|
- na
|
- 5.9
|
- 5.1
|
-
|
- Family Tax Payment
|
- $m
|
- 292.1
|
- 573.1
|
- 573.1
|
- 595.1
|
- 573.1
|
-
|
-
|
- %
|
-
|
- 96.2
|
- -
|
- 3.8
|
- -3.7
|
-
|
- Other Child Payments
|
- $m
|
- 239.5
|
- 257.0
|
- 263.1
|
- 288.5
|
- 291.1
|
-
|
-
|
- %
|
-
|
- 7.3
|
- 2.4
|
- 9.7
|
- 0.9
|
-
|
- Maternity Allowance
|
- $m
|
- 196.6
|
- 183.7
|
- 171.8
|
- 218.6
|
- 218.0
|
-
|
-
|
- %
|
-
|
- -6.6
|
- -6.5
|
- 27.2
|
- -0.3
|
-
|
- Child Care
|
- $m
|
- 1086.8
|
- 1133.6
|
- 1141.8
|
- 1235.8
|
- 1307.2
|
-
|
-
|
- %
|
-
|
- 4.3
|
- 0.7
|
- 8.2
|
- 5.8
|
-
|
- Child Care Cash Rebate - HIC Running Costs
|
- $m
|
- 15.4
|
- 12.8
|
- 0.9
|
- -
|
- -
|
-
|
-
|
- %
|
-
|
- -16.9
|
- -93.0
|
- -100.0
|
- na
|
-
|
- Other
|
- $m
|
- 601.2
|
- 657.7
|
- 667.8
|
- 699.6
|
- 730.9
|
-
|
-
|
- %
|
-
|
- 9.4
|
- 1.5
|
- 4.8
|
- 4.5
|
-
|
- TOTAL
|
- $m
|
- 14005.6
|
- 14707.6
|
- 15076.6
|
- 15823.3
|
- 16323.0
|
-
|
-
|
- %
|
-
|
- 5.0
|
- 2.5
|
- 5.0
|
- 3.2
|
Outlays under this subfunction are mainly to ensure
that families with children receive financial assistance
towards the support of their children. This assistance
is tailored to various groups, in particular, children
in low income families. Assistance is also provided
to sole parents in recognition of the difficulties
they face in combining responsibility for dependent
children with paid employment and of the additional
cost of children in sole parent families.
Family
Payment
Family Payment (FP) is a non-taxable means tested payment
to families with children under the age of 16 years
and certain full-time dependent students aged 16-18
years. FP has two components: minimum rate and above
minimum rate FP. Minimum rate FP is payable to families
with taxable incomes up to around $66,000 (for those
with one child).
Above minimum rate FP is an additional amount paid
to low income families. A higher rate is payable for
each child aged 13-15 years. Rates may also be higher
for recipients who receive Rent Assistance and/or Guardian
Allowance.
The Sole Parent Pension is a means tested payment
to sole parents with a child under 16 years of age,
or aged 16 to 24 years and eligible for a Child Disability
Allowance (CDA). Sole parents are also eligible for
Guardian Allowance. Sole Parent Pension will be amalgamated
into a new Parenting Payment. (See Parenting Allowance
below.)
The Parenting Allowance is paid to spouses who care
for children aged under 16 years of age at home. The
Parenting Allowance has two payment components: a non-taxable
component (basic Parenting Allowance) based on the
claimant's personal income only, and a taxable component
(additional Parenting Allowance) based on the income
and assets of each partner.
The Government has decided in this Budget to introduce
a new Parenting Payment in place of Sole Parent Pension
and Parenting Allowance. This is to be introduced
from March 1998 and will establish a single income
support payment for those with child rearing responsibilities.
Family Tax Payment (FTP). The Family Tax Initiative
commenced on 1 January 1997. It provides additional
assistance to families with children through tax concessions
(Family Tax Assistance), or fortnightly cash payments
(FTP) to low income families.
FTP is paid as a non-taxable payment to families with
dependent children up to the age of 16 years and dependent
secondary students up to 18 years. It is available
as an extra fortnightly cash payment to all families
whose taxable incomes entitle them to above minimum
rate Family Payment.
Other Child Payments cover outlays on Child Disability
Allowance and Double Orphan Pension. (Double Orphan
Pension is paid to a person who has care of a child
whose parents have both died, and in certain other
limited circumstances.) These payments are made fortnightly
with Family Payment. Neither is means tested or taxable.
Maternity Allowance is a non-taxable lump sum amount
paid on the birth of a child to families who meet the
eligibility requirements for minimum rate FP. From
1 January 1998 Maternity Allowance will be paid in
two instalments, one upon the birth of a child, and
a further instalment at 18 months, receipt of which
will be linked to immunisation of the child.
Child
Care
The main forms of Commonwealth assistance for child
care are:
- income tested Childcare Assistance to eligible families
using approved services including non-profit community
based, private and employer sponsored services. To
ensure assistance is targeted to working parents, Childcare
Assistance for non work related care will be limited
to 20 hours per week per child, from January 1998;
- a Childcare Cash Rebate to families using formal or
informal child care for work-related purposes; and
- operational subsidies paid to support family day care
services, occasional care and community based long
day care centres. These subsidies will no longer be
paid to community based long day care centres after
June 1997. Capital subsidies paid to non-profit community
based services are reducing in line with the completion
of the joint National Child Care Strategy. Child care
is provided for sole parents participating in the Jobs,
Education and Training (JET) programme. Funding is
also provided to assist other special needs groups.
Child
Care - Outlays by Funding Type
-
|
- 1996-97
|
- 1997-98
|
- 1998-99
|
- 1999-00
|
- 2000-01
|
|
|
- Estimate
|
- Budget
|
- Estimate
|
- Estimate
|
- Estimate
|
-
|
- $m
|
- $m
|
- $m
|
- $m
|
- $m
|
- Childcare Assistance
|
- 718.8
|
- 765.4
|
- 801.7
|
- 891.2
|
- 956.2
|
- Childcare Cash Rebate
|
- 131.0
|
- 145.5
|
- 145.2
|
- 153.5
|
- 167.6
|
- Operational Subsidies
|
- 143.4
|
- 98.1
|
- 89.8
|
- 97.7
|
- 99.2
|
- JET - Sole Parents
|
- 9.8
|
- 11.4
|
- 11.3
|
- 11.3
|
- 11.5
|
- Capital Funding
|
- 15.3
|
- 28.0
|
- 18.7
|
- 12.2
|
- 2.2
|
- Other (a)
|
- 68.5
|
- 85.2
|
- 75.1
|
- 69.9
|
- 70.5
|
-
|
-
|
-
|
-
|
-
|
-
|
- TOTAL
|
- 1,086.8
|
- 1,133.6
|
- 1,141.8
|
- 1,235.8
|
- 1,307.2
|
- (a) Mainly Special Services, Supplementary Services,
Programme Support, Accreditation and innovative service
strategy.
Other
Outlays provide for the Child Support Agency (CSA)
in the Australian Taxation Office and include expected
payments from the Child Support Trust Account to parents
with custody of children. Child Support payments collected
from non custodial parents are paid into this Trust
Account but are classified as revenue.
Funding is also included for the Australian Institute
of Family Studies for research into matters affecting
family well-being.
6.5 Assistance
to the Unemployed and Sick
-
|
-
|
-
|
- 1996-97
|
- 1997-98
|
- 1998-99
|
- 1999-00
|
- 2000-01
|
-
|
-
|
-
|
- Estimate
|
- Budget
|
- Estimate
|
- Estimate
|
- Estimate
|
-
|
- Newstart Allowance
|
- $m
|
- 6087.5
|
- 7012.8
|
- 6719.4
|
- 6516.9
|
- 6417.1
|
-
|
-
|
- %
|
-
|
- 15.2
|
- -4.2
|
- -3.0
|
- -1.5
|
-
|
- Job Search Allowance
|
- $m
|
- 726.0
|
- -
|
- -
|
- -
|
- -
|
-
|
-
|
- %
|
-
|
- -100.0
|
- na
|
- na
|
- na
|
-
|
- Sickness Allowance
|
- $m
|
- 156.1
|
- 135.9
|
- 134.0
|
- 132.9
|
- 129.6
|
-
|
-
|
- %
|
-
|
- -12.9
|
- -1.4
|
- -0.8
|
- -2.5
|
-
|
- Partner Allowance
|
- $m
|
- 357.3
|
- 366.7
|
- 370.2
|
- 365.1
|
- 367.2
|
-
|
-
|
- %
|
-
|
- 2.6
|
- 1.0
|
- -1.4
|
- 0.6
|
-
|
- TOTAL
|
- $m
|
- 7326.9
|
- 7515.3
|
- 7223.6
|
- 7014.9
|
- 6914.0
|
-
|
-
|
- %
|
-
|
- 2.6
|
- -3.9
|
- -2.9
|
- -1.4
|
Income support is provided to persons who are unemployed
or unable to work because of temporary incapacity and
who have limited alternative means of support. The
decline in outlays from 1998-99 is based on lower expected
client numbers as a result of an anticipated improvement
in economic conditions.
From September 1996, Job Search Allowance and Newstart
Allowance (NSA) were merged into one payment, called
Newstart Allowance. The merged NSA is available to
men and women below Age Pension age who are unemployed
and who are capable of undertaking, and actively seeking,
work. Partners of recipients are required to test their
eligibility for a payment in their own right. The
aim of NSA is to support and require active job search
or participation in appropriate training or other job
preparation activities.
Other payments classified under Newstart Allowance
are the Mature Age Allowance and the Youth Training
Allowance. The Mature Age Allowance allows unemployed
people aged 60 to Age Pension age, who have no recent
workforce experience, to transfer to an allowance with
no job search requirements. Youth Training Allowance
is paid to young unemployed people under the age of
18 years, but above minimum school leaving age, who
are undertaking approved education, training or job
search activities.
Sickness Allowance (SA) is paid to people who are employed
(or studying full-time) and have suffered a loss of
income due to temporary illness or incapacity. SA
payments are generally limited to 12 months.
Partner Allowance is paid to partners of income support
allowance recipients who were born on or before 1 July
1955, who have no dependent children aged under 16
years and have no recent workforce experience.
6.6 Other
Welfare Programmes
-
|
-
|
-
|
- 1996-97
|
- 1997-98
|
- 1998-99
|
- 1999-00
|
- 2000-01
|
-
|
-
|
-
|
- Estimate
|
- Budget
|
- Estimate
|
- Estimate
|
- Estimate
|
-
|
- Special Benefit
|
- $m
|
- 137.9
|
- 110.3
|
- 93.0
|
- 94.6
|
- 94.9
|
-
|
-
|
- %
|
-
|
- -20.0
|
- -15.7
|
- 1.7
|
- 0.3
|
-
|
- Other Assistance to Widows
|
- $m
|
- 408.5
|
- 286.4
|
- 257.1
|
- 251.1
|
- 241.7
|
-
|
-
|
- %
|
-
|
- -29.9
|
- -10.2
|
- -2.3
|
- -3.7
|
-
|
- Accommodation Assistance
|
- $m
|
- 196.9
|
- 196.8
|
- 193.8
|
- 191.8
|
- 195.1
|
-
|
-
|
- %
|
-
|
- -0.1
|
- -1.5
|
- -1.0
|
- 1.7
|
-
|
- Asylum Seeker Assistance
|
- $m
|
- 14.0
|
- 11.8
|
- 3.8
|
- 3.9
|
- 4.0
|
-
|
-
|
- %
|
-
|
- -15.7
|
- -67.8
|
- 2.6
|
- 2.6
|
-
|
- Migrant Settlement Support
|
- $m
|
- 54.2
|
- 59.3
|
- 59.8
|
- 60.7
|
- 61.6
|
-
|
-
|
- %
|
-
|
- 9.4
|
- 0.8
|
- 1.5
|
- 1.5
|
-
|
- Communication Allowances and Postal Concessions
|
- $m
|
- 21.2
|
- 25.5
|
- 25.6
|
- 25.6
|
- 25.7
|
-
|
-
|
- %
|
-
|
- 20.3
|
- 0.4
|
- -
|
- 0.4
|
-
|
- Other
|
- $m
|
- 289.0
|
- 161.8
|
- 145.2
|
- 144.1
|
- 147.4
|
-
|
-
|
- %
|
-
|
- -44.0
|
- -10.3
|
- -0.8
|
- 2.3
|
-
|
- TOTAL
|
- $m
|
- 1121.7
|
- 852.0
|
- 778.4
|
- 771.8
|
- 770.2
|
-
|
-
|
- %
|
-
|
- -24.0
|
- -8.6
|
- -0.8
|
- -0.2
|
This subfunction comprises a number of related programme
elements with the following objectives:
- income support to people in special circumstances;
- income supplements and/or concessions for people facing
certain additional costs;
- increased access to accommodation for low income earners
and the homeless through the provision of recurrent
and capital funds in conjunction with the States and
Territories; and
- emergency relief funds paid through charitable agencies
for people who are in financial crisis.
Special
Benefit
This item comprises Special Benefit and Disaster Relief
Payment. Special Benefit is paid to people who are
unable to earn a sufficient livelihood for themselves
and their dependants, who are ineligible for any other
pension or allowance and who can prove hardship. Disaster
Relief Payment is a one-off payment available to victims
of declared major disasters.
Other
Assistance to Widows
This item comprises the Class B Widow Pension, the
Bereavement Allowance and the Widow Allowance. Class
B Widow Pension is payable to previously married women
who do not have dependent children and who were aged
50 years or more, or were sole parent pensioners aged
45 years or more, at 1 July 1987.
Bereavement Allowance is payable to recently widowed
persons who do not have dependent children. Widow Allowance
is payable to women 50 years or over who become widowed,
divorced or separated after reaching 40, and who have
no recent workforce experience.
Accommodation
Assistance
Accommodation Assistance comprises a number of programmes
targeted at those in short-term housing crisis. The
Supported Accommodation Assistance Programme (SAAP),
in conjunction with the States, funds transitional
support services for those who are homeless as a result
of a crisis.
The Crisis Accommodation Programme (CAP) provides for
the purchase, construction, renovation or leasing of
dwellings to provide transitional accommodation for
SAAP clients. CAP is funded under the Commonwealth-State
Housing Agreement (see 7.
Housing and Community Amenities).
The Emergency Relief Programme provides grants to non-government
community welfare agencies for distribution as short-term
emergency assistance to people in financial crisis.
Asylum
Seeker Assistance
Assistance is provided to destitute onshore refugee
applicants awaiting a primary decision from six months
after initial lodgement of their application.
Migrant
Settlement Support
The Government provides settlement support for migrants
including assistance to relevant community organisations
for provision of services, on-arrival accommodation,
translator and interpreter services, funding for migrant
resource centres, maintenance of unattached humanitarian
children and assistance to voluntary agencies under
the Community Refugee Settlement Scheme.
Other
Included under this heading is reimbursement to the
Australian National Railways Commission for concessional
passenger fares for eligible pensioners and beneficiaries
(see 12.4
Rail Transport). Also included are wage 'top-up'
payments for apprentices and trainees employed under
the new industrial arrangements which provide for the
wage to be paid only for productive time. The top-up
payments ensure that apprentice and trainee incomes
are at guaranteed levels.
6.7 Aboriginal
Advancement NEC
-
|
-
|
-
|
- 1996-97
|
- 1997-98
|
- 1998-99
|
- 1999-00
|
- 2000-01
|
-
|
-
|
-
|
- Estimate
|
- Budget
|
- Estimate
|
- Estimate
|
- Estimate
|
-
|
- Aboriginal and Torres Strait Islander Commission
|
- $m
|
- 813.6
|
- 882.6
|
- 922.8
|
- 948.4
|
- 974.6
|
-
|
-
|
- %
|
-
|
- 8.5
|
- 4.6
|
- 2.8
|
- 2.8
|
-
|
- Torres Strait Regional Authority
|
- $m
|
- 31.7
|
- 34.3
|
- 34.5
|
- 35.7
|
- 36.9
|
-
|
-
|
- %
|
-
|
- 8.2
|
- 0.6
|
- 3.5
|
- 3.4
|
-
|
- Indigenous Land Corporation
|
- $m
|
- 47.1
|
- 48.3
|
- 49.2
|
- 50.5
|
- 51.6
|
-
|
-
|
- %
|
-
|
- 2.5
|
- 1.9
|
- 2.6
|
- 2.2
|
-
|
- Aboriginal Hostels Limited
|
- $m
|
- 28.0
|
- 28.4
|
- 28.6
|
- 28.9
|
- 29.3
|
-
|
-
|
- %
|
-
|
- 1.4
|
- 0.7
|
- 1.0
|
- 1.4
|
-
|
- Aboriginals Benefit Trust Account
|
- $m
|
- 27.3
|
- 33.5
|
- 33.5
|
- 33.5
|
- 33.5
|
-
|
-
|
- %
|
-
|
- 22.7
|
- -
|
- -
|
- -
|
-
|
- Australian Institute of Aboriginal & Torres Strait
Islander Studies
|
- $m
|
- 5.6
|
- 5.7
|
- 5.8
|
- 5.8
|
- 5.9
|
-
|
-
|
- %
|
-
|
- 1.8
|
- 1.8
|
- -
|
- 1.7
|
-
|
- National Native Title Tribunal
|
- $m
|
- 16.1
|
- 23.8
|
- 21.9
|
- 22.3
|
- 22.5
|
-
|
-
|
- %
|
-
|
- 47.8
|
- -8.0
|
- 1.8
|
- 0.9
|
-
|
- Other
|
- $m
|
- 4.9
|
- 4.6
|
- 17.6
|
- 13.2
|
- 7.3
|
-
|
-
|
-
|
-
|
- -6.1
|
- na
|
- -25.0
|
- -44.7
|
-
|
- TOTAL
|
- $m
|
- 974.2
|
- 1061.0
|
- 1113.9
|
- 1138.4
|
- 1161.6
|
-
|
-
|
- %
|
-
|
- 8.9
|
- 5.0
|
- 2.2
|
- 2.0
|
This subfunction mainly covers programmes funded through
a number of indigenous agencies, the largest of which
is the Aboriginal and Torres Strait Islander Commission
(ATSIC). Many of the programmes are intended to supplement,
support or accelerate the delivery of services where
prime responsibility rests with other Commonwealth
agencies and/or State, Territory and local governments.
For other significant outlays on Aboriginal programmes
(see 4.
Education, 5.
Health, 7.
Housing and Community Amenities and 13B.
Labour and Employment Affairs).
Aboriginal
and Torres Strait Islander Commission
ATSIC and Torres Strait Regional Authority (TSRA)
each receive a significant part of their funding through
a largely discretionary global allocation which the
Government has guaranteed until 2000-01. The Government
has required that ATSIC maintain average allocations
for housing and infrastructure at a level at least
equivalent in real terms to its 1995-96 allocation
($210 million). Additional funding is provided outside
the global allocation for the Community Development
Employment Projects (CDEP) Scheme and Native Title
Claims Assistance.
ATSIC's Economic Programme aims to increase the economic
empowerment and relative economic status of Aboriginal
and Torres Strait Islander peoples by providing opportunities
for employment, acquisition of productive assets, income
generation and the development of commercial skills.
The major sub-programme is CDEP. Under CDEP, members
of indigenous communities agree to forgo their entitlement
to unemployment benefits in return for the opportunity
to engage in paid employment in community managed projects.
The projects are funded for the equivalent of the benefits
forgone, plus loadings for oncosts and support, including
capital needs.
ATSIC's Social and Cultural Programme aims to enable
Aboriginal and Torres Strait Islander peoples to lead
independent and healthy lives with full recognition
of their cultural heritage and rights to land. The
programme incorporates policies and programmes in the
areas of community housing and infrastructure, housing
loans, legal services, cultural development and the
administration of native title, land rights and heritage
protection legislation. (For other Aboriginal housing
assistance see 7. Housing and Community Amenities.)
The Torres Strait Regional Authority delivers programmes
in the Torres Strait region which, prior to 1994-95,
were delivered by ATSIC. As with ATSIC, the major
activities are community housing and infrastructure
projects and CDEPs.
The Land Fund and the Indigenous Land Corporation were
established to provide a secure and ongoing source
of funds to the Indigenous Land Corporation for the
purpose of assisting indigenous people to acquire land
and to manage and maintain it in a sustainable way
in order to provide economic, social and cultural benefits
for future generations. Allocations to the Land Fund
are to be maintained in real terms until 2003-04, by
which time the fund should be self-sustaining. The
Fund is a trust fund, administered by ATSIC, within
the Commonwealth Public Account and moneys must be
invested in accordance with s62B of the Audit Act 1901.
Aboriginal Hostels Limited (AHL) aims to assist Aboriginal
and Torres Strait Islander people to satisfy their
health, employment, training, education and aged care
needs by providing a low-cost, temporary accommodation
service through a network of hostels. These hostels
may be either owned and operated directly by AHL or
funded through grants to other organisations.
The Aboriginals Benefit Trust Account (ABTA) is established
under the Aboriginal Land Rights (NT) Act 1976 to receive
the equivalent of royalty moneys received from mining
operations on Aboriginal land in the Northern Territory.
Payments are made from the fund for the benefit of
Aboriginal people directly affected by mining operations,
for other Aboriginal groups in the Northern Territory
and to cover the administrative costs of Northern Territory
land councils.
The Australian Institute of Aboriginal and Torres Strait
Islander Studies (AIATSIS) is funded to undertake and
promote Aboriginal and Torres Strait Islander studies,
to conduct and assist relevant research and the publication
of results, to maintain a cultural resource collection
and to encourage community understanding of Aboriginal
and Torres Strait Islander societies.
The National Native Title Tribunal (NNTT) is established
under the Native Title Act 1993 to receive, register,
accept and notify native title claims, identify parties
whose interests may be affected and to mediate between
the parties in relation to claims, compensation issues
and negotiations over proposed future acts.
Other includes outlays for activities of the Aboriginal
Reconciliation Unit within the Department of Prime
Minister and Cabinet, and financial assistance to the
States, pursuant to the Native Title Act 1993, for
'past act' compensation and the administration of State
native title regimes.
6.8 General
Administration
-
|
-
|
-
|
- 1996-97
|
- 1997-98
|
- 1998-99
|
- 1999-00
|
- 2000-01
|
-
|
-
|
-
|
- Estimate
|
- Budget
|
- Estimate
|
- Estimate
|
- Estimate
|
-
|
- Social Security Portfolio
|
- $m
|
- 1470.9
|
- 1589.9
|
- 1383.2
|
- 1270.8
|
- 1263.9
|
-
|
-
|
- %
|
-
|
- 8.1
|
- -13.0
|
- -8.1
|
- -0.5
|
-
|
- Department of Veterans' Affairs
|
- $m
|
- 194.7
|
- 184.5
|
- 175.1
|
- 169.2
|
- 169.1
|
-
|
-
|
- %
|
-
|
- -5.2
|
- -5.1
|
- -3.4
|
- -0.1
|
-
|
- Department of Health and Family Services
|
- $m
|
- 101.9
|
- 144.8
|
- 139.2
|
- 133.5
|
- 136.0
|
-
|
-
|
- %
|
-
|
- 42.1
|
- -3.9
|
- -4.1
|
- 1.9
|
-
|
- TOTAL
|
- $m
|
- 1767.6
|
- 1919.2
|
- 1697.6
|
- 1573.5
|
- 1569.0
|
-
|
-
|
- %
|
-
|
- 8.6
|
- -11.5
|
- -7.3
|
- -0.3
|
Social
Security Portfolio
The great bulk of outlays associated with the Social
Security portfolio are for the new Commonwealth Services
Delivery Agency (CSDA) which will begin operating from
1 July 1997. The CSDA will become the delivery agency
for:
- income support payments currently administered by the
Department of Social Security;
- the registration, assessment and referral functions
carried out by the Commonwealth Employment Service;
- student assistance payments administered by the Department
of Employment, Education, Training and Youth Affairs;
and
- Childcare Assistance and the Childcare Cash Rebate
administered by the Department of Health and Family
Services, the Department of Social Security and the
Health Insurance Commission.
The CSDA will simplify service delivery arrangements
by providing a one-stop-shop for many Commonwealth
services. Unemployed customers, in particular, will
benefit from having a single point of access to income
support, self-help job search facilities and referral
to employment placement services.
Department
of Veterans' Affairs
General Administration costs for the Department of
Veterans' Affairs (DVA) peaked in 1996-97, mainly reflecting
the cumulative impact of DVA's assumption of greater
administrative responsibility for a wider range of
benefits to the veteran community. It is expected
that, as the Department's client base declines and
ongoing efficiencies begin to take effect, these costs
will fall.
Department
of Health and Family Services
This item comprises a proportion of the operating costs
of the Department of Health and Family Services (HFS).
HFS operating costs include funds for the purchase
of services from the Commonwealth Services Delivery
Agency, for the delivery of Childcare Assistance and
the Childcare Cash Rebate. The balance of the operating
costs of HFS is classified under 5.
Health.
6.9 Recoveries
and Repayments
-
|
-
|
-
|
- 1996-97
|
- 1997-98
|
- 1998-99
|
- 1999-00
|
- 2000-01
|
-
|
-
|
-
|
- Estimate
|
- Budget
|
- Estimate
|
- Estimate
|
- Estimate
|
-
|
- Recoveries and Repayments
|
- $m
|
- -62.1
|
- -78.5
|
- -89.3
|
- -89.3
|
- -89.3
|
-
|
-
|
- %
|
-
|
- 26.4
|
- 13.8
|
- -
|
- -
|
-
|
- TOTAL
|
- $m
|
- -62.1
|
- -78.5
|
- -89.3
|
- -89.3
|
- -89.3
|
-
|
-
|
- %
|
-
|
- 26.4
|
- 13.8
|
- -
|
- -
|
This item includes payments under the Social Security
Agreement between Australia and New Zealand and Miscellaneous
Receipts.
7. Housing
and Community Amenities
Nature
of Outlays
The Housing and Community Amenities function covers
outlays, under Housing, to improve the access to appropriate
housing for those whose needs are inadequately met
through the private rental market or who have difficulty
achieving home ownership.
Housing assistance is provided through the Commonwealth-State
Housing Agreement (CSHA). This, in conjunction with
contributions from the States, assists in funding the
expansion and maintenance of the public rental housing
stock by State governments.
Eligible former and serving members of the Defence
Force who enlisted prior to May 1985 are provided
with home purchase assistance in the form of a home
loan interest subsidy.
Excluded from this function is housing assistance for
income support recipients who rent privately which
is paid through Rent Assistance and transitional support
which is provided to those who are homeless as a result
of crisis (see 6.
Social Security and Welfare).
Community Amenities includes outlays on general promotion
and assistance for urban and regional planning and
development and on promotion of national environmental
objectives.
Additional funding for the conservation, sustainable
use and repair of Australia's natural environment will
be provided through the Natural Heritage Trust. Funding
for this purpose is also provided through 8.4
National Estate and Parks and 10.7
Natural Resources Development and Management.
This function includes outlays of the Social Security,
Environment, Sport and Territories, Transport and Regional
Development, Veterans' Affairs, Industry, Science and
Tourism, and Treasury portfolios.
Chart 1. Overview of Commonwealth Outlays on
Housing
and Community Amenities
(1989-90 prices)
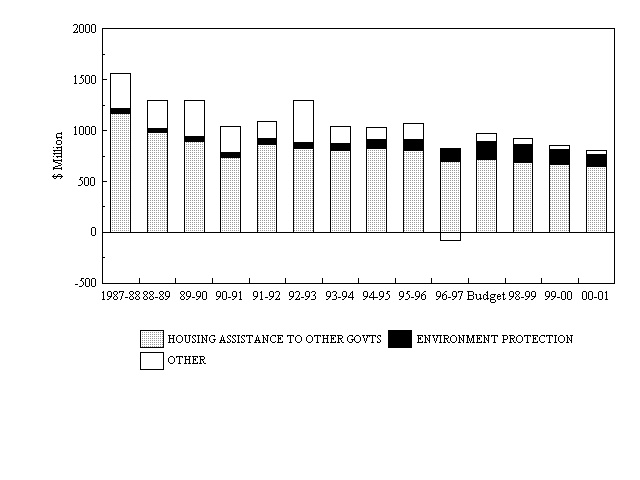
Trends
in Housing and Community Amenities Outlays
There has been a real decrease in outlays on Housing
and Community Amenities over the last decade, mainly
reflecting:
- lower real outlays under the CSHA, especially in 1996-97,
when some States chose to reduce their funding for
public housing as part of their State Fiscal Contributions;
- changes in the level of assistance for home ownership
(provided through the First Home Owners Scheme and
included in Other & Administration), with outlays
peaking in the mid-1980s and phasing out by 1995-96;
and
- increasing outlays for environmental protection.
Outlays were high in 1992-93 due to funding for a short-term
programme to improve the social and economic infrastructure
of local government areas with above-average unemployment.
Outlays on environmental protection will increase as
a result of new programmes to be introduced under the
Natural Heritage Trust.
1997-98
And Forward Estimates
-
|
-
|
-
|
- 1996-97
|
- 1997-98
|
- 1998-99
|
- 1999-00
|
- 2000-01
|
-
|
-
|
-
|
- Estimate
|
- Budget
|
- Estimate
|
- Estimate
|
- Estimate
|
- 7.1
|
- Housing Assistance to Other Governments
|
- $m
|
- 804.1
|
- 850.4
|
- 836.1
|
- 821.7
|
- 818.1
|
-
|
-
|
- %
|
-
|
- 5.8
|
- -1.7
|
- -1.7
|
- -0.4
|
- 7.2
|
- Defence Service Homes
|
- $m
|
- 31.2
|
- 24.9
|
- 25.1
|
- 24.5
|
- 24.6
|
-
|
-
|
- %
|
-
|
- -20.2
|
- 0.8
|
- -2.4
|
- 0.4
|
- 7.3
|
- Urban and Regional Development
|
- $m
|
- -19.4
|
- 35.1
|
- 5.2
|
- -1.9
|
- -4.7
|
-
|
-
|
- %
|
-
|
- na
|
- -85.2
|
- -136.5
|
- 147.4
|
- 7.4
|
- Environment Protection
|
- $m
|
- 145.3
|
- 205.8
|
- 210.7
|
- 187.5
|
- 154.9
|
-
|
-
|
- %
|
-
|
- 41.6
|
- 2.4
|
- -11.0
|
- -17.4
|
- 7.5
|
- Other Housing and Community Amenities
|
- $m
|
- -115.1
|
- 21.8
|
- 28.3
|
- 26.4
|
- 20.4
|
-
|
-
|
- %
|
-
|
- -118.9
|
- 29.8
|
- -6.7
|
- -22.7
|
- 7.6
|
- General Administration
|
- $m
|
- 17.2
|
- 9.3
|
- 5.4
|
- 4.3
|
- 4.3
|
-
|
-
|
- %
|
-
|
- -45.9
|
- -41.9
|
- -20.4
|
- -
|
-
|
- TOTAL
|
- $m
|
- 863.3
|
- 1147.3
|
- 1111.0
|
- 1062.5
|
- 1017.5
|
-
|
-
|
- %
|
-
|
- 32.9
|
- -3.2
|
- -4.4
|
- -4.2
|
7.1 Housing
Assistance to other Governments
-
|
-
|
-
|
- 1996-97
|
- 1997-98
|
- 1998-99
|
- 1999-00
|
- 2000-01
|
-
|
-
|
-
|
- Estimate
|
- Budget
|
- Estimate
|
- Estimate
|
- Estimate
|
-
|
- Nominated Loan Funds - Repayment of Principal
|
- $m
|
- -20.9
|
- -21.8
|
- -22.7
|
- -23.6
|
- -24.5
|
-
|
-
|
- %
|
-
|
- 4.3
|
- 4.1
|
- 4.0
|
- 3.8
|
-
|
- CSHA Loans - Repayment of Principal
|
- $m
|
- -68.2
|
- -70.9
|
- -73.6
|
- -76.3
|
- -79.0
|
-
|
-
|
- %
|
-
|
- 4.0
|
- 3.8
|
- 3.7
|
- 3.5
|
-
|
- CSHA Grants to States
|
- $m
|
- 885.5
|
- 935.4
|
- 924.7
|
- 914.0
|
- 914.0
|
-
|
-
|
- %
|
-
|
- 5.6
|
- -1.1
|
- -1.2
|
- -
|
-
|
- Social Housing Subsidy Programme
|
- $m
|
- 2.1
|
- 2.1
|
- 2.1
|
- 2.1
|
- 2.1
|
-
|
-
|
- %
|
-
|
- -
|
- -
|
- -
|
- -
|
-
|
- Other Grants for Housing
|
- $m
|
- 5.5
|
- 5.5
|
- 5.5
|
- 5.5
|
- 5.5
|
-
|
-
|
- %
|
-
|
- -
|
- -
|
- -
|
- -
|
-
|
- TOTAL
|
- $m
|
- 804.1
|
- 850.4
|
- 836.1
|
- 821.7
|
- 818.1
|
-
|
-
|
- %
|
-
|
- 5.8
|
- -1.7
|
- -1.7
|
- -0.4
|
Nominated
Loan Funds and CSHA Loans - Repayment of Principal
All Commonwealth loan funds that were provided for
public housing purposes, either in the form of CSHA
loans before 1984-85 or as Nominated Loan Council advances
before 1989-90, are repayable in equal annual instalments
over 53 years. Interest is payable at a concessional
rate of 4.5 per cent a year (for further details, see
Interest Revenue in Statement
5).
Commonwealth-State
Housing Agreement Grants to States
Grants under the Commonwealth-State Housing Agreement
(CSHA) cover the acquisition, maintenance and upgrade
of public housing, rental subsidies for low income
tenants in public housing, support for home ownership
assistance, and repayments of principal and interest
on Commonwealth loans for public housing purposes as
well as specific programmes, such as the Aboriginal
Rental Housing Programme and the Crisis Accommodation
Programme (the latter is excluded from the above table
and is reported under 6.6
Other Welfare Programmes). The Agreement also
provides for Commonwealth grants to be supplemented
by State contributions.
An interim CSHA runs from 1 July 1996 to the end of
the 1998-99 financial year, with the States and Territories
being offered Commonwealth funding for the entire period,
on the basis of a commitment to continue negotiating
on reforms. Funding for years beyond 1998-99 will
be negotiated in terms of a new agreement which is
expected to reflect the likely direction of longer
term reforms.
Major improvements in accountability and efficiency
are being implemented in the interim agreement, through
an increased focus on consumer outcomes and improved
performance measurement and reporting.
7.2 Defence
Service Homes
-
|
-
|
-
|
- 1996-97
|
- 1997-98
|
- 1998-99
|
- 1999-00
|
- 2000-01
|
-
|
-
|
-
|
- Estimate
|
- Budget
|
- Estimate
|
- Estimate
|
- Estimate
|
-
|
- Home Acquisition Assistance
|
- $m
|
- 35.3
|
- 26.9
|
- 26.0
|
- 25.4
|
- 25.5
|
-
|
-
|
- %
|
-
|
- -23.8
|
- -3.3
|
- -2.3
|
- 0.4
|
-
|
- Defence Service Homes Insurance
|
- $m
|
- -4.1
|
- -2.0
|
- -0.8
|
- -0.8
|
- -0.8
|
-
|
-
|
- %
|
-
|
- -51.2
|
- -60.0
|
- -
|
- -
|
-
|
- TOTAL
|
- $m
|
- 31.2
|
- 24.9
|
- 25.1
|
- 24.5
|
- 24.6
|
-
|
-
|
- %
|
-
|
- -20.2
|
- 0.8
|
- -2.4
|
- 0.4
|
The Defence Service Homes scheme (DSH) provides home
ownership assistance in the form of subsidised low
interest loans to eligible former and serving members
of the Defence Forces who enlisted prior to May 1985,
or who have certain qualifying service. Housing assistance
for service personnel who enlisted after May 1985 is
classified in 2.
Defence.
Home
Acquisition Assistance
Since 1988-89, the mortgage portfolio and the authority
to make new loans under the scheme has been owned by
the Westpac Banking Corporation. Under the programme,
Westpac receives a subsidy to bridge the difference
between the concessional interest rate paid by DSH
borrowers and an agreed benchmark mortgage rate based
on the standard bank interest rate for new owner-occupied
housing.
7.3 Urban
and Regional Development
In 1996-97 the Commonwealth terminated regional development
programmes to eliminate duplication of State and local
government activities in this area. Residual administrative
costs and other payments made under the programmes,
including repayments of loans from State and local
governments and receipts from the Albury-Wodonga Development
Corporation, are also included in this item.
7.4 Environment
Protection
The Commonwealth has a number of programmes, primarily
administered by the Department of the Environment,
Sport and Territories, for protection of the environment,
including specific measures to monitor and control
the impact of pollution. Financial assistance is provided
to various international and national bodies concerned
with environmental and conservation issues.
Additional funding for the conservation, sustainable
use and repair of Australia's natural environment will
be provided through the Natural Heritage Trust. Additional
funding for this purpose is also provided through 8.4
National Estate and Parks and 10.7
Natural Resources Development and Management.
7.5 Other
Housing and Community Amenities
The main items in this subfunction are the Housing
Loans Insurance Corporation and the Christmas Island
Rebuilding Programme.
The Housing Loans Insurance Corporation is currently
being restructured, and a new Commonwealth company,
Housing Loans Insurance Corporation Limited, will commence
operations in late 1996-97. The Christmas Island Rebuilding
Programme was implemented in 1992-93 to improve the
standard of public housing and to upgrade the Island's
infrastructure to the level of comparable communities
in the rest of Australia.
7.6 General
Administration
Outlays provide for the administration costs for this
function across portfolios, mainly Environment, Sports
and Territories, and Industry, Science and Tourism.
8. Recreation
and Culture
Nature
of Outlays
Funding for broadcasting represents the majority of
recreation and culture outlays (see Chart
1).
Other activities in this function involving outlays
include:
- managing Australia's cultural heritage through national
collection institutions;
- direct financial assistance for the arts and other
cultural activities including the film and television
industries;
- assistance to sport and recreation activities;
- the operations of statutory authorities to manage and
protect, amongst other places, the world heritage areas
of Uluru-Kata Tjuta and Kakadu National Parks and the
- Great Barrier Reef; and
- joint management and funding arrangements for other
world heritage areas in Tasmania and Queensland.
This function includes outlays for major parts of the
following portfolios:
- Communications and the Arts; and
- Environment, Sport and Territories,
in addition to minor components of several other portfolios.
Outlays for this function mainly arise from direct
outlays by Commonwealth agencies. Other avenues of
support include grants programmes, payments to the
States (shown in Budget
Paper No. 3) and taxation expenditures such as
concessions on investments in new films under Division
10BA of the Income Tax Assessment Act 1936.
Chart 1. Overview
of Commonwealth Outlays on Recreation and Culture
(1989-90
prices)
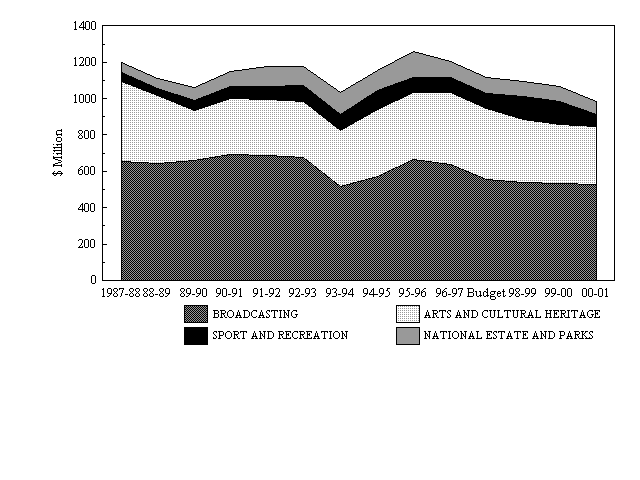
Trends
in Recreation and Culture Outlays
Over the period since 1987-88, trends in outlays have
been primarily influenced by:
- a peak in Arts and Cultural Heritage outlays in 1987-88,
due to increased outlays on Arts and Heritage for the
Bicentennial;
- higher outlays since 1990-91 on the National Estate
and Parks; and
- the effect of one-off receipts in 1993-94 from the
sale of satellite subscription television licences
($199 million), and receipts in 1994-95 from the sale
of the Multipoint Distribution Service Licences ($100
million), which were partially offset by expenditure
relating to the Creative Nation policy statement.
1997-98
and Forward Estimates
-
|
-
|
-
|
- 1996-97
|
- 1997-98
|
- 1998-99
|
- 1999-00
|
- 2000-01
|
-
|
-
|
-
|
- Estimate
|
- Budget
|
- Estimate
|
- Estimate
|
- Estimate
|
- 8.1
|
- Broadcasting
|
- $m
|
- 735.9
|
- 653.6
|
- 652.4
|
- 661.4
|
- 669.3
|
-
|
-
|
- %
|
-
|
- -11.2
|
- -0.2
|
- 1.4
|
- 1.2
|
- 8.2
|
- Arts and Cultural Heritage
|
- $m
|
- 459.6
|
- 462.2
|
- 422.4
|
- 402.4
|
- 405.7
|
-
|
-
|
- %
|
-
|
- 0.6
|
- -8.6
|
- -4.7
|
- 0.8
|
- 8.3
|
- Sport and Recreation
|
- $m
|
- 96.1
|
- 98.1
|
- 151.1
|
- 155.0
|
- 83.2
|
-
|
-
|
- %
|
-
|
- 2.1
|
- 54.0
|
- 2.6
|
- -46.3
|
- 8.4
|
- National Estate and Parks
|
- $m
|
- 102.5
|
- 104.7
|
- 101.7
|
- 101.8
|
- 96.4
|
-
|
-
|
- %
|
-
|
- 2.1
|
- -2.9
|
- 0.1
|
- -5.3
|
-
|
- TOTAL
|
- $m
|
- 1394.0
|
- 1318.6
|
- 1327.6
|
- 1320.7
|
- 1254.6
|
-
|
-
|
- %
|
-
|
- -5.4
|
- 0.7
|
- -0.5
|
- -5.0
|
8.1 Broadcasting
-
|
-
|
-
|
- 1996-97
|
- 1997-98
|
- 1998-99
|
- 1999-00
|
- 2000-01
|
-
|
-
|
-
|
- Estimate
|
- Budget
|
- Estimate
|
- Estimate
|
- Estimate
|
-
|
- Australian Broadcasting Corporation
|
- $m
|
- 531.2
|
- 468.5
|
- 471.7
|
- 477.7
|
- 487.8
|
-
|
-
|
- %
|
-
|
- -11.8
|
- 0.7
|
- 1.3
|
- 2.1
|
-
|
- Special Broadcasting Service
|
- $m
|
- 88.1
|
- 83.0
|
- 79.2
|
- 79.9
|
- 81.0
|
-
|
-
|
- %
|
-
|
- -5.8
|
- -4.6
|
- 0.9
|
- 1.4
|
-
|
- National Transmitting Facilities
|
- $m
|
- 97.7
|
- 83.2
|
- 83.6
|
- 87.3
|
- 83.9
|
-
|
-
|
- %
|
-
|
- -14.8
|
- 0.5
|
- 4.4
|
- -3.9
|
-
|
- Planning and Regulation
|
- $m
|
- 19.0
|
- 18.8
|
- 18.0
|
- 16.6
|
- 16.5
|
-
|
-
|
- %
|
-
|
- -1.1
|
- -4.3
|
- -7.8
|
- -0.6
|
-
|
- Sale of Broadcasting Rights
|
- $m
|
- -0.1
|
- -
|
- -
|
- -
|
- -
|
-
|
-
|
- %
|
-
|
- -100.0
|
- na
|
- na
|
- na
|
-
|
- TOTAL
|
- $m
|
- 735.9
|
- 653.6
|
- 652.4
|
- 661.4
|
- 669.3
|
-
|
-
|
- %
|
-
|
- -11.2
|
- -0.2
|
- 1.4
|
- 1.2
|
The majority of outlays on broadcasting are to fund
the operating and capital needs of the Australian Broadcasting
Corporation (ABC) and the Special Broadcasting Service
(SBS) and national transmitting facilities.
Australian
Broadcasting Corporation
The ABC's activities include domestic radio services,
a national television network, and overseas broadcasting
services. ABC Orchestras are to be transferred to an
ABC subsidiary, Symphony Australia Holdings Pty Ltd,
and their funding is now reflected under the Arts and
Heritage classification. This also reduces the ABC's
funding from 1997-98 by the amount being transferred
to Symphony Australia (see Budget
Paper No. 2 for more details).
Special
Broadcasting Service
The SBS operates a multilingual radio network and a
multicultural television service.
National
Transmitting Facilities
The National Transmission Agency operates and maintains
the transmitting facilities used for the delivery of
ABC and SBS radio and television services and some
regional commercial services.
Planning
and Regulation
The Australian Broadcasting Authority issues radio
and television broadcast licences, and formulates and
monitors broadcast standards.
8.2 Arts
and Cultural Heritage
-
|
-
|
-
|
- 1996-97
|
- 1997-98
|
- 1998-99
|
- 1999-00
|
- 2000-01
|
-
|
-
|
-
|
- Estimate
|
- Budget
|
- Estimate
|
- Estimate
|
- Estimate
|
-
|
- National Collections
|
- $m
|
- 108.0
|
- 116.5
|
- 107.3
|
- 103.5
|
- 104.2
|
-
|
-
|
- %
|
-
|
- 7.9
|
- -7.9
|
- -3.5
|
- 0.7
|
-
|
- Assistance to the Film, TV and Multimedia Industries
|
- $m
|
- 97.8
|
- 84.2
|
- 70.2
|
- 63.8
|
- 64.0
|
-
|
-
|
- %
|
-
|
- -13.9
|
- -16.6
|
- -9.1
|
- 0.3
|
-
|
- Arts and Heritage
|
- $m
|
- 158.9
|
- 164.5
|
- 154.3
|
- 144.1
|
- 145.6
|
-
|
-
|
- %
|
-
|
- 3.5
|
- -6.2
|
- -6.6
|
- 1.0
|
-
|
- Administration
|
- $m
|
- 94.8
|
- 97.0
|
- 90.7
|
- 91.1
|
- 91.8
|
-
|
-
|
- %
|
-
|
- 2.3
|
- -6.5
|
- 0.4
|
- 0.8
|
-
|
- TOTAL
|
- $m
|
- 459.6
|
- 462.2
|
- 422.4
|
- 402.4
|
- 405.7
|
-
|
-
|
- %
|
-
|
- 0.6
|
- -8.6
|
- -4.7
|
- 0.8
|
National
Collections
Outlays include funding for the operating and capital
costs of collecting institutions such as the National
Library of Australia, the National Gallery of Australia,
the Australian National Maritime Museum and the Australian
War Memorial.
Assistance
to the Film, Television and Multimedia Industries
Financial assistance is provided through the Australian
Film Finance Corporation Limited, the Australian Film
Commission and Film Australia Pty Limited.
Arts
and Heritage
Outlays are dominated by funding to the Australia Council
and to Symphony Australia Holdings Pty Ltd. Other outlays
include funding for the Australian National Opera,
Orchestras and the Office of Australian War Graves.
Administration
These outlays fund administrative support for recreation
and cultural activities, mainly through the Departments
of Communications and the Arts, and Environment, Sport
and Territories.
8.3 Sport
and Recreation
The Commonwealth provides financial assistance to encourage
community interest and participation in sport and recreational
activities and to facilitate preparation for the Olympic
Games by Australian athletes. The Australian Sports
Commission, which incorporates the Australian Institute
of Sport, promotes and facilitates the pursuit of excellence
in sport, sports development and participation. Outlays
increase substantially from 1998-99 due to assistance
to be paid to the Sydney Organising Committee for the
Olympic Games (refer to Budget
Paper No. 2 for more detail).
8.4 National
Estate and Parks
The Commonwealth is involved in the identification
and protection of Australia's natural environment through
arrangements such as the Register of the National Estate,
management of national parks and world heritage listings.
The Commonwealth discharges many of its management
responsibilities through various statutory authorities
and arrangements with the States.
Additional funding for the conservation, sustainable
use and repair of Australia's natural environment will
be provided through the Natural Heritage Trust which
also relates to 7.4
Environment Protection and 10.7
Natural Resources Development and Management.
9. Fuel and Energy
Nature
of Outlays
Fuel and Energy covers outlays on coal, petroleum,
gas, nuclear affairs, electricity and other energy
including alternative fuels. It includes price control,
research and measures designed to reduce consumption
or increase production and support in the form of advances,
grants or subsidies. It excludes outlays on the transportation
of petroleum and gas which are classified to 12.
Transport and Communication and the disposal of
radioactive waste which is classified to 7.
Housing and Community Amenities.
Commonwealth outlays in respect of this function include:
payments to support micro-economic reform of electricity
power supply; payments to State government departments
for administration of petroleum production within the
Commonwealth's jurisdiction; funding for Commonwealth
outcomes in relation to promoting energy efficiencies
for the benefit of industry and the community generally,
and for the alternative energy industry specifically
(i.e. renewable energy and energy conservation).
Not included under this function are the fuel and energy
purchases of government departments and agencies used
for operational purposes.
This function includes outlays of the following portfolios:
- Primary Industries and Energy; and
- Environment, Sport and Territories.
Chart 1.
Overview of Commonwealth Outlays on
Fuel and Energy
(1989-90 prices)
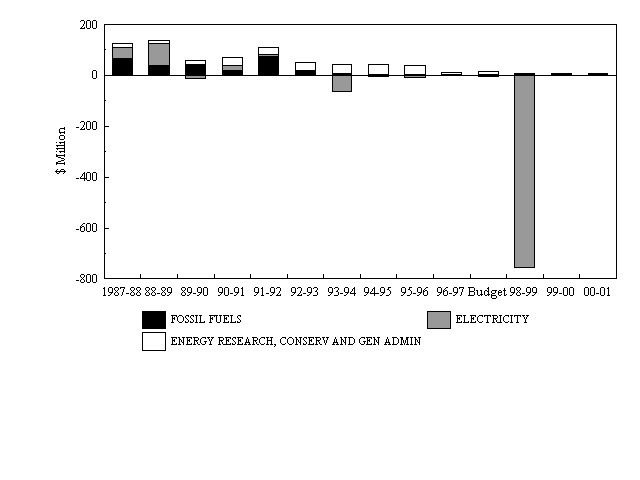
Trends
in Fuel and Energy Outlays
Fuel and energy outlays have declined significantly
since the late 1980s (Chart
1) primarily through reduced Commonwealth involvement
in the coal industry and sale of the Gladstone Power
Station to Queensland in 1993-94 (leading to a negative
outlay in that year).
The negative outlays in 1998-99 reflect the refinancing
and repayment of debt to the Commonwealth following
the expected corporatisation of the Snowy Mountains
Hydro-electric Authority (SMHEA).
1997-98
and Forward Estimates
-
|
-
|
-
|
- 1996-97
|
- 1997-98
|
- 1998-99
|
- 1999-00
|
- 2000-01
|
-
|
-
|
-
|
- Estimate
|
- Budget
|
- Estimate
|
- Estimate
|
- Estimate
|
- 9.1
|
- Fossil Fuels
|
- $m
|
- 3.5
|
- 3.5
|
- 3.5
|
- 3.5
|
- 3.5
|
-
|
-
|
- %
|
-
|
- -
|
- -
|
- -
|
- -
|
- 9.2
|
- Electricity
|
- $m
|
- -2.4
|
- -4.4
|
- -913.8
|
- 2.2
|
- 2.3
|
-
|
-
|
- %
|
-
|
- 83.3
|
- na
|
- -100.2
|
- 4.5
|
- 9.3
|
- Energy Research, Conservation and General Administration
|
- $m
|
- 11.9
|
- 13.5
|
- 7.3
|
- 5.4
|
- 2.7
|
-
|
-
|
- %
|
-
|
- 13.4
|
- -45.9
|
- -26.0
|
- -50.0
|
-
|
- TOTAL
|
- $m
|
- 13.1
|
- 12.6
|
- -902.9
|
- 11.2
|
- 8.5
|
-
|
-
|
- %
|
-
|
- -3.8
|
- na
|
- -101.2
|
- -24.1
|
9.1 Fossil
Fuels
Outlays provide reimbursement to State government departments
for administration of petroleum exploration and production
leases within Commonwealth jurisdiction.
9.2 Electricity
Outlays include provision in 1998-99 for the refinancing
and repayment by the corporatised Snowy Mountains Scheme
of Commonwealth debt assumed by the company at corporatisation
expected early in 1998. The debt will correspond to
the market value of existing SMHEA borrowings (advances
and inscribed stock). New South Wales (NSW) and Victoria
will have a majority shareholding consistent with existing
entitlements to electricity generated by the Scheme.
Detailed corporatisation arrangements are being developed
in accordance with principles agreed by the Commonwealth,
NSW and Victoria.
The 1997-98 outlays include scheduled repayments of
Commonwealth debt by SMHEA and payments to the administration
of Christmas and Cocos Islands to cover the shortfall
in the costs of electricity supply.
9.3 Energy
Research, Conservation And General Administration
Outlays for this classification are expected to fall
over the forward years primarily for two reasons.
The major factor is the winding up of the Energy Research
and Development Corporation. An additional reason
is the savings achieved through the rationalisation
of the National Energy Efficiency Programme, which
funds a programme of cooperative arrangements to facilitate
improved energy end use efficiency.
The running costs of the Department of Primary Industries
and Energy to support fuel and energy responsibilities
comprise the remainder of outlays.
10.
Agriculture, Forestry and Fishing
Nature
of Outlays
The Agriculture, Forestry and Fishing function covers
outlays on: land management; water resources; rural
adjustment designed to improve farm productivity, profitability
and sustainability; quarantine services; diesel fuel
rebates for primary producers; contributions to research
and promotion, price support arrangements and subsidies
(including where the cost of services provided by departments
and agencies is borne by Government in whole or in
part); efforts to conserve, extend or rationalise
exploitation of forest resources; forest pest and
disease control activities; forest firefighting and
fire prevention services; freshwater, ocean and coastal
fishing and fish farming; and research into fish management
and related problems of the fish industry. Outlays
on sport fishing are classified to 8.
Recreation and Culture.
A large proportion of outlays in this function correspond
to various levies and charges collected by Government
on behalf of industry. These industry contributions
are classified as revenue, i.e. not offsets within
outlays (see Other Taxes, Fees and Fines in Statement
5).
Outlays in other functions also assist agricultural
industries, e.g. outlays on transport infrastructure
and services, and by agencies such as the Commonwealth
Scientific and Industrial Research Organisation. In
addition, taxation legislation provides concessional
treatment of research and development costs, and for
the averaging of income from primary production.
This function includes outlays of the following portfolios:
- Administrative Services;
- Environment, Sport and Territories;
- Veterans' Affairs;
- Industry, Science and Tourism;
- Primary Industries and Energy;
- Prime Minister and Cabinet; and
- Treasury.
Chart 1. Overview of Commonwealth Outlays on
Agriculture,
Forestry and Fishing
(1989-90 prices)
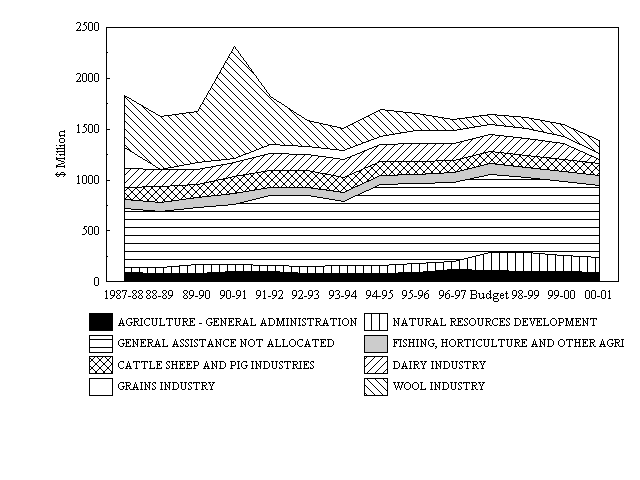
Trends
in Agriculture, Forestry and Fishing Outlays
As shown in Chart 1, the major impact on function outlays
over the period between 1987-88 and 1997-98 was the
1990-91 peak in wool outlays associated with the management
of the wool stockpile and associated debt. The increase
for Natural Resources Development and Management from
1997-98 will result from the commencement of the Natural
Heritage Trust.
The increase in real terms in 1994-95 principally reflects
additional outlays to the rural sector on exceptional
circumstances drought assistance. Outlays are expected
to decrease from 1997-98 as the need for drought relief
decreases and in 2000-01 as assistance to the dairy
industry through the Domestic Market Support Scheme
is terminated.
1997-98
and Forward Estimates
-
|
-
|
-
|
- 1996-97
|
- 1997-98
|
- 1998-99
|
- 1999-00
|
- 2000-01
|
-
|
-
|
-
|
- Estimate
|
- Budget
|
- Estimate
|
- Estimate
|
- Estimate
|
-
|
- Specific Industries
|
-
|
-
|
-
|
-
|
-
|
-
|
- 10.1
|
- Wool
|
- $m
|
- 123.1
|
- 121.5
|
- 132.9
|
- 149.3
|
- 169.1
|
-
|
-
|
- %
|
-
|
- -1.3
|
- 9.4
|
- 12.3
|
- 13.3
|
- 10.2
|
- Grains
|
- $m
|
- 149.8
|
- 119.8
|
- 115.5
|
- 76.3
|
- 74.7
|
-
|
-
|
- %
|
-
|
- -20.0
|
- -3.6
|
- -33.9
|
- -2.1
|
- 10.3
|
- Dairy
|
- $m
|
- 193.9
|
- 196.1
|
- 200.4
|
- 202.8
|
- 47.7
|
-
|
-
|
- %
|
-
|
- 1.1
|
- 2.2
|
- 1.2
|
- -76.5
|
- 10.4
|
- Cattle, Sheep and Pig
|
- $m
|
- 142.8
|
- 142.6
|
- 143.2
|
- 147.0
|
- 147.4
|
-
|
-
|
- %
|
-
|
- -0.1
|
- 0.4
|
- 2.7
|
- 0.3
|
- 10.5
|
- Fishing, Horticulture and Other Agriculture
|
- $m
|
- 115.9
|
- 126.4
|
- 122.6
|
- 123.8
|
- 121.5
|
-
|
-
|
- %
|
-
|
- 9.1
|
- -3.0
|
- 1.0
|
- -1.9
|
-
|
- Sub-total
|
- $m
|
- 725.5
|
- 706.4
|
- 714.6
|
- 699.2
|
- 560.4
|
-
|
-
|
- %
|
-
|
- -2.6
|
- 1.2
|
- -2.2
|
- -19.9
|
- 10.6
|
- General Assistance not Allocated to Specific Industries
|
- $m
|
- 891.9
|
- 898.9
|
- 893.6
|
- 900.6
|
- 899.7
|
-
|
-
|
- %
|
-
|
- 0.8
|
- -0.6
|
- 0.8
|
- -0.1
|
- 10.7
|
- Natural Resources Development and Management
|
- $m
|
- 89.3
|
- 215.9
|
- 219.7
|
- 195.6
|
- 186.9
|
-
|
-
|
- %
|
-
|
- 141.8
|
- 1.8
|
- -11.0
|
- -4.4
|
- 10.8
|
- General Administration
|
- $m
|
- 143.5
|
- 127.9
|
- 125.1
|
- 120.9
|
- 120.4
|
-
|
-
|
- %
|
-
|
- -10.9
|
- -2.2
|
- -3.4
|
- -0.4
|
-
|
- TOTAL
|
- $m
|
- 1850.2
|
- 1949.1
|
- 1953.1
|
- 1916.4
|
- 1767.4
|
-
|
-
|
- %
|
-
|
- 5.3
|
- 0.2
|
- -1.9
|
- -7.8
|
10.1 Wool
Industry
Outlays consist of payments to Wool International to
manage the stockpile and repay the wool industry's
debt, and to the Australian Wool Research and Promotion
Organisation for industry promotion and management
of wool research and development. These payments are
funded by the wool tax. The Government also provides
a matching contribution for research and development
up to 0.5 per cent of the Gross Value of Production.
10.2 Grains
Industry
Outlays predominantly relate to wheat. The wheat levy
funds the trading and value adding activities of the
Australian Wheat Board, with the Government providing
a matching contribution for research and development
of up to 0.5 per cent of the Gross Value of Production.
Outlays are expected to decrease in 1999-2000 as the
levy contribution for the Wheat Industry Council will
cease on 30 June 1999, in line with a restructuring
of the wheat industry.
10.3
Dairy Industry
Outlays consist of contributions to the dairy industry
for promotion, administration, market support, and
research and development. Payments to the Australian
Dairy Corporation and the Australian Dairy Research
and Development Corporation are funded primarily through
dairy levies, with the Government providing a matching
contribution for research and development of up to
0.5 per cent of the Gross Value of Production. Outlays
are expected to decrease in 2000-01 as assistance through
the Domestic Market Support Scheme is terminated.
10.4 Cattle,
Sheep and Pig Industries
Outlays are contributions to the meat industry for
promotion, research and development and control of
cattle diseases. Payments to the Australian Meat and
Livestock Corporation and the Australian Pork Corporation
for promotion, administrative and operational expenses
are funded primarily through industry levies, with
the Government providing a matching contribution for
research and development of up to 0.5 per cent of the
Gross Value of Production.
10.5 Fishing,
Horticulture and Other Agriculture
-
|
-
|
-
|
- 1996-97
|
- 1997-98
|
- 1998-99
|
- 1999-00
|
- 2000-01
|
-
|
-
|
-
|
- Estimate
|
- Budget
|
- Estimate
|
- Estimate
|
- Estimate
|
-
|
- Fishing Industry
|
- $m
|
- 36.4
|
- 37.4
|
- 39.8
|
- 41.1
|
- 37.7
|
-
|
-
|
- %
|
-
|
- 2.7
|
- 6.4
|
- 3.3
|
- -8.3
|
-
|
- Horticulture and Other Agricultural Industries
|
- $m
|
- 79.5
|
- 88.9
|
- 82.9
|
- 82.7
|
- 83.8
|
-
|
-
|
- %
|
-
|
- 11.8
|
- -6.7
|
- -0.2
|
- 1.3
|
-
|
- TOTAL
|
- $m
|
- 115.9
|
- 126.4
|
- 122.6
|
- 123.8
|
- 121.5
|
-
|
-
|
- %
|
-
|
- 9.1
|
- -3.0
|
- 1.0
|
- -1.9
|
Fishing
Industry
Outlays include funding for fisheries management by
the Australian Fisheries Management Authority (AFMA)
and for fisheries research. AFMA recovers costs attributable
to the industry while the Budget funds community service
obligations. The drop in outlays in 2000-01 reflects
the expected final payment of a loan to the Northern
Prawn Voluntary Adjustment Scheme.
Horticulture
and Other Agricultural Industries
Industry levies fully pay for the activities of the
Australian Wine and Brandy Corporation. The Australian
Horticultural Corporation is funded through industry
levies and Government matching grants. The rise in
outlays in 1997-98 reflects the restoration of funding
to ongoing levels following one-off reductions in 1996-97
associated with surplus cash balances.
10.6 General
Assistance not Allocated to Specific Industries
-
|
-
|
-
|
- 1996-97
|
- 1997-98
|
- 1998-99
|
- 1999-00
|
- 2000-01
|
-
|
-
|
-
|
- Estimate
|
- Budget
|
- Estimate
|
- Estimate
|
- Estimate
|
-
|
- Rural Adjustment
|
- $m
|
- 67.6
|
- 36.3
|
- 16.1
|
- 8.8
|
- -1.3
|
-
|
-
|
- %
|
-
|
- -46.3
|
- -55.6
|
- -45.3
|
- -114.8
|
-
|
- Integrated Rural Policy
|
- $m
|
- -
|
- 44.8
|
- 46.4
|
- 52.5
|
- 55.5
|
-
|
-
|
- %
|
-
|
- na
|
- 3.6
|
- 13.1
|
- 5.7
|
-
|
- Quarantine and Inspection Services
|
- $m
|
- 180.3
|
- 167.5
|
- 165.3
|
- 149.9
|
- 132.6
|
-
|
-
|
- %
|
-
|
- -7.1
|
- -1.3
|
- -9.3
|
- -11.5
|
-
|
- Diesel Fuel Rebate Scheme
|
- $m
|
- 611.6
|
- 624.4
|
- 645.8
|
- 668.5
|
- 692.1
|
-
|
-
|
- %
|
-
|
- 2.1
|
- 3.4
|
- 3.5
|
- 3.5
|
-
|
- Other
|
- $m
|
- 32.4
|
- 25.9
|
- 20.0
|
- 20.8
|
- 20.8
|
-
|
-
|
- %
|
-
|
- -20.1
|
- -22.8
|
- 4.0
|
- -
|
-
|
- TOTAL
|
- $m
|
- 891.9
|
- 898.9
|
- 893.6
|
- 900.6
|
- 899.7
|
-
|
-
|
- %
|
-
|
- 0.8
|
- -0.6
|
- 0.8
|
- -0.1
|
Rural
Adjustment
The Rural Adjustment Scheme provides assistance, through
interest subsidies and grants for training and consultancy
services, to farmers who are commercially viable in
the long term. The reduction in outlays from 1997-98
reflects a winding up of the Scheme, which is to be
replaced by the Integrated Rural Policy Package (see
below). Further major outlays for drought assistance
appear under 6.6
Other Welfare Programmes. Other minor drought
related outlays measures are shown under 4.4 Student
Assistance, 8.4
National Estates and Parks, and 10.7
Natural Resources Development and Management.
Integrated
Rural Policy Package
This classification includes funding for the Integrated
Rural Policy Package, to be announced later in the
year. The Package aims to promote a self-reliant, productive
rural sector supported by targeted Government measures
which focus on building the skills and capacity of
rural industries and communities to manage effectively
in an uncertain environment. Savings which become
available as a result of winding up the Rural Adjustment
Scheme will be used to fund the Package.
Australian
Quarantine and Inspection Service
The Australian Quarantine and Inspection Service (AQIS)
conducts inspection services for the export and import
of animals, animal products, plants and plant products,
and the quarantine surveillance of arriving vessels,
persons and goods. The decrease in outlays from 1997-98
reflects the implementation of company quality assurance-based
export meat inspection, whereby the inspection function
will be performed by company employees under the scrutiny
of a Government veterinary officer, rather than by
AQIS. This decrease is offset, somewhat, through the
provision of funding for the implementation of recommendations
of the report, Australian Quarantine - A shared responsibility
(Nairn) and the report of the National Task Force on
Imported Fish and Fish Products.
Diesel
Fuel Rebate Scheme - Primary Production
The Diesel Fuel Rebate Scheme provides for a rebate
of excise or customs duty on diesel fuel used for eligible
primary production activities. Legislation to revamp
the operation of the Scheme was introduced in Parliament
in December 1996. The legislation will address overclaiming
of the rebate and containment of growth in outlays
associated with decisions by the Administrative Appeals
Tribunal and the Federal Court to widen eligibility
under the Scheme.
Other
Programmes
This classification includes outlays for a range of
programmes to address issues in the rural sector, including
the Rural Communities Access Programme (RCAP), as well
as programmes addressing animal diseases and chemical
usage. The fall in outlays in 1997-98 principally
reflects a reduction in funding to RCAP. The recent
review of RCAP and options for service delivery in
rural areas will be taken up in the development of
the Integrated Rural Policy Package (see above).
10.7 Natural
Resources Development and Management
This classification covers water, land and forest management
programmes primarily within the Department of Primary
Industries and Energy, and includes the Government's
contribution towards the Murray-Darling Basin Initiative.
Land and water programmes are now integrated within
the National Landcare Programme under the Natural Resource
Management (Financial Assistance) Act 1992.
The significant rise in outlays from 1997-98 reflects
additional funding for the conservation, sustainable
use and repair of Australia's natural environment to
be provided through the Natural Heritage Trust (see
also 7.4
Environment Protection and 8.4
National Estate and Parks).
10.8 General
Administration
This classification comprises running costs for the
Department of Primary Industries and Energy.
11.
Mining and Mineral Resources, other than Fuels; Manufacturing;
and Construction
Nature
of Outlays
Outlays under this function provide assistance to the
mining, manufacturing and export sectors, and are designed
to improve the efficiency and competitiveness of Australian
industries. Assistance is provided in the form of grants,
subsidies, rebates, bounties, direct project involvement,
and the provision of some services either free of charge
or at charges less than the costs involved. All activities
relating to mineral fuels, and manufacturing relating
to the production of fuel and energy, are classified
to 9.
Fuel and Energy.
This function includes outlays of the following portfolios:
- Foreign Affairs and Trade;
- Industry, Science and Tourism; and
- Primary Industries and Energy.
Chart 1. Overview of Commonwealth Outlays on
Mining
and Mineral Resources, Other Than Fuels;
Manufacturing;
and Construction
(1989-90 prices)
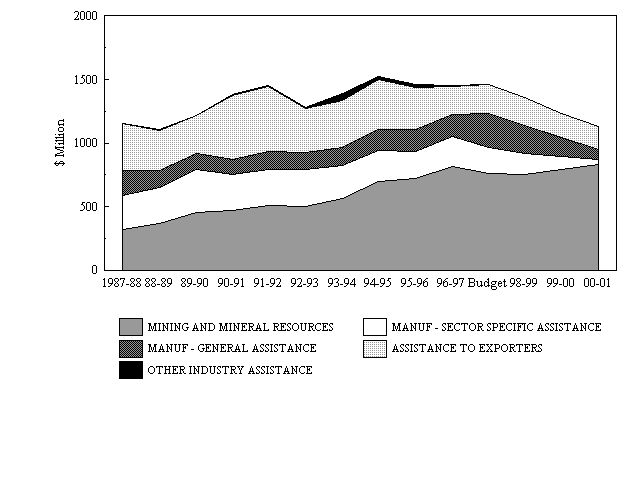
Trends
In Mining And Mineral Resources, Other Than Fuels;
Manufacturing; And Construction Outlays
Between 1987-88 and 1994-95 outlays increased over
the period as a whole. The major factor contributing
to this growth was payments to mining operators under
the Diesel Fuel Rebate Scheme (DFRS) as a result of
growth in the mining sector and widening coverage of
the Scheme, reflecting Administrative Appeals Tribunal
and Federal Court rulings.
During this period there were two declines in outlays
(1987-88 to 1988-89 and 1991-92 to 1992-93). These
were almost entirely due to reductions in assistance
to exporters, as revisions to the eligibility criteria
for the Export Market Development Grants Scheme (EMDGS)
narrowed the coverage of the Scheme.
Between 1994-95 and 1997-98 outlays decreased in most
years. This decline is projected to continue throughout
the forward estimate period. Major factors contributing
to the decline include:
- a move in government policy away from sector specific
assistance through the termination of production bounties
under the manufacturing subfunction;
- the expiry of some AusIndustry programmes established
in 1994-95, under the general assistance classification;
and
- the capping of the EMDGS and abolition of several programmes
under the assistance to exporters subfunction.
1997-98
and Forward Estimates
-
|
-
|
-
|
- 1996-97
|
- 1997-98
|
- 1998-99
|
- 1999-00
|
- 2000-01
|
-
|
-
|
-
|
- Estimate
|
- Budget
|
- Estimate
|
- Estimate
|
- Estimate
|
- 11.1
|
- Mining and Mineral Resources
|
- $m
|
- 941.3
|
- 900.4
|
- 912.5
|
- 983.0
|
- 1059.3
|
-
|
-
|
- %
|
-
|
- -4.3
|
- 1.3
|
- 7.7
|
- 7.8
|
- 11.2
|
- Manufacturing
|
- $m
|
- 476.9
|
- 560.9
|
- 470.5
|
- 316.4
|
- 145.6
|
-
|
-
|
- %
|
-
|
- 17.6
|
- -16.1
|
- -32.8
|
- -54.0
|
- 11.3
|
- Assistance to Exporters
|
- $m
|
- 258.3
|
- 263.7
|
- 258.6
|
- 232.1
|
- 237.7
|
-
|
-
|
- %
|
-
|
- 2.1
|
- -1.9
|
- -10.2
|
- 2.4
|
- 11.4
|
- Other Industry Assistance
|
- $m
|
- 4.4
|
- 1.7
|
- -
|
- -
|
- -
|
-
|
-
|
- %
|
-
|
- -61.4
|
- -100.0
|
- na
|
- na
|
-
|
- TOTAL
|
- $m
|
- 1680.9
|
- 1726.7
|
- 1641.6
|
- 1531.5
|
- 1442.6
|
-
|
-
|
- %
|
-
|
- 2.7
|
- -4.9
|
- -6.7
|
- -5.8
|
11.1 Mining
and mineral resources
-
|
-
|
-
|
- 1996-97
|
- 1997-98
|
- 1998-99
|
- 1999-00
|
- 2000-01
|
-
|
-
|
-
|
- Estimate
|
- Budget
|
- Estimate
|
- Estimate
|
- Estimate
|
-
|
- Mining-International Involvement
|
- $m
|
- 0.3
|
- 0.3
|
- 0.2
|
- 0.2
|
- 0.2
|
-
|
-
|
- %
|
-
|
- -
|
- -33.3
|
- -
|
- -
|
-
|
- Diesel Fuel Rebate Scheme
|
- $m
|
- 823.4
|
- 812.9
|
- 870.3
|
- 940.3
|
- 1015.8
|
-
|
-
|
- %
|
-
|
- -1.3
|
- 7.1
|
- 8.0
|
- 8.0
|
-
|
- Other Mining and Mineral Resources
|
- $m
|
- 117.6
|
- 87.2
|
- 42.0
|
- 42.4
|
- 43.3
|
-
|
-
|
- %
|
-
|
- -25.9
|
- -51.8
|
- 1.0
|
- 2.1
|
-
|
- TOTAL
|
- $m
|
- 941.3
|
- 900.4
|
- 912.5
|
- 983.0
|
- 1059.3
|
-
|
-
|
- %
|
-
|
- -4.3
|
- 1.3
|
- 7.7
|
- 7.8
|
Diesel
Fuel Rebate Scheme
Funding under this Scheme provides for a rebate of
excise or customs duty on diesel fuel for eligible
mining activities. Legislation to revamp the operation
of the Scheme was introduced in Parliament in December
1996. The legislation will reduce overclaiming of the
rebate, restrict eligibility, and contain growth in
outlays associated with decisions by the Administrative
Appeals Tribunal and the Federal Court to widen eligibility
under the Scheme.
Other
Mining and Mineral Resources
Outlays under this classification mainly comprise the
operating costs of the Australian Geological Survey
Organisation. Construction of the new building will
be completed in 1997-98, which causes outlays to fall
significantly in the forward years.
11.2 Manufacturing
-
|
-
|
-
|
- 1996-97
|
- 1997-98
|
- 1998-99
|
- 1999-00
|
- 2000-01
|
-
|
-
|
-
|
- Estimate
|
- Budget
|
- Estimate
|
- Estimate
|
- Estimate
|
-
|
- Sector Specific Assistance Textiles, Clothing and Footwear
|
-
|
-
|
-
|
-
|
-
|
-
|
-
|
-
|
- $m
|
- 35.9
|
- 20.4
|
- 18.3
|
- 5.9
|
- -
|
-
|
-
|
- %
|
-
|
- -43.2
|
- -10.3
|
- -67.8
|
- -100.0
|
-
|
- Shipbuilding (Bounty)
|
- $m
|
- 18.2
|
- 19.1
|
- 22.4
|
- 1.0
|
- -
|
-
|
-
|
- %
|
-
|
- 4.9
|
- 17.3
|
- -95.5
|
- -100.0
|
-
|
- Printing (Bounty)
|
- $m
|
- 14.1
|
- 3.6
|
- -
|
- -
|
- -
|
-
|
-
|
- %
|
-
|
- -74.5
|
- -100.0
|
- na
|
- na
|
-
|
- Information Technology
|
- $m
|
- 57.8
|
- 20.9
|
- 1.1
|
- -
|
- -
|
-
|
-
|
- %
|
-
|
- -63.8
|
- -94.7
|
- -100.0
|
- na
|
-
|
- Automotive and Engineering
|
- $m
|
- 5.1
|
- -
|
- -
|
- -
|
- -
|
-
|
-
|
- %
|
-
|
- -100.0
|
- na
|
- na
|
- na
|
-
|
- Pharmaceutical and Food
|
- $m
|
- 147.8
|
- 175.1
|
- 159.3
|
- 120.2
|
- 48.6
|
-
|
-
|
- %
|
-
|
- 18.5
|
- -9.0
|
- -24.5
|
- -59.6
|
-
|
- Sub-total
|
- $m
|
- 278.9
|
- 239.1
|
- 201.1
|
- 127.1
|
- 48.6
|
-
|
-
|
- %
|
-
|
- -14.3
|
- -15.9
|
- -36.8
|
- -61.8
|
-
|
- General Assistance
|
-
|
-
|
-
|
-
|
-
|
-
|
-
|
- Industrial Research and Development
|
- $m
|
- 68.5
|
- 164.3
|
- 165.8
|
- 107.7
|
- 20.0
|
-
|
-
|
- %
|
-
|
- 139.9
|
- 0.9
|
- -35.0
|
- -81.4
|
-
|
- Industry Services
|
- $m
|
- 0.1
|
- -
|
- -
|
- -
|
- -
|
-
|
-
|
- %
|
-
|
- -100.0
|
- na
|
- na
|
- na
|
-
|
- Enterprise Development
|
- $m
|
- 30.9
|
- 42.6
|
- 13.4
|
- 4.4
|
- 3.3
|
-
|
-
|
- %
|
-
|
- 37.9
|
- -68.5
|
- -67.2
|
- -25.0
|
-
|
- Other Assistance to Manufacturing
|
- $m
|
- 98.6
|
- 114.9
|
- 90.2
|
- 77.2
|
- 73.6
|
-
|
-
|
- %
|
-
|
- 16.5
|
- -21.5
|
- -14.4
|
- -4.7
|
-
|
- Sub-total
|
- $m
|
- 198.0
|
- 321.8
|
- 269.4
|
- 189.3
|
- 96.9
|
-
|
-
|
- %
|
-
|
- 62.5
|
- -16.3
|
- -29.7
|
- -48.8
|
-
|
- TOTAL
|
- $m
|
- 476.9
|
- 560.9
|
- 470.5
|
- 316.4
|
- 145.6
|
-
|
-
|
- %
|
-
|
- 17.6
|
- -16.1
|
- -32.8
|
- -54.0
|
Sector
Specific Assistance
Textiles, Clothing and Footwear
Assistance to the Textile, Clothing and Footwear (TCF)
industry is provided through the TCF Development 2000
package. Outlays also include specific assistance
to Australian Leather Holdings Limited.
Shipbuilding, Printing and Information Technology
Assistance to the shipbuilding industry and printing
industries has been provided through the payment of
bounties. The application of the shipbuilding bounty
has been extended to 30 June 1999, at an additional
cost of up to $30.3 million. The bounty will apply
to commitments entered into by 31 December 1997. The
proposed termination date for the book printing bounty
has been amended to 30 June 1997, which will result
in bounty payments in 1997-98 on previous years' production.
Assistance to the information technology industry is
provided largely through the computer bounty. The computer
bounty will terminate with effect from 1 July 1997.
Pharmaceutical
Assistance to the pharmaceutical industry is provided
through the Factor f Scheme. The purpose of the Scheme
is to promote the development of the sector by partially
compensating pharmaceutical companies for lost activity
as a result of price setting arrangements under the
Pharmaceutical Benefits Scheme. In return for assistance
under the Factor f Scheme, eligible companies are required
to meet specified targets on their research and development
expenditure and value-added activities.
The current Factor f Scheme ends on 30 June 1999 with
the final payments to be made in 1999-2000. A new
scheme of assistance to the pharmaceutical industry
commences at a reduced level from 1 July 1999.
General
Assistance
General assistance is provided through AusIndustry,
administered at the Commonwealth level by the Department
of Industry, Science and Tourism. AusIndustry provides
an entry point for small to medium enterprises accessing
different assistance programmes offered by the Commonwealth,
States and Territories. It provides assistance through
the delivery of advice and referral services, and individual
direct management. AusIndustry also provides direct
assistance to encourage research and development through
grants and commercialisation loans.
Other Assistance to Manufacturing
Outlays consist mainly of administrative costs associated
with the Department of Industry, Science and Tourism.
11.3 Assistance
To Exporters
-
|
-
|
-
|
- 1996-97
|
- 1997-98
|
- 1998-99
|
- 1999-00
|
- 2000-01
|
-
|
-
|
-
|
- Estimate
|
- Budget
|
- Estimate
|
- Estimate
|
- Estimate
|
-
|
- Export Development Scheme
|
- $m
|
- 175.2
|
- 188.3
|
- 143.0
|
- 121.2
|
- 126.1
|
-
|
-
|
- %
|
-
|
- 7.5
|
- -24.1
|
- -15.2
|
- 4.0
|
-
|
- Export and Trade Promotion
|
- $m
|
- 72.2
|
- 106.1
|
- 107.2
|
- 104.9
|
- 103.0
|
-
|
-
|
- %
|
-
|
- 47.0
|
- 1.0
|
- -2.1
|
- -1.8
|
-
|
- Export Finance Facility
|
- $m
|
- -4.5
|
- -46.9
|
- -6.4
|
- -6.1
|
- -3.3
|
-
|
-
|
- %
|
-
|
- na
|
- -86.4
|
- -4.7
|
- -45.9
|
-
|
- National Interest Export Business
|
- $m
|
- 15.4
|
- 16.2
|
- 14.8
|
- 12.2
|
- 12.0
|
-
|
-
|
- %
|
-
|
- 5.2
|
- -8.6
|
- -17.6
|
- -1.6
|
-
|
- TOTAL
|
- $m
|
- 258.3
|
- 263.7
|
- 258.6
|
- 232.1
|
- 237.7
|
-
|
-
|
- %
|
-
|
- 2.1
|
- -1.9
|
- -10.2
|
- 2.4
|
Commonwealth assistance to exporters includes direct
financial assistance for the development of export
markets, information and promotional assistance, finance
and insurance services, and the development of trade
policy.
Outlays on general assistance to exporters are shown
under this subfunction. Export assistance to specific
sectors is included under the sub functions which cover
those sectors.
Export
Development Schemes
The Export Market Development Grants Scheme (EMDGS)
administered by the Australian Trade Commission (Austrade)
provides financial assistance to Australian companies
to secure increased international business and to seek
out and develop overseas markets by encouraging increased
export promotion. EMDGS outlays are capped. The International
Trade Enhancement Scheme and the Innovative Agricultural
Marketing Programme, involving loans to exporters,
were abolished in the 1996-97 Budget, and loan funds
associated with these programmes are returning to the
public account.
Export
and Trade Promotion
The Commonwealth's funding of Austrade is reflected
under this subfunction. Outlays increase in 1997-98
as a result of a one-off reduction in cash balances
in 1996-97.
Export
Finance Facility
The Export Finance and Insurance Corporation (EFIC)
provides loans, insurance and other financial services
to support Australian produced exports and overseas
investments. Negative outlays in the years shown represent
payments to the Government of net interest profits
and a capital repayment by EFIC.
National
Interest Export Business
EFIC can refer applications for loans, guarantees and
contracts of insurance to the Government for consideration
on its National Interest Account. EFIC administers
the National Interest Account on a fee-for-service
basis and on the terms that any revenue is remitted
to the Commonwealth and the Commonwealth is liable
for the payment of insurance claims or losses incurred
through defaults by borrowers.
11.4 Other
Industry Assistance
Assistance under this subfunction provides funding
for the provision of obligations under the former National
Space Program along with funds for a nationally coordinated
programme of building regulatory reform across the
Commonwealth, States and Territories.
12. Transport
and Communication
Nature
of Outlays
Transport and Communication outlays support the infrastructure
and regulatory framework of Australia's transport and
communications sectors. Outlays are provided in the
form of grants, specific purpose payments, running
costs, loans and advances and are offset by recoveries
and repayments. The largest component of outlays relates
to specific purpose payments to State governments for
the construction and maintenance of the National Highway
System and the construction of other roads of national
importance.
Outlays relating to cultural activities and the administration
of communications programmes of the Communications
and the Arts portfolio are included in 8.
Recreation and Culture. Outlays relating to the
regional development activities of the Transport and
Regional Development portfolio are included in 7.
Housing and Community Amenities.
This function includes outlays of the following portfolios:
- Communications and the Arts; and
- Transport and Regional Development.
Chart 1. Overview of Commonwealth Outlays on
Transport
and Communication
(1989-90 prices)
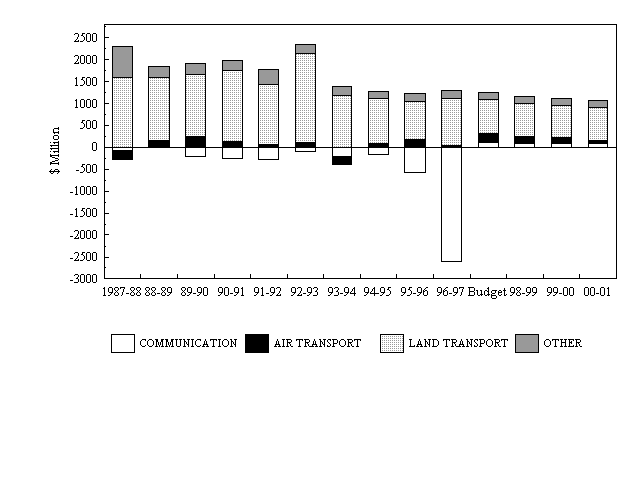
'Land Transport' includes outlays for Road and Rail
Transport.
'Other' includes outlays for Sea Transport and Other
Transport and Communications.
Trends
in Transport and Communication Outlays
Apart from a significant increase in 1992-93, due primarily
to One Nation initiatives (especially increases in
road and rail funding), there has been a general downward
trend in total outlays since 1987-88. The reconfiguration
of equity injections to and repayment of advances by
Telstra and capital repayments by Australia Post have
generated significant offsets to outlays within this
period. The decline in outlays since 1992-93 also arises
from the completion of a number of major transport
programmes and from the untying of $350 million a
year of specific purpose road grants from 1 January
1994 and the resulting transfer of funds to the function
14B.
General Purpose Inter-Government Transactions.
The large fall in outlays in 1996-97 reflects a payment
from retained earnings by Telstra to the Commonwealth
of $3 billion by 30 June 1997. The payment will ensure
that Telstra's capital structure is comparable with
that of other international telecommunications companies.
The payment to the Commonwealth will not initially
impact on the underlying budget deficit but will lead
to savings in public debt interest.
1997-98
and Forward Estimates
-
|
-
|
-
|
- 1996-97
|
- 1997-98
|
- 1998-99
|
- 1999-00
|
- 2000-01
|
-
|
-
|
-
|
- Estimate
|
- Budget
|
- Estimate
|
- Estimate
|
- Estimate
|
- 12.1
|
- Communication
|
- $m
|
- -3013.5
|
- 120.9
|
- 119.4
|
- 119.9
|
- 120.7
|
-
|
-
|
- %
|
-
|
- -104.0
|
- -1.2
|
- 0.4
|
- 0.7
|
- 12.2
|
- Air Transport
|
- $m
|
- 51.1
|
- 238.3
|
- 180.5
|
- 166.2
|
- 88.9
|
-
|
-
|
- %
|
-
|
- na
|
- -24.3
|
- -7.9
|
- -46.5
|
- 12.3
|
- Road Transport
|
- $m
|
- 867.4
|
- 867.2
|
- 855.4
|
- 812.5
|
- 831.7
|
-
|
-
|
- %
|
-
|
- -
|
- -1.4
|
- -5.0
|
- 2.4
|
- 12.4
|
- Rail Transport
|
- $m
|
- 364.3
|
- 61.8
|
- 52.3
|
- 84.1
|
- 108.4
|
-
|
-
|
- %
|
-
|
- -83.0
|
- -15.4
|
- 60.8
|
- 28.9
|
- 12.5
|
- Sea Transport
|
- $m
|
- 126.4
|
- 120.9
|
- 119.2
|
- 121.0
|
- 119.8
|
-
|
-
|
- %
|
-
|
- -4.4
|
- -1.4
|
- 1.5
|
- -1.0
|
- 12.6
|
- Other Transport and Communication
|
- $m
|
- 81.0
|
- 75.7
|
- 76.2
|
- 75.5
|
- 76.4
|
-
|
-
|
- %
|
-
|
- -6.5
|
- 0.7
|
- -0.9
|
- 1.2
|
-
|
- TOTAL
|
- $m
|
- -1523.3
|
- 1484.8
|
- 1403.0
|
- 1379.2
|
- 1346.0
|
-
|
-
|
- %
|
-
|
- -197.5
|
- -5.5
|
- -1.7
|
- -2.4
|
12.1 Communication
-
|
-
|
-
|
- 1996-97
|
- 1997-98
|
- 1998-99
|
- 1999-00
|
- 2000-01
|
-
|
-
|
-
|
- Estimate
|
- Budget
|
- Estimate
|
- Estimate
|
- Estimate
|
-
|
- Planning and Regulation
|
- $m
|
- 74.2
|
- 121.9
|
- 120.4
|
- 120.9
|
- 121.7
|
-
|
-
|
- %
|
-
|
- 64.3
|
- -1.2
|
- 0.4
|
- 0.7
|
-
|
- Sale of Communication Rights
|
- $m
|
- -37.7
|
- -1.0
|
- -1.0
|
- -1.0
|
- -1.0
|
-
|
-
|
- %
|
-
|
- -97.3
|
- -
|
- -
|
- -
|
-
|
- Repayment of Advances
|
- $m
|
- -3050.0
|
- -
|
- -
|
- -
|
- -
|
-
|
-
|
- %
|
-
|
- -100.0
|
- na
|
- na
|
- na
|
-
|
- TOTAL
|
- $m
|
- -3013.5
|
- 120.9
|
- 119.4
|
- 119.9
|
- 120.7
|
-
|
-
|
- %
|
-
|
- -104.0
|
- -1.2
|
- 0.4
|
- 0.7
|
The Communication subfunction includes the operations
of the Australian Telecommunications Authority (AUSTEL)
and the Spectrum Management Agency (SMA). Government
business enterprises within this subfunction are Australia
Post and Telstra.
The above estimates do not include outlays for broadcasting
activities, other than for radiocommunications. Broadcasting
activities are covered in 8.
Recreation and Culture.
Planning
and Regulation
Planning and regulation of the communications industry
is currently undertaken by the Department of Communications
and the Arts, AUSTEL and the SMA. AUSTEL is responsible
for regulation of the telecommunications industry,
in particular, the development of commercially sustainable
competition. The SMA's key functions are spectrum planning
and administration.
As part of the reforms to telecommunications regulation
and administration to be implemented from 1 July 1997,
AUSTEL and SMA will be amalgamated into an Australian
Communications Authority, apart from the competition
regulation function of AUSTEL which will be transferred
to the Australian Competition and Consumer Commission.
12.2 Air
Transport
-
|
-
|
-
|
- 1996-97
|
- 1997-98
|
- 1998-99
|
- 1999-00
|
- 2000-01
|
-
|
-
|
-
|
- Estimate
|
- Budget
|
- Estimate
|
- Estimate
|
- Estimate
|
-
|
- Airport Administration and Aviation Policy
|
- $m
|
- 61.9
|
- 158.0
|
- 100.0
|
- 79.9
|
- 1.8
|
-
|
-
|
- %
|
-
|
- 155.3
|
- -36.7
|
- -20.1
|
- -97.7
|
-
|
- Air Safety, Search and Rescue
|
- $m
|
- 34.7
|
- 30.9
|
- 31.3
|
- 31.5
|
- 31.7
|
-
|
-
|
- %
|
-
|
- -11.0
|
- 1.3
|
- 0.6
|
- 0.6
|
-
|
- Avgas and Avtur Duty Paid
|
- $m
|
- 60.0
|
- 54.4
|
- 54.1
|
- 54.8
|
- 55.4
|
-
|
-
|
- %
|
-
|
- -9.3
|
- -0.6
|
- 1.3
|
- 1.1
|
-
|
- Recoveries and Repayments
|
- $m
|
- -105.5
|
- -5.0
|
- -5.0
|
- -
|
- -
|
-
|
-
|
- %
|
-
|
- -95.3
|
- -
|
- -100.0
|
- na
|
-
|
- TOTAL
|
- $m
|
- 51.1
|
- 238.3
|
- 180.5
|
- 166.2
|
- 88.9
|
-
|
-
|
- %
|
-
|
- na
|
- -24.3
|
- -7.9
|
- -46.5
|
This subfunction includes the operations of the Civil
Aviation Safety Authority (CASA). Government business
enterprises within this subfunction include the Federal
Airports Corporation and Airservices Australia (Airservices).
Airport
Administration and Aviation Policy
This item includes the provision of aviation infrastructure,
and the regulation and implementation of aviation environmental
and security standards and airport building and planning
standards. The major outlay within this item relates
to the Sydney Airport Noise Amelioration Programme.
Air
Safety, Search and Rescue
The development, implementation and enforcement of
aviation safety standards is undertaken by CASA. Aviation
search and rescue services previously provided by Airservices
will be transferred to the Australian Maritime Safety
Authority in 1997-98.
Avgas
and Avtur Duty Paid
Industry's contribution to aviation safety regulation
is made through fees and charges, and customs duty
and excise on aviation turbine fuel and aviation gasoline.
Airservices receives a component of aviation gasoline
duty as a contribution to the recovery of the costs
of enroute and terminal navigation services from the
general aviation sector. (See also Excise Duty in Statement
5.)
Recoveries
and Repayments
Loan and capital repayments by air transport government
business enterprises are included in this item.
12.3 Road
Transport
-
|
-
|
-
|
- 1996-97
|
- 1997-98
|
- 1998-99
|
- 1999-00
|
- 2000-01
|
-
|
-
|
-
|
- Estimate
|
- Budget
|
- Estimate
|
- Estimate
|
- Estimate
|
-
|
- Road Grants
|
- $m
|
- 803.5
|
- 808.7
|
- 806.6
|
- 773.2
|
- 791.6
|
-
|
-
|
- %
|
-
|
- 0.6
|
- -0.3
|
- -4.1
|
- 2.4
|
-
|
- Interstate Road Transport Charge
|
- $m
|
- 20.3
|
- 15.3
|
- 10.3
|
- -
|
- -
|
-
|
-
|
- %
|
-
|
- -24.6
|
- -32.7
|
- -100.0
|
- na
|
-
|
- Road Safety and Land Transport Research
|
- $m
|
- 42.1
|
- 40.4
|
- 37.4
|
- 38.1
|
- 38.9
|
-
|
-
|
- %
|
-
|
- -4.0
|
- -7.4
|
- 1.9
|
- 2.1
|
-
|
- Other
|
- $m
|
- 1.6
|
- 2.9
|
- 1.2
|
- 1.2
|
- 1.2
|
-
|
-
|
- %
|
-
|
- 81.3
|
- -58.6
|
- -
|
- -
|
-
|
- TOTAL
|
- $m
|
- 867.4
|
- 867.2
|
- 855.4
|
- 812.5
|
- 831.7
|
-
|
-
|
- %
|
-
|
- -
|
- -1.4
|
- -5.0
|
- 2.4
|
-
Road
Grants
The Commonwealth funds the National Highway System
and contributes to the capital cost of some other roads
of national importance. For roads more generally, the
Commonwealth provides general revenue assistance to
the States and to local government (see
14B. General Purpose Inter-Government Transactions).
Road
Safety and Land Transport Research
The major component of this item is a contribution
for the remediation of road safety black spots through
assistance to State and local governments.
12.4 Rail
Transport
-
|
-
|
-
|
- 1996-97
|
- 1997-98
|
- 1998-99
|
- 1999-00
|
- 2000-01
|
-
|
-
|
-
|
- Estimate
|
- Budget
|
- Estimate
|
- Estimate
|
- Estimate
|
-
|
- National Rail Corporation
|
- $m
|
- 6.1
|
- -
|
- -
|
- -
|
- -
|
-
|
-
|
- %
|
-
|
- -100.0
|
- na
|
- na
|
- na
|
-
|
- Australian National Railways Commission
|
- $m
|
- 372.6
|
- 66.8
|
- 20.4
|
- 21.6
|
- 22.8
|
-
|
-
|
- %
|
-
|
- -82.1
|
- -69.5
|
- 5.9
|
- 5.6
|
-
|
- National Rail Infrastructure Authority
|
- $m
|
- -
|
- -
|
- 35.9
|
- 63.1
|
- 86.2
|
-
|
-
|
- %
|
-
|
- na
|
- na
|
- 75.8
|
- 36.6
|
-
|
- Other Rail Development
|
- $m
|
- -14.5
|
- -5.1
|
- -4.0
|
- -0.6
|
- -0.6
|
-
|
-
|
- %
|
-
|
- -64.8
|
- -21.6
|
- -85.0
|
- -
|
-
|
- TOTAL
|
- $m
|
- 364.3
|
- 61.8
|
- 52.3
|
- 84.1
|
- 108.4
|
-
|
-
|
- %
|
-
|
- -83.0
|
- -15.4
|
- 60.8
|
- 28.9
|
National
Rail Corporation
The Government has decided, in principle, to sell its
shareholding in the National Rail Corporation.
Australian
National Railways Commission
The Government has decided to sell the Australian National
Railways Commission with the exception of the interstate
track.
National
Rail Infrastructure Authority
To ensure open access to the interstate rail network
for current and potential operators, the Government
is negotiating with the States and others over access
arrangements, including the possible establishment
of a National Rail Infrastructure Authority (NRIA).
A Commonwealth contribution to capital expenditure
on the mainline track is proposed as part of the establishment
of a NRIA.
12.5 Sea
Transport
-
|
-
|
-
|
- 1996-97
|
- 1997-98
|
- 1998-99
|
- 1999-00
|
- 2000-01
|
-
|
-
|
-
|
- Estimate
|
- Budget
|
- Estimate
|
- Estimate
|
- Estimate
|
-
|
- Tasmanian Equalisation Schemes
|
- $m
|
- 48.7
|
- 46.1
|
- 46.5
|
- 46.9
|
- 47.3
|
-
|
-
|
- %
|
-
|
- -5.3
|
- 0.9
|
- 0.9
|
- 0.9
|
-
|
- Maritime Services
|
- $m
|
- 50.0
|
- 70.8
|
- 72.7
|
- 74.1
|
- 72.5
|
-
|
-
|
- %
|
-
|
- 41.6
|
- 2.7
|
- 1.9
|
- -2.2
|
-
|
- Shipping Industry Reform
|
- $m
|
- 27.7
|
- 4.0
|
- -
|
- -
|
- -
|
-
|
-
|
- %
|
-
|
- -85.6
|
- -100.0
|
- na
|
- na
|
-
|
- TOTAL
|
- $m
|
- 126.4
|
- 120.9
|
- 119.2
|
- 121.0
|
- 119.8
|
-
|
-
|
- %
|
-
|
- -4.4
|
- -1.4
|
- 1.5
|
- -1.0
|
This subfunction includes the operations of the Australian
Maritime Safety Authority (AMSA). The government business
enterprise within this subfunction is ANL Limited.
On 30 November 1995, the then Government announced
that ANL Limited would be restructured prior to its
sale. ANL Limited has subsequently withdrawn from
a number of loss-making businesses including the Europe
and trans-Tasman trades. While ANL Limited has improved
its operating performance over recent years, it has
recorded significant cashflow deficits which have been
funded, in part, through asset sales. The Commonwealth
has guaranteed ANL Limited's debts and lease liabilities.
Tasmanian
Equalisation Schemes
This heading includes both the Tasmanian Freight Equalisation
Scheme and the Bass Strait Passenger Vehicle Equalisation
Scheme. The Tasmanian Freight Equalisation Scheme assists
in alleviating the comparative interstate freight cost
disadvantage incurred by shippers of eligible non-bulk
goods in transporting such goods to and from Tasmania
by sea. The Bass Strait Passenger Vehicle Equalisation
Scheme addresses the transport cost disadvantage when
travelling with a passenger vehicle across Bass Strait
by sea.
Maritime
Services
Maritime Services includes funding for AMSA's search
and rescue and related activities. Its marine navigation
and ship safety activities and capital needs are funded
from industry levies. During 1997-98, aviation search
and rescue which was previously undertaken by Airservices
will be transferred to AMSA.
Shipping
Industry Reform
This item includes expenditure under the previous Government's
shipping industry reforms. Spending under the International
Shipping (Australian Resident Seafarers) Act 1995 expires
in 1996-97 following repeal of that Act by the Shipping
Grants Legislation Act 1996. Expenditure under the
Ships (Capital Grants) Act 1987 will terminate in 1997-98.
12.6 Other
Transport and Communication
Included in this item are the costs of administering
relevant programmes in the Transport and Regional Development
portfolio.
13. Other Economic
Affairs
This category covers regulation of and assistance to
the private sector, direct government participation
in economic activity and the provision of economic
infrastructure. Other Economic Affairs is an aggregate
of Tourism and Area Promotion, Labour and Employment
Affairs, and other Economic Affairs not elsewhere classified.
13A. Tourism
and Area Promotion
Nature
of Outlays
Commonwealth outlays contribute to tourism research
and analysis, policy development, international tourism
marketing and funding for specific tourism programmes
and projects.
This function includes outlays of the following portfolios:
- Industry, Science and Tourism; and
- Transport and Regional Development.
Outlays on National Parks and Wildlife Services are
classified to 8.
Recreation and Culture.
Chart 1. Overview of Commonwealth Outlays on
Tourism
and Area Promotion
(1989-90 prices)
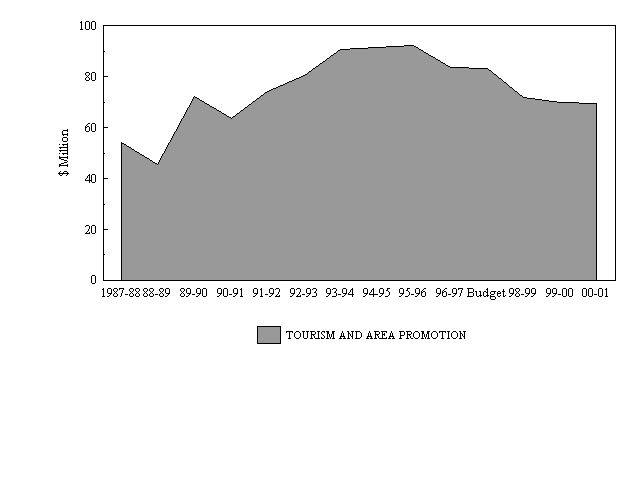
Trends
in Tourism and Area Promotion
Commonwealth assistance for tourism rose significantly
between 1987-88 and 1995-96. The main factors explaining
this are significant increases in funding over the
period for the Australian Tourist Commission's (ATC)
international marketing activities, the establishment
of a separate Department of Tourism in 1991 and the
introduction of sectoral based tourism programmes in
1993-94.
Outlays fell in 1988-89 and 1990-91 following the expiry
of the Tourism Overseas Promotion Scheme and the Tourism
Recovery Package.
The overall decline in outlays from 1995-96 will continue
into the forward estimates period. Major factors contributing
to this decline are the merger of the Department of
Tourism with the former Department of Industry, Science
and Technology, the end of a number of specialist sectoral
based tourism programmes in 1997-98 and a reduction
in marketing funds for the ATC.
1997-98
and Forward Estimates
-
|
-
|
-
|
- 1996-97
|
- 1997-98
|
- 1998-99
|
- 1999-00
|
- 2000-01
|
-
|
-
|
-
|
- Estimate
|
- Budget
|
- Estimate
|
- Estimate
|
- Estimate
|
- 13A
|
- Tourism
|
- $m
|
- 96.7
|
- 98.4
|
- 87.0
|
- 86.7
|
- 88.3
|
-
|
-
|
- %
|
-
|
- 1.8
|
- -11.6
|
- -0.3
|
- 1.8
|
-
|
- TOTAL
|
- $m
|
- 96.7
|
- 98.4
|
- 87.0
|
- 86.7
|
- 88.3
|
-
|
-
|
- %
|
-
|
- 1.8
|
- -11.6
|
- -0.4
|
- 1.8
|
13B. Labour
and Employment Affairs
Nature
of Outlays
Outlays on Labour and Employment are mainly for training
and employment assistance, facilitation of migration
and temporary entry into Australia, industrial relations
and the operation of associated Commonwealth agencies.
Labour and Employment affairs of a particular industry
are generally classified to the function which the
industry serves.
This function includes outlays of the following portfolios:
- Employment, Education, Training and Youth Affairs;
- Industrial Relations; and
- Immigration and Multicultural Affairs.
Chart 1. Overview of Commonwealth Outlays on
Labour
and Employment Affairs
(1989-90 Prices)
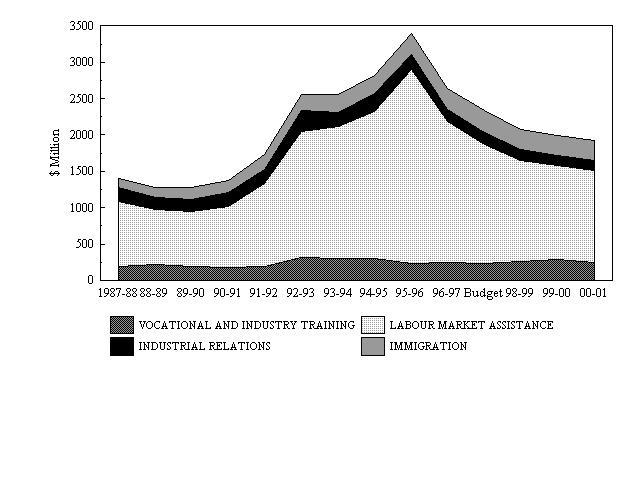
Trends
in Labour and Employment Outlays
Chart 1 shows that outlays on Labour and Employment
rose between 1989-90 and 1995-96. The increase in
expenditure reflects a number of policy initiatives
implemented in response to the increase in unemployment
at the beginning of the 1990s.
The decline in outlay trends from 1996-97 and over
the budget and forward years reflects a reduction and
tighter targeting of outlays on labour market assistance
to the unemployed, in the light of evaluation evidence
that a large proportion of expenditures were not very
effective in reducing unemployment. The tighter targeting
is being combined with greater emphasis on other strategies
for reducing unemployment, including improved economic
management, economic settings which encourage small
business, structural reform and changed industrial
relations arrangements.
1997-98
and Forward estimates
-
|
-
|
-
|
- 1996-97
|
- 1997-98
|
- 1998-99
|
- 1999-00
|
- 2000-01
|
-
|
-
|
-
|
- Estimate
|
- Budget
|
- Estimate
|
- Estimate
|
- Estimate
|
- 13B.1
|
- Vocational and Industry Training
|
- $m
|
- 290.6
|
- 276.3
|
- 311.3
|
- 351.3
|
- 306.8
|
-
|
-
|
- %
|
-
|
- -4.9
|
- 12.7
|
- 12.8
|
- -12.7
|
- 13B.2
|
- Labour Market Assistance to Jobseekers and Industry
|
- $m
|
- 2240.2
|
- 1936.3
|
- 1681.9
|
- 1601.9
|
- 1612.9
|
-
|
-
|
- %
|
-
|
- -13.6
|
- -13.1
|
- -4.8
|
- 0.7
|
- 13B.3
|
- Industrial Relations
|
- $m
|
- 189.5
|
- 186.5
|
- 183.8
|
- 184.7
|
- 185.5
|
-
|
-
|
- %
|
-
|
- -1.6
|
- -1.4
|
- 0.5
|
- 0.4
|
- 13B.4
|
- Immigration
|
- $m
|
- 331.4
|
- 356.2
|
- 334.7
|
- 329.4
|
- 339.9
|
-
|
-
|
- %
|
-
|
- 7.5
|
- -6.0
|
- -1.6
|
- 3.2
|
-
|
- TOTAL
|
- $m
|
- 3051.7
|
- 2755.2
|
- 2511.8
|
- 2467.3
|
- 2445.0
|
-
|
-
|
- %
|
-
|
- -9.7
|
- -8.8
|
- -1.8
|
- -0.9
|
13B.1 Vocational
And Industry Training
-
|
-
|
-
|
- 1996-97
|
- 1997-98
|
- 1998-99
|
- 1999-00
|
- 2000-01
|
-
|
-
|
-
|
- Estimate
|
- Budget
|
- Estimate
|
- Estimate
|
- Estimate
|
-
|
- Entry Level Training
|
- $m
|
- 240.1
|
- 223.3
|
- 266.3
|
- 307.1
|
- 264.5
|
-
|
-
|
- %
|
-
|
- -7.0
|
- 19.3
|
- 15.3
|
- -13.9
|
-
|
- Skills Training
|
- $m
|
- 50.5
|
- 53.0
|
- 45.0
|
- 44.2
|
- 42.3
|
-
|
-
|
- %
|
-
|
- 5.0
|
- -15.1
|
- -1.8
|
- -4.3
|
-
|
- TOTAL
|
- $m
|
- 290.6
|
- 276.3
|
- 311.3
|
- 351.3
|
- 306.8
|
-
|
-
|
- %
|
-
|
- -4.9
|
- 12.7
|
- 12.8
|
- -12.7
|
Outlays cover support for training in skills aimed
at improving the productivity and competitiveness of
Australian industry. They relate to the Department
of Employment, Education, Training and Youth Affairs
(DEETYA). Outlays on vocational education and training
(mainly relating to the national Technical and Further
Education (TAFE) system) are recorded under 4.
Education.
Entry Level Training
These programmes aim to develop vocational skills and
improve access to training by providing wage subsidies
and incentive payments to employers and allowances
to individuals. They also provide funding for pre-apprenticeship/traineeship
training, group training arrangements, and activities
to increase links between schools, TAFE and employers.
Skills Training
Outlays under these programmes are directed at furthering
the professional development of teachers and trainers
in the vocational education sector, increasing the
level and quality of skills training undertaken by
industry and promoting training reform. They also provide
funding for language and literacy training in the workplace,
the national network of tripartite Industry Training
Advisory Bodies and training reform projects.
13B.2 Labour
Market Assistance to Job Seekers and Industry
-
|
-
|
-
|
- 1996-97
|
- 1997-98
|
- 1998-99
|
- 1999-00
|
- 2000-01
|
-
|
-
|
-
|
- Estimate
|
- Budget
|
- Estimate
|
- Estimate
|
- Estimate
|
-
|
- Assistance to Job seekers and Industry
|
- $m
|
- 2181.6
|
- 1886.7
|
- 1636.1
|
- 1568.8
|
- 1586.6
|
-
|
-
|
- %
|
-
|
- -13.5
|
- -13.3
|
- -4.1
|
- 1.1
|
-
|
- Aboriginal Employment Assistance
|
- $m
|
- 58.6
|
- 49.6
|
- 45.8
|
- 33.1
|
- 26.3
|
-
|
-
|
- %
|
-
|
- -15.4
|
- -7.7
|
- -27.7
|
- -20.5
|
-
|
- TOTAL
|
- $m
|
- 2240.2
|
- 1936.3
|
- 1681.9
|
- 1601.9
|
- 1612.9
|
-
|
-
|
- %
|
-
|
- -13.6
|
- -13.1
|
- -4.8
|
- 0.7
|
Outlays cover a range of activities to improve the
employment prospects of unemployed people, including
running costs for the Commonwealth Employment Service
(CES) and its case management arm, Employment Assistance
Australia (EAA), and the fees provided to Contracted
Case Managers which are paid through the Employment
Services Regulatory Authority (ESRA).
Assistance to Job seekers and Industry
As announced in the 1996-97 Budget, new arrangements
for delivering labour market assistance to job seekers
will be introduced during 1997-98. These will incorporate
a new Commonwealth Services Delivery Agency (CSDA)
to be established on 1 July 1997 within the Social
Security portfolio, and a competitive employment services
market in which providers will be paid to place job
seeker clients in jobs.
The CSDA will deliver income support payments, childcare
assistance, student assistance and the registration,
assessment and referral services currently provided
by the Commonwealth Employment Service (see 6.8
General Administration). The Department of Employment,
Education, Training and Youth Affairs will purchase
services on behalf of job seekers from the market and
the CSDA.
In the competitive employment services market, the
Public Employment Placement Enterprise Limited (a wholly
owned Commonwealth company) will compete alongside
private and community sector providers to place clients
in jobs. Providers will be able to tailor assistance
to suit the employment needs of particular clients
and their payment will be heavily dependent on placing
clients in real jobs. The changes in outlays reflect
the new arrangements to apply during 1997-98 when the
CES, EAA and ESRA will cease operations and their functions
will be largely undertaken by providers in the competitive
employment services market, and the CSDA.
Certain labour market programmes such as the New Enterprise
Incentives Scheme (NEIS) will continue to be provided
to eligible clients and regional assistance programmes
will be retained (in addition to assistance provided
through the competitive employment services market).
Aboriginal Employment Assistance
The Training for Aboriginals and Torres Strait Islanders
programme provides subsidies for work experience and
on-the-job training in the public and private sectors
and formal training through vocationally oriented courses,
with the aim of increasing the level of permanent employment
for Aboriginals and Torres Strait Islanders.
The apparent decline in funding over the forward years
is due to a portion of Aboriginal Employment Assistance
funding being redirected into the employment services
market, which will also provide assistance to indigenous
Australians.
13B.3 Industrial
Relations
-
|
-
|
-
|
- 1996-97
|
- 1997-98
|
- 1998-99
|
- 1999-00
|
- 2000-01
|
-
|
-
|
-
|
- Estimate
|
- Budget
|
- Estimate
|
- Estimate
|
- Estimate
|
-
|
- Industrial Relations Development and Advice
|
- $m
|
- 62.0
|
- 66.3
|
- 64.0
|
- 64.3
|
- 64.7
|
-
|
-
|
- %
|
-
|
- 6.9
|
- -3.5
|
- 0.5
|
- 0.6
|
-
|
- Industrial Relations Conciliation and Arbitration
|
- $m
|
- 40.9
|
- 40.6
|
- 41.0
|
- 41.4
|
- 41.7
|
-
|
-
|
- %
|
-
|
- -0.7
|
- 1.0
|
- 1.0
|
- 0.7
|
-
|
- Special Industry Services
|
- $m
|
- 72.1
|
- 67.0
|
- 65.0
|
- 65.0
|
- 65.0
|
-
|
-
|
- %
|
-
|
- -7.1
|
- -3.0
|
- -
|
- -
|
-
|
- Trade Union Training
|
- $m
|
- 0.2
|
- -3.1
|
- -
|
- -
|
- -
|
-
|
-
|
- %
|
-
|
- na
|
- -100.0
|
- na
|
- na
|
-
|
- Occupational Health and Safety
|
- $m
|
- 14.3
|
- 15.6
|
- 13.9
|
- 13.9
|
- 14.1
|
-
|
-
|
- %
|
-
|
- 9.1
|
- -10.9
|
- -
|
- 1.4
|
-
|
- TOTAL
|
- $m
|
- 189.5
|
- 186.5
|
- 183.8
|
- 184.7
|
- 185.5
|
-
|
-
|
- %
|
-
|
- -1.6
|
- -1.4
|
- 0.5
|
- 0.4
|
Industrial Relations Development and Advice
Most of the outlays of this subfunction are costs incurred
by the Department of Industrial Relations in providing
policy advice and assistance on industrial relations
matters to departments and agencies and in advising
the Government on and promoting and implementing its
industrial relations policies.
Industrial Relations Conciliation and Arbitration
This subfunction covers the operation of the Australian
Industrial Relations Commission which provides the
institutional framework, machinery and resources for
the prevention and settlement of industrial disputes
and facilitates the making of agreements at the workplace
or enterprise level.
Special Industry Services
This subfunction covers special funding and levy arrangements
for employee entitlements in the stevedoring and coal
mining industries. The reduction in funding under this
subfunction from 1996-97 is due to the cessation of
Stevedoring Industry levy collections following the
discharge of loan obligations. The winding up of the
Stevedoring Industry Finance Committee is expected
to be completed in 1997-98.
Trade Union Training
This subfunction covers the operation of the Australian
Trade Union Training Authority (ATUTA). ATUTA was
formally abolished on 5 December 1996 when Schedule
18 of the Workplace Relations and Other Legislation
Amendment Act 1996 was proclaimed. The 1997-98 Budget
figure represents receipts from the sale of ATUTA assets
expected to be realised in 1997-98.
Occupational Health and Safety
This subfunction covers the operation of the National
Occupational Health and Safety Commission which provides
a national forum for consultation between employers,
unions and State and Commonwealth Governments on occupational
health and safety and develops related policies, strategies
and standards.
13B.4 Immigration
Outlays on this subfunction cover those activities
of the Department of Immigration and Multicultural
Affairs (DIMA) concerned with management of the Migration
and Humanitarian Programmes, temporary entry, entry
facilitation, compliance activity and citizenship.
Other DIMA outlays associated with migrant settlement
are covered under 4.4
Student Assistance and 6.6
Other Welfare Programmes.
The Migration Programme covers settler arrivals entering
Australia on the basis of family reunion or contribution
to the economic development of Australia. Temporary
residence policy seeks to facilitate the entry, for
a maximum stay of four years, of people who can contribute
to the economic and cultural development of Australia.
This allows for the entry of, amongst others, skilled
persons, sports men and women, entertainers and working
holiday-makers. Other entry of people for short periods
is for purposes such as tourism, business and family
visits.
Australia also considers applications for refugee status
from people in other countries (the Humanitarian Programme)
and from people already in Australia. Australia also
responds to humanitarian concerns about, and the special
needs of, people suffering discrimination or displacement.
People entering Australia whether temporarily or permanently
are expected to comply with Australian migration laws.
To encourage compliance a range of actions are taken
to encourage voluntary compliance, investigate malpractice
and, where necessary, to remove unlawful non-citizens
who have no claim to remain in Australia.
13C. Other
Economic affairs, NEC
Nature
of Outlays
This function covers economic services provided by
the Commonwealth which are not included in other function
classifications. Outlays mainly comprise the operational
costs of a number of advisory or regulatory agencies
and various other agencies including the Bureau of
Meteorology (BOM).
This function includes outlays of the following portfolios:
- Treasury;
- Administrative Services;
- Industry, Science and Tourism;
- Environment, Sport and Territories; and
- Transport and Regional Development.
Chart 1. Overview of Commonwealth Outlays on
Other
Economic Affairs, nec
(1989-90 Prices)
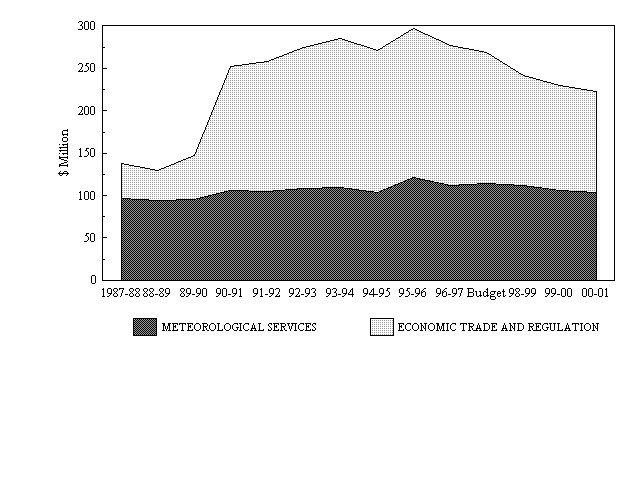
Trends
In Outlays On Other Economic Affairs, NEC
The increase in outlays in 1990-91 reflects the establishment
of a national scheme for the regulation of companies,
and the securities and futures markets which are administered
by the Australian Securities Commission (ASC). The
fall in outlays, after 1994-95, is mainly due to reduced
plant and equipment spending by the ASC and increased
cost recovery of ASC services. Outlays decline from
1996-97 as a result of administrative savings in the
ASC and the Industry Commission, and restructuring
of the Australian Government Analytical Laboratories.
1997-98
and Forward Estimates
-
|
-
|
-
|
- 1996-97
|
- 1997-98
|
- 1998-99
|
- 1999-00
|
- 2000-01
|
-
|
-
|
-
|
- Estimate
|
- Budget
|
- Estimate
|
- Estimate
|
- Estimate
|
- 13C.1
|
- Economic and Trade Regulation
|
- $m
|
- 191.8
|
- 182.5
|
- 157.4
|
- 152.4
|
- 151.4
|
-
|
-
|
- %
|
-
|
- -4.8
|
- -13.8
|
- -3.2
|
- -0.7
|
- 13C.2
|
- Meteorological Services
|
- $m
|
- 129.0
|
- 134.6
|
- 135.5
|
- 132.1
|
- 132.4
|
-
|
-
|
- %
|
-
|
- 4.3
|
- 0.7
|
- -2.5
|
- 0.2
|
-
|
- TOTAL
|
- $m
|
- 320.8
|
- 317.1
|
- 293.0
|
- 284.5
|
- 283.9
|
-
|
-
|
- %
|
-
|
- -1.1
|
- -7.6
|
- -2.9
|
- -0.2
|
13C.1 Economic
and Trade Regulation
-
|
-
|
-
|
- 1996-97
|
- 1997-98
|
- 1998-99
|
- 1999-00
|
- 2000-01
|
-
|
-
|
-
|
- Estimate
|
- Budget
|
- Estimate
|
- Estimate
|
- Estimate
|
-
|
- Industry Commission
|
- $m
|
- 26.3
|
- 24.8
|
- 19.9
|
- 20.1
|
- 21.4
|
-
|
-
|
- %
|
-
|
- -5.7
|
- -19.8
|
- 1.0
|
- 6.5
|
-
|
- Trade Practices and Consumer Affairs
|
- $m
|
- 36.3
|
- 39.5
|
- 39.2
|
- 39.2
|
- 39.4
|
-
|
-
|
- %
|
-
|
- 8.8
|
- -0.8
|
- -
|
- 0.5
|
-
|
- Regulation of Companies & Securities
|
- $m
|
- 101.4
|
- 95.1
|
- 80.8
|
- 76.8
|
- 75.9
|
-
|
-
|
- %
|
-
|
- -6.2
|
- -15.0
|
- -5.0
|
- -1.2
|
-
|
- Other
|
- $m
|
- 27.9
|
- 23.0
|
- 17.6
|
- 16.4
|
- 14.7
|
-
|
-
|
- %
|
-
|
- -17.6
|
- -23.5
|
- -6.8
|
- -10.4
|
-
|
- TOTAL
|
- $m
|
- 191.8
|
- 182.5
|
- 157.4
|
- 152.4
|
- 151.4
|
-
|
-
|
- %
|
-
|
- -4.8
|
- -13.8
|
- -3.2
|
- -0.7
|
Industry Commission
Pending the passage of legislation to establish the
Productivity Commission (PC), the Government has merged
the Industry Commission (IC), the Economic Planning
Advisory Commission (EPAC) and the Bureau of Industry
Economics (BIE) on an administrative basis. Appropriations
to the IC and EPAC will be reallocated to the PC upon
its commencement. The PC's role is to promote public
understanding of productivity issues and its main functions
encompass public inquiries commissioned by the Government,
research projects, performance monitoring, benchmarking
and business regulation review.
Trade Practices and Consumer Affairs
This item provides for the running costs of the Australian
Competition and Consumer Commission (ACCC). The ACCC
is the major enforcement and consumer protection body
responsible for the enforcement of the Trade Practices
Act 1974 and the Prices Surveillance Act 1983. Outlays
also include the running costs of the Bureau of Consumer
Affairs.
Regulation of Companies and Securities
Outlays are dominated by the operating costs of the
ASC, which cover the enforcement of national corporate
regulation as well as information and registry services.
Also included is a grant to the Australian Accounting
Research Foundation, and the operating costs of the
Australian Accounting Standards Board and the Companies
and Securities Advisory Committee.
Other
This item covers the operations of several Commonwealth
organisations. It includes the Commonwealth's contribution
to the following standards organisations: the National
Association of Testing Authorities, Standards Australia
and the National Standards Commission. It also includes
Commonwealth funding of the Australian Government Analytical
Laboratories, the Australian Industrial Property Organisation,
Petroleum Products Freight Subsidy Scheme and the National
Competition Council.
13C.2 Meteorological
Services
This subfunction covers the running costs of the Bureau
of Meteorology (BOM) and the Ionospheric Prediction
Service (IPS), net of recoveries for services. BOM
provides a range of weather and climate data, monitoring,
forecasting, and warning information as well as advisory
services for the general public and specialist users,
such as the aviation industry and the defence force.
It also undertakes research into the nature and mechanisms
of the Australian and southern hemisphere climate,
including greenhouse research. The IPS predicts the
state of the ionosphere for users of radio communications
systems, including for the defence force and telecommunications
organisations.
14. Other Purposes
This category covers outlays on Public Debt Interest
(PDI) and outlays to the six States, the NT, the ACT
and local government. It also includes items classified
to Natural Disaster Relief, the Contingency Reserve,
and the Asset Sales functions.
14A. Public
Debt Interest
Nature
of Outlays
PDI outlays reflect the cost of servicing the stock
of Commonwealth debt incurred to meet budget financing
and other borrowing requirements. It does not include
interest on instalment purchase of buildings, overpayment
of tax and other interest not associated with borrowings.
The Commonwealth uses a range of debt instruments to
meet this funding task. The main instrument is Treasury
Fixed Coupon Bonds. Interest is also incurred in relation
to Treasury Indexed Bonds, and floating interest
rate instruments in the form of short term securities
(5, 13 and 26 week Treasury Notes) and longer term
Treasury Adjustable Rate Bonds.
The bulk of outlays for this function relate to the
Treasury portfolio, with a very small component coming
from the Finance portfolio.
Chart 1. Overview of Commonwealth Outlays on
Public
Debt Interest
(1989-90 Prices)
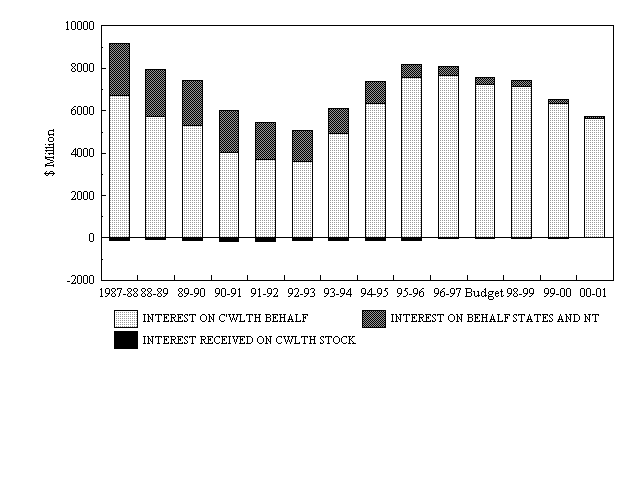
Trends
in Public Debt Interest Outlays
Trends in PDI outlays are governed by the volume of
outstanding Commonwealth debt, the average cost of
debt service (the net effect of interest and exchange
rate movements), the mix of debt instruments and the
term structure of the debt. The balance of influence
of these factors on the growth of total PDI outlays
in real terms will vary over time.
During the early 1990s, the falling average cost of
debt service (due to falling interest rates) outweighed
the rise in the volume of debt, resulting in a fall
in PDI outlays. Volume and cost effects subsequently
led to increases in PDI outlays until 1996-97, when
lower interest rates dampened the growth in PDI outlays
associated with the increased debt volume. PDI outlays
are projected to fall in 1997-98 and over the forward
estimates period in line with projected reductions
in the volume of debt on issue.
Details on the volume of Commonwealth debt on issue
in recent years, and as projected over the forward
estimates period, are provided in Statement
6.
1997-98
and Forward Estimates
-
|
-
|
-
|
- 1996-97
|
- 1997-98
|
- 1998-99
|
- 1999-00
|
- 2000-01
|
-
|
-
|
-
|
- Estimate
|
- Budget
|
- Estimate
|
- Estimate
|
- Estimate
|
- 14A.1
|
- Gross Interest Payments - For the Commonwealth
|
-
|
-
|
-
|
-
|
-
|
-
|
-
|
-
|
- $m
|
- 8874.0
|
- 8536.9
|
- 8674.2
|
- 7845.0
|
- 7190.6
|
-
|
-
|
- %
|
-
|
- -3.8
|
- 1.6
|
- -9.6
|
- -8.3
|
-
|
- For the States
|
- $m
|
- 470.2
|
- 391.2
|
- 319.8
|
- 259.0
|
- 117.4
|
-
|
-
|
- %
|
-
|
- -16.8
|
- -18.3
|
- -19.0
|
- -54.7
|
-
|
- Sub-total
|
- $m
|
- 9344.2
|
- 8928.1
|
- 8994.0
|
- 8104.0
|
- 7308.0
|
-
|
-
|
- %
|
-
|
- -4.5
|
- 0.7
|
- -9.9
|
- -9.8
|
- 14A.2
|
- Interest Received
|
- $m
|
- -23.0
|
- -8.0
|
- -7.0
|
- -7.0
|
- -2.0
|
-
|
-
|
- %
|
-
|
- -65.2
|
- -12.5
|
- -
|
- -71.4
|
-
|
- TOTAL
|
- $m
|
- 9321.2
|
- 8920.1
|
- 8987.0
|
- 8097.0
|
- 7306.0
|
-
|
-
|
- %
|
-
|
- -4.3
|
- 0.7
|
- -9.9
|
- -9.8
|
14A.1 Gross
Interest Payments
-
|
-
|
-
|
- 1996-97
|
- 1997-98
|
- 1998-99
|
- 1999-00
|
- 2000-01
|
-
|
-
|
-
|
- Estimate
|
- Budget
|
- Estimate
|
- Estimate
|
- Estimate
|
-
|
- For the Commonwealth -
|
-
|
-
|
-
|
-
|
-
|
-
|
-
|
- Domestic & Overseas Borrowings (a)
|
- $m
|
- 9151.8
|
- 8711.8
|
- 8857.9
|
- 8037.5
|
- 7383.1
|
-
|
-
|
- %
|
-
|
- -4.8
|
- 1.7
|
- -9.3
|
- -8.1
|
-
|
- Other (b)
|
- $m
|
- -277.8
|
- -174.9
|
- -183.7
|
- -192.5
|
- -192.5
|
-
|
-
|
- %
|
-
|
- -37.0
|
- 5.0
|
- 4.8
|
- -
|
-
|
- Sub-total
|
- $m
|
- 8874.0
|
- 8536.9
|
- 8674.2
|
- 7845.0
|
- 7190.6
|
-
|
-
|
- %
|
-
|
- -3.8
|
- 1.6
|
- -9.6
|
- -8.3
|
-
|
- For the States -
|
-
|
-
|
-
|
-
|
-
|
-
|
-
|
- Borrowings for six States & NT (a)
|
- $m
|
- 439.9
|
- 362.9
|
- 294.5
|
- 238.5
|
- 101.6
|
-
|
-
|
- %
|
-
|
- -17.5
|
- -18.8
|
- -19.0
|
- -57.4
|
-
|
- Savings Bank Agreements (c)
|
- $m
|
- 27.0
|
- 25.0
|
- 22.0
|
- 18.0
|
- 15.0
|
-
|
-
|
- %
|
-
|
- -7.4
|
- -12.0
|
- -18.2
|
- -16.7
|
-
|
- Interest on Behalf of the ACT
|
- $m
|
- 3.3
|
- 3.3
|
- 3.3
|
- 2.5
|
- 0.8
|
-
|
-
|
- %
|
-
|
- -
|
- -
|
- -24.2
|
- -68.0
|
-
|
- Sub-total
|
- $m
|
- 470.2
|
- 391.2
|
- 319.8
|
- 259.0
|
- 117.4
|
-
|
-
|
- %
|
-
|
- -16.8
|
- -18.3
|
- -19.0
|
- -54.7
|
-
|
- TOTAL
|
- $m
|
- 9344.2
|
- 8928.1
|
- 8994.0
|
- 8104.0
|
- 7308.0
|
-
|
-
|
- %
|
-
|
- -4.5
|
- 0.7
|
- -9.9
|
- -9.8
|
-
- (a) Paid under the Commonwealth Inscribed Stock Act
1911 and the Loans Securities Act 1919.
- (b) Largely net interest receipts on the Commonwealth's
swaps portfolio.
- (c) Issued in the past by Queensland to the Commonwealth
Savings Bank. Administered as Commonwealth Government
security debt under the Financial Agreement Act 1994.
-
The decrease in PDI from 1996-97 to 1997-98 largely
reflects the impact of the reduction in debt associated
with the projected headline budget surplus in 1997-98.
The State and NT component of PDI is falling progressively
as Commonwealth Government securities debt previously
raised by the Commonwealth on their behalf are refinanced
by the States and the NT on maturity.
14A.2 Interest
Received
The main source of interest received is that paid to
the Loan Consolidation and Investment Reserve (LCIR),
a Commonwealth trust account which receives interest
on its investments in Commonwealth securities. Interest
paid by the Commonwealth to itself is offset against
payments to provide meaningful outlay figures. The
decrease in interest receipts from 1996-97 reflects
reduced holdings of Commonwealth securities by the
LCIR following maturities and the sale of stock from
its portfolio.
14B. General
Purpose Inter-Government Transactions
Nature
of Outlays
This function covers grants and advances to States
and local government authorities which are not classifiable
to other functions. General purpose assistance to the
States comprises untied assistance that State governments
can spend according to their own budgetary priorities.
This assistance is predominantly determined at the
annual Premiers' Conference.
As local government is a constitutional responsibility
of State governments, general purpose assistance for
local government is classified by the Commonwealth
as a specific purpose payment through State governments.
Most specific purpose assistance to the States is classified
elsewhere in Statement
4 under the relevant function. Detailed information
is provided in Budget
Paper No. 3.
This function includes outlays of the following portfolios:
- Treasury;
- Environment, Sport and Territories;
- Primary Industries and Energy;
- Transport and Regional Development; and
- Finance.
Chart 1. Overview of Commonwealth Outlays on
General
Purpose Inter-Government Transactions
(1989-90 Prices)
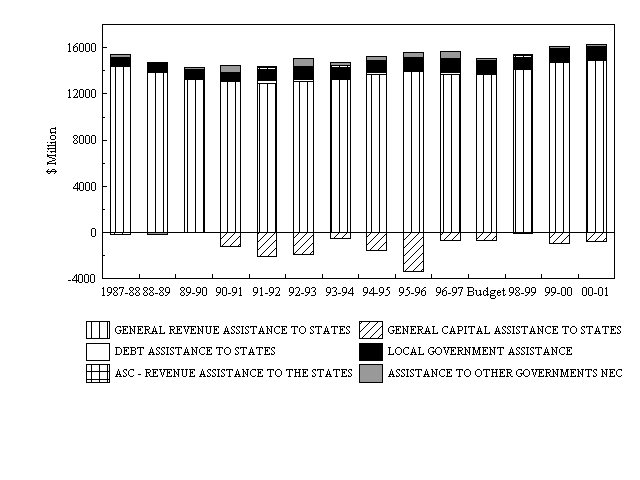
Trends
in General Purpose Inter-Government Transactions Outlays
At the March 1994 Premiers' Conference, it was agreed
that Financial Assistance Grants (FAGs) to the States
would be maintained in real per capita terms over the
next three years. At the 1995 Council of Australian
Governments (COAG) meeting, the Commonwealth agreed,
as part of the Agreement to Implement the National
Competition Policy (NCP) and Related Reforms, to maintain
the real per capita guarantee of the FAGs pool on a
rolling three year basis, and to provide three tranches
of general purpose payments in the form of a series
of Competition Payments commencing in 1997-98. The
Commonwealth has subsequently extended the real per
capita indexation arrangements for FAGs until the end
of 1999-2000, conditional upon the States meeting their
obligations under the Agreement to Implement the NCP
and Related Reforms.
The 1996 Premiers' Conference decided that the States
would make State Fiscal Contribution payments to the
Commonwealth in the three years to 1998-99 to assist
the Commonwealth's deficit reduction programme. The
1997 Premiers' Conference agreed on payments of $627
million in 1997-98 and $313 million in 1998-99. These
payments reflect the decision to partially defer scheduled
payments from the Australian Capital Territory (ACT)
and Tasmania from 1997-98 to 1998-99. The methods of
payment include nominated reductions in specific purpose
payments, direct payments, or reductions in FAGs.
1997-98
and Forward Estimates
-
|
-
|
-
|
- 1996-97
|
- 1997-98
|
- 1998-99
|
- 1999-00
|
- 2000-01
|
-
|
-
|
-
|
- Estimate
|
- Budget
|
- Estimate
|
- Estimate
|
- Estimate
|
- 14B.1
|
- General Revenue Assistance to the States
|
- $m
|
- 15822.3
|
- 16203.4
|
- 17066.7
|
- 18237.7
|
- 18897.5
|
-
|
-
|
- %
|
-
|
- 2.4
|
- 5.3
|
- 6.9
|
- 3.6
|
- 14B.2
|
- General Purpose Capital Assistance to the States
|
- $m
|
- -747.8
|
- -768.0
|
- -80.0
|
- -1135.9
|
- -993.5
|
-
|
-
|
- %
|
-
|
- 2.7
|
- -89.6
|
- na
|
- -12.5
|
- 14B.3
|
- Debt Assistance to the States
|
- $m
|
- 233.0
|
- 72.7
|
- 36.4
|
- 91.0
|
- 84.3
|
-
|
-
|
- %
|
-
|
- -68.8
|
- -49.9
|
- 150.0
|
- -7.4
|
- 14B.4
|
- General Purpose Assistance for Local Government through
the States
|
- $m
|
- 1216.4
|
- 1205.2
|
- 1257.9
|
- 1304.2
|
- 1351.8
|
-
|
-
|
- %
|
-
|
- -0.9
|
- 4.4
|
- 3.7
|
- 3.6
|
- 14B.5
|
- Australian Securities Commission - Revenue Assistance
to the States
|
- $m
|
- 130.3
|
- 134.4
|
- 138.5
|
- 142.8
|
- 147.3
|
-
|
-
|
- %
|
-
|
- 3.1
|
- 3.1
|
- 3.1
|
- 3.2
|
- 14B.6
|
- Assistance to Other Governments, nec
|
- $m
|
- 785.6
|
- 205.1
|
- 199.4
|
- 207.7
|
- 216.1
|
-
|
-
|
- %
|
-
|
- -73.9
|
- -2.8
|
- 4.2
|
- 4.0
|
-
|
- TOTAL
|
- $m
|
- 17439.8
|
- 17052.7
|
- 18618.9
|
- 18847.5
|
- 19703.5
|
-
|
-
|
- %
|
-
|
- -2.2
|
- 9.2
|
- 1.2
|
- 4.5
|
14B.1 General
Revenue Assistance to the States
-
|
-
|
-
|
- 1996-97
|
- 1997-98
|
- 1998-99
|
- 1999-00
|
- 2000-01
|
-
|
-
|
-
|
- Estimate
|
- Budget
|
- Estimate
|
- Estimate
|
- Estimate
|
-
|
- Financial Assistance Grants (a)
|
- $m
|
- 14959.0
|
- 15517.5
|
- 16817.5
|
- 17761.3
|
- 18409.3
|
-
|
-
|
- %
|
-
|
- 3.7
|
- 8.4
|
- 5.6
|
- 3.6
|
-
|
- Identified Road Grants to the States (b)
|
- $m
|
- 383.4
|
- -
|
- -
|
- -
|
- -
|
-
|
-
|
- %
|
-
|
- -100.0
|
- na
|
- na
|
- na
|
-
|
- Special Revenue Assistance
|
- $m
|
- 479.9
|
- 470.8
|
- 28.8
|
- 24.4
|
- 25.0
|
-
|
-
|
- %
|
-
|
- -1.9
|
- -93.9
|
- -15.3
|
- 2.5
|
-
|
- Competition Payments
|
- $m
|
- -
|
- 215.1
|
- 220.5
|
- 452.0
|
- 463.3
|
-
|
-
|
- %
|
-
|
- na
|
- 2.5
|
- 105.0
|
- 2.5
|
-
|
- TOTAL
|
- $m
|
- 15822.3
|
- 16203.4
|
- 17066.7
|
- 18237.7
|
- 18897.5
|
-
|
-
|
- %
|
-
|
- 2.4
|
- 5.3
|
- 6.9
|
- 3.6
|
-
- (a) In the absence of State Fiscal Contributions,
Financial Assistance Grants would be $15,435.6m in
1996-97, $16,144.0m in 1997-98 and $17,131.0m in 1998-99.
- (b) The
notional amounts of road grants that are incorporated
in the forward estimates of FAGs and distributed among
the States on the same basis as FAGs are $391.0m in
1997-98, $405.5m in 1998-99, $420.5m in 1999-00 and
$435.8m in 2000-01.
-
This subfunction covers general revenue assistance
which is not required to be spent by the States in
a specific area. It comprises Financial Assistance
Grants (FAGs), Identified Road Grants (IRGs), Special
Revenue Assistance (SRA) and Competition Payments.
Financial Assistance Grants
The 1997-98 Budget and the forward estimates reflect
the decisions of the 1997 Premiers' Conference and
previous conferences to maintain the level of FAGs
in real per capita terms on a three year rolling basis.
The States have agreed to make State Fiscal Contributions
to the Commonwealth's deficit reduction programme in
1997-98. The need for the contribution of $313 million
in 1998-99 will be reviewed at the 1998 Premiers' Conference
in light of developments in the Commonwealth's fiscal
position.
Identified Road Grants to the States
From 1997-98, all Identified Road Grants will be included
in the FAGs pool and distributed on the same basis
as FAGs, as agreed at the 1996 Premiers' Conference
(see footnote
(b) to Table 14B.1).
Special Revenue Assistance
The majority of Special Revenue Assistance (SRA) in
1997-98 consists of Medicare guarantee payments to
New South Wales and Victoria. In line with the agreed
arrangements, the Commonwealth funds part of these
payments directly, with the remainder being funded
from the FAGs pool. These payments extend until the
end of 1997-98, when the five year Medicare Agreements
with the States expire.
In 1997-98, the ACT will continue to receive SRA in
the form of a transitional allowance and an allowance
for special fiscal needs. The 1997 Premiers' Conference
agreed to additional SRA to the ACT of $10 million
in 1997-98 and $5 million in 1998-99, in the form of
transitional allowances for education and health. The
payments to the ACT are provided directly from the
Commonwealth and not funded from the FAGs pool.
Competition Payments
Under the 1995 Agreement to Implement the NCP and Related
Reforms, the Commonwealth agreed to provide three tranches
of general purpose Competition Payments to the States
from 1997-98, conditional upon them meeting their obligations
under the Agreement. Actual payments in 1997-98 will
be determined after the National Competition Council
reports in June 1997. The increase from 1999-2000 reflects
the second tranche of an additional $200 million in
1994-95 prices. Payments are indexed to the Consumer
Price Index (CPI) and distributed to the States on
a per capita basis.
14B.2 General
Purpose Capital Assistance to the States
-
|
-
|
-
|
- 1996-97
|
- 1997-98
|
- 1998-99
|
- 1999-00
|
- 2000-01
|
-
|
-
|
-
|
- Estimate
|
- Budget
|
- Estimate
|
- Estimate
|
- Estimate
|
-
|
- Capital Grants
|
- $m
|
- 52.6
|
- -
|
- -
|
- -
|
- -
|
-
|
-
|
- %
|
-
|
- -100.0
|
- na
|
- na
|
- na
|
-
|
- Sinking Fund Receipts
|
- $m
|
- -57.4
|
- -49.1
|
- -38.0
|
- -37.2
|
- -24.3
|
-
|
-
|
- %
|
-
|
- -14.5
|
- -22.6
|
- -2.1
|
- -34.7
|
-
|
- Accelerated Sinking Fund Receipts
|
- $m
|
- -743.0
|
- -719.0
|
- -42.0
|
- -1098.7
|
- -969.2
|
-
|
-
|
- %
|
-
|
- -3.2
|
- -94.2
|
- na
|
- -11.8
|
-
|
- TOTAL
|
- $m
|
- -747.8
|
- -768.0
|
- -80.0
|
- -1135.9
|
- -993.5
|
-
|
-
|
- %
|
-
|
- 2.7
|
- -89.6
|
- na
|
- -12.5
|
Capital Grants
The Commonwealth has terminated regional development
programmes to eliminate duplication with State and
local governments in this area. In 1996-97, remaining
general purpose capital grants consisted solely of
outlays for contractual commitments existing at that
time under the Better Cities Programmes. Residual administrative
costs and other payments made under the programmes
are included in 7.
Housing and Community Amenities.
Sinking Fund Receipts
The Financial Agreement Act 1994 requires each of the
States and the Northern Territory (NT) to pay minimum
contributions each year into a sinking fund, administered
on their behalf by the Commonwealth. These contributions
are based on their outstanding levels of Commonwealth
Government Securities (CGS) at 30 June of the previous
year. In addition, the States and NT are required to
make accelerated sinking fund contributions each year,
as necessary, to supplement their fund balances to
enable the redemption of their maturing CGS in that
year.
14B.3 Debt
Assistance to the States
-
|
-
|
-
|
- 1996-97
|
- 1997-98
|
- 1998-99
|
- 1999-00
|
- 2000-01
|
-
|
-
|
-
|
- Estimate
|
- Budget
|
- Estimate
|
- Estimate
|
- Estimate
|
-
|
- Commonwealth Sinking Fund
|
- $m
|
- 12.6
|
- 10.4
|
- 8.3
|
- 8.1
|
- 4.9
|
-
|
-
|
- %
|
-
|
- -17.5
|
- -20.2
|
- -2.4
|
- -39.5
|
-
|
- Assistance for Debt Redemption
|
- $m
|
- 220.4
|
- 62.3
|
- 28.1
|
- 82.9
|
- 79.4
|
-
|
-
|
- %
|
-
|
- -71.7
|
- -54.9
|
- 195.0
|
- -4.2
|
-
|
- TOTAL
|
- $m
|
- 233.0
|
- 72.7
|
- 36.4
|
- 91.0
|
- 84.3
|
-
|
-
|
- %
|
-
|
- -68.8
|
- -49.9
|
- 150.0
|
- -7.4
|
The Financial Agreement Act 1994 requires the Commonwealth
to pay contributions into the State and NT accounts
of the sinking fund, administered by the Commonwealth
on their behalf. These contributions are based on their
outstanding levels of CGS at 30 June of the previous
year.
The Financial Agreement Act 1994 also provides for
the Commonwealth to compensate the States and NT for
the additional interest costs of replacing maturing
CGS with borrowings in their own names, or through
their Authorities, rather than by new CGS (which ceased
to be issued on their behalf in 1989-90). In addition,
assistance for debt redemption compensates the States
for the lower Commonwealth sinking fund contributions
which have resulted from the post-1989-90 arrangements.
Similar assistance is provided in respect of CGS nominally
allocated to the ACT. The variability in the estimates
reflects the debt maturity profiles over the forward
years.
14B.4 General
Purpose Assistance for Local Government through the
States
-
|
-
|
-
|
- 1996-97
|
- 1997-98
|
- 1998-99
|
- 1999-00
|
- 2000-01
|
-
|
-
|
-
|
- Estimate
|
- Budget
|
- Estimate
|
- Estimate
|
- Estimate
|
-
|
- Financial Assistance Grants
|
- $m
|
- 842.6
|
- 834.8
|
- 871.3
|
- 903.3
|
- 936.3
|
-
|
-
|
- %
|
-
|
- -0.9
|
- 4.4
|
- 3.7
|
- 3.7
|
-
|
- Identified Local Road Grants
|
- $m
|
- 373.9
|
- 370.4
|
- 386.6
|
- 400.8
|
- 415.5
|
-
|
-
|
- %
|
-
|
- -0.9
|
- 4.4
|
- 3.7
|
- 3.7
|
-
|
- TOTAL
|
- $m
|
- 1216.4
|
- 1205.2
|
- 1257.9
|
- 1304.2
|
- 1351.8
|
-
|
-
|
- %
|
-
|
- -0.9
|
- 4.4
|
- 3.7
|
- 3.6
|
General purpose assistance is provided to local government
authorities under the Local Government (Financial Assistance)
Act 1995. The Act provides for local government financial
assistance grants (FAGs) and local government road
funds to be increased each year by an escalation factor
which is determined by the Treasurer in light of the
underlying movement in general purpose payments to
the States. This assistance is paid to the States as
a specific purpose payment on the condition that the
funds are passed on to local government. The decline
in outlays in the Budget year results from a Budget
measure which is described in Part
I of Budget Paper No. 2.
Local government FAGs are distributed on an equal per
capita basis, whereas untied local government road
funding is distributed between the States on the basis
of criteria established under the Australian Land Transport
Development Act 1988. In both cases, the intrastate
distribution of these payments to local governments
is determined by the State Grants Commissions on the
basis of fiscal equalisation.
14B.5 Australian
Securities Commission - Revenue Assistance to the States
Following the establishment, on 1 January 1991, of
a national scheme of companies, securities and futures
regulation administered by the Australian Securities
Commission, the Commonwealth compensates the six States
and NT through a specific purpose payment for the loss
of a State revenue base.
14B.6 Assistance
to other Governments, NEC
This subfunction consists of assistance to other levels
of Government that is not elsewhere classified. This
assistance includes:
- *payment by the Commonwealth to Western Australia of
a portion of Commonwealth royalties obtained from the
North West Shelf project, under the provisions of the
Petroleum (Submerged Land) Act 1967;
- *a grant from the Commonwealth to the Northern Territory
in lieu of royalties on uranium mining due to the Commonwealth's
ownership of uranium in the Northern Territory. The
grant is payable at the royalty rate of 1.25 per cent
of net proceeds of sales; and
- *compensation to the ACT for municipal expenditure
and revenue disabilities (as identified by the Commonwealth
Grants Commission) arising from Canberra's status as
the National Capital.
Summary of Commonwealth Outlays to Other Governments
Heads of Government agreed at the Special Premiers'
Conference in July 1991 to continue a practice used
for the first time at the May 1991 Premiers' Conference
of disaggregating net payments to the States into 'to'
and 'through' payments. This approach distinguishes:
- *net payments to State Governments which are payments
made direct to those Governments and excluding those
intended to be passed on to local governments, other
bodies and individuals; and
- *net payments through State Governments which are to
be passed on to local governments, other bodies and
individuals.
The table below provides an overview of total Commonwealth
assistance 'to' and 'through' the States in 1996-97,
1997-98, and the forward years.
Further information on payments 'to' and 'through'
the States can be found in Budget
Paper No. 3.
Summary
of Commonwealth Outlays to Other Governments
-
|
- 1996-97
|
- 1997-98
|
- 1998-99
|
- 1999-00
|
- 2000-01
|
-
|
- Revised
|
- Budget
|
- Estimate
|
- Estimate
|
- Estimate
|
-
|
- $m
|
- $m
|
- $m
|
- $m
|
- $m
|
- TO STATES
|
-
|
-
|
-
|
-
|
-
|
- General Revenue Grants (a)
|
- 15822.3
|
- 16203.4
|
- 17066.7
|
- 18237.7
|
- 18897.5
|
- General Capital Grants
|
- 52.6
|
- 0.0
|
- 0.0
|
- 0.0
|
- 0.0
|
- Total General Purpose Assistance
|
- 15874.9
|
- 16203.4
|
- 17066.7
|
- 18237.7
|
- 18897.5
|
- Base Hospital Funding Grants
|
- 3945.1
|
- 4102.5
|
- 4246.5
|
- 4398.2
|
- 4560.7
|
- Education
|
- 1478.0
|
- 1508.5
|
- 1506.1
|
- 1477.8
|
- 1510.5
|
- Roads Programmes
|
- 823.5
|
- 823.7
|
- 821.6
|
- 773.2
|
- 791.6
|
- Housing (a)
|
- 893.1
|
- 943.0
|
- 932.3
|
- 921.7
|
- 921.7
|
- Accommodation Support Programme
|
- 169.8
|
- 167.8
|
- 166.8
|
- 167.1
|
- 169.7
|
- Home and Community Care
|
- 451.2
|
- 476.3
|
- 504.8
|
- 536.1
|
- 579.1
|
- Rural Adjustment
|
- 107.5
|
- 39.9
|
- 19.7
|
- 11.6
|
- 1.3
|
- Debt Assistance
|
- 233.0
|
- 72.7
|
- 36.4
|
- 91.0
|
- 84.3
|
- Compensation - Companies Regulation
|
- 130.3
|
- 134.4
|
- 138.5
|
- 142.8
|
- 147.3
|
- Other
|
- 3393.5
|
- 2604.4
|
- 2409.7
|
- 2440.8
|
- 2518.5
|
- Total Specific Purpose Payments
|
- 11,624.9
|
- 10,873.2
|
- 10,782.4
|
- 10,960.2
|
- 11,284.6
|
- Total 'To' Payments
|
- 27,499.8
|
- 27,076.5
|
- 27,849.2
|
- 29,197.9
|
- 30,182.1
|
- THROUGH STATES
|
-
|
-
|
-
|
-
|
-
|
- Higher Education
|
- 3,682.6
|
- 3,480.0
|
- 3,272.2
|
- 3,178.7
|
- 3,169.8
|
- Non-Government Schools
|
- 1,985.3
|
- 2,112.0
|
- 2,251.0
|
- 2,391.5
|
- 2,487.7
|
- Local Government Financial Assistance
|
- 842.6
|
- 834.8
|
- 871.3
|
- 903.3
|
- 936.3
|
- Identified Road Grants
|
- 373.9
|
- 370.4
|
- 386.6
|
- 400.8
|
- 415.5
|
- Other
|
- 375.9
|
- 405.1
|
- 420.3
|
- 387.6
|
- 359.4
|
- Total 'Through' Payments
|
- 7,260.1
|
- 7,202.3
|
- 7,201.4
|
- 7,261.9
|
- 7,368.8
|
- Payments Direct to Local Government
|
- 244.4
|
- 247.4
|
- 249.0
|
- 264.3
|
- 278.4
|
- TOTAL PAYMENTS
|
- 35,004.3
|
- 34,526.3
|
- 35,299.5
|
- 36,724.1
|
- 37,829.3
|
- Repayments
|
-
|
-
|
-
|
-
|
-
|
- Accelerated Sinking Fund Receipts
|
- -743.0
|
- -719.0
|
- -42.0
|
- -1,098.7
|
- -969.2
|
- Other
|
- -296.7
|
- -167.7
|
- -155.5
|
- -154.1
|
- -144.6
|
- Total Repayments
|
- -1,039.6
|
- -886.6
|
- -197.4
|
- -1,252.8
|
- -1,113.8
|
- TOTAL OUTLAYS TO/THROUGH OTHER GOVERNMENTS
|
-
- 33,964.6
|
-
- 33,639.6
|
-
- 35,102.1
|
-
- 35,471.3
|
-
- 36,715.5
|
- (a) The amounts shown are net of State Fiscal Contributions.
14C. Natural
Disaster Relief
Nature
of Outlays
The Commonwealth provides assistance for natural disaster
relief.
This function relates to outlays of the Finance portfolio.
Chart 1. Overview of Commonwealth Outlays on
Natural
Disaster Relief
(1989-90 Prices)
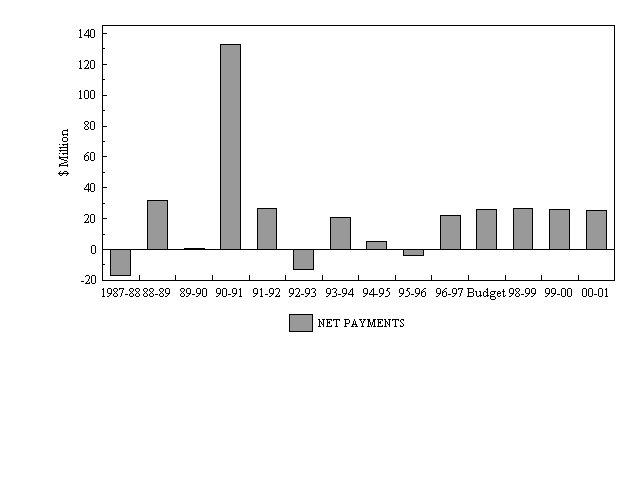
Trends
in Natural Disaster Relief Outlays
Commonwealth assistance towards natural disaster relief
in the period reflects the unpredictability of these
events in terms of incidence and severity. The 1987-88,
1992-93 and 1995-96 years show net repayments of past
Commonwealth loans. Outlays for 1990-91 reflect the
severity and extent of flooding in NSW and QLD, a high
number of cyclones in QLD and payments associated with
the Newcastle earthquake. The forward estimates are
based on a broad average of annual net payments over
recent years.
1997-98
and Forward Estimates
-
|
-
|
-
|
- 1996-97
|
- 1997-98
|
- 1998-99
|
- 1999-00
|
- 2000-01
|
-
|
-
|
-
|
- Estimate
|
- Budget
|
- Estimate
|
- Estimate
|
- Estimate
|
- 14C
|
- Natural Disaster Relief Assistance
|
- $m
|
- 25.8
|
- 30.8
|
- 32.2
|
- 32.2
|
- 32.2
|
-
|
-
|
- %
|
-
|
- 19.4
|
- 4.5
|
- -
|
- -
|
-
|
- TOTAL
|
- $m
|
- 25.8
|
- 30.8
|
- 32.2
|
- 32.2
|
- 32.2
|
-
|
-
|
- %
|
-
|
- 19.5
|
- 4.5
|
- -
|
- -
|
Under the Natural Disaster Relief Arrangements (NDRA),
the Commonwealth reimburses part of the States' outlays
on Personal Hardship and Distress payments and payments
for other eligible disaster relief measures where the
expenditure exceeds certain funding thresholds. A large
part of NDRA payments is made as partial reimbursement
for the relief of Personal Hardship and Distress and
the repair and restoration of essential state and local
government assets.
Some payments are made as concessional loans. The proportion
is equivalent to the share of total State NDRA payments
advanced as loans to individuals and organisations.
NDRA payments are offset by repayments made by the
States on past Commonwealth loans.
Since 1989-90 the effects of drought have not been
eligible for relief. Drought assistance is included
within 10.6
General Assistance Not Allocated to Specific Industries.
14D. Contingency
Reserve
Nature
of Outlays
The Contingency Reserve is an allowance, included in
aggregate outlays figuring, to reflect anticipated
events which cannot be assigned to individual programmes
at budget time. The Reserve is an estimating device
used to ensure that the budget and forward estimates
are based on the best information available at the
time of the budget. It is not a policy reserve.
While the Reserve ensures that aggregate estimates
are as close as possible to expected outcomes, it has
no legal status and is not appropriated in the budget.
Instead, allowances that are included in the Reserve
can only be drawn upon once they have been appropriated
by Parliament.
1997-98
and Forward Estimates
-
|
-
|
-
|
- 1996-97
|
- 1997-98
|
- 1998-99
|
- 1999-00
|
- 2000-01
|
-
|
-
|
-
|
- Estimate
|
- Budget
|
- Estimate
|
- Estimate
|
- Estimate
|
- 14D
|
- Contingency Reserve
|
- $m
|
- -155.3
|
- -1247.2
|
- 1188.6
|
- 2071.1
|
- 3036.9
|
-
|
-
|
- %
|
-
|
- na
|
- na
|
- 74.2
|
- 46.6
|
-
|
- TOTAL
|
- $m
|
- -155.3
|
- -1247.2
|
- 1188.6
|
- 2071.1
|
- 3036.9
|
-
|
-
|
- %
|
-
|
- na
|
- na
|
- 74.2
|
- 46.6
|
The Contingency Reserve makes allowance in the budget
and forward estimates for anticipated events including
the following:
- An allowance in the forward years for changes to forecasts
of wage cost parameters.
- The established tendency for budget estimates of spending
on existing government policy in the forward years
to be revised upward.
- Forward year estimates, particularly for demand driven
appropriations, tend to be conservative and underestimate
the growth in outlays. Experience suggests that revision
of the forward estimates amounts to around 0.75 per
cent outlays in the first year, increasing in each
following year.
- Expected running costs carryovers from 1997-98 into
1998-99.
- Departments and agencies have flexibility, under the
running costs arrangements, to carry forward funds
from the budget year to the following. The estimated
running costs outcome for 1996-97 has been adjusted
to take account of carryovers into 1997-98. A negative
allowance of around 2 per cent of the aggregate running
costs budget has been included in the Contingency Reserve
in 1997-98 to represent the effect of the expected
carryover on total outlays into 1998-99.
- Commercial-in-confidence items which cannot be disclosed
separately.
- The effect of economic parameter revisions for the
budget and forward estimates received too late to be
included in programme estimates.
- An allowance for any flow-on effect to unemployment
and related payments resulting from the Government's
commitment to maintain the single rate of pension at
25 per cent of Male Total Average Weekly Earnings.
- The established tendency for estimates of some programme
expenditure to be overstated in the budget year.
- A small negative allowance has therefore been included.
- The proposed forward year expenditure for new policy
relating to the Federation Fund Trust Account.
- The expected expenditure from the trust account totals
$1 billion with $600 million in outlays expected between
1998-99 and 2000-01 and the balance in the following
two years. The Fund will be used to finance a number
of major projects of national significance. Refer
to Budget Paper
No. 2 for more details. The measure is shown against
the Prime Minister and Cabinet portfolio, and is classified
against the Contingency Reserve function until the
actual type of expenditure is known.
14E. Asset
Sales
Nature
of Outlays
This classification records the net proceeds of the
Government's programme of major asset sales (proceeds
of sales offset by the costs of sale and the running
costs of the Office of Asset Sales). Proceeds derived
from the normal on-going Property Disposal Programmes
of the Departments of Administrative Services and Defence
are reported elsewhere (see 1.
General Public Services and 2.
Defence). Asset sales proceeds are recorded as
offsets within outlays. Most proceeds of sale are
net advances and are not included in underlying outlays.
Chart 1. Overview of Commonwealth Outlays on
Asset
Sales
(1989-90 prices)
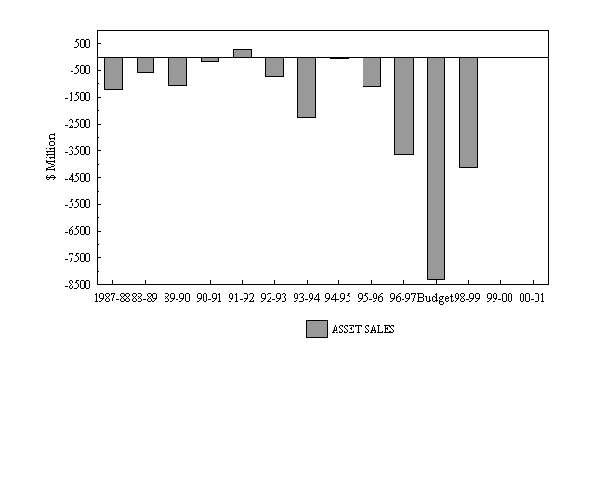
1997-98
and Forward Estimates
-
|
-
|
-
|
- 1996-97
|
- 1997-98
|
- 1998-99
|
- 1999-00
|
- 2000-01
|
-
|
-
|
-
|
- Estimate
|
- Budget
|
- Estimate
|
- Estimate
|
- Estimate
|
- 14E
|
- Asset Sales
|
- $m
|
- -4200.0
|
- -9830.0
|
- -5010.0
|
- -10.0
|
- -
|
-
|
-
|
- %
|
-
|
- 134.0
|
- -49.0
|
- -99.8
|
- -100.0
|
-
|
- TOTAL
|
- $m
|
- -4200.0
|
- -9830.0
|
- -5010.0
|
- -10.0
|
- -
|
-
|
-
|
- %
|
-
|
- 134.0
|
- -49.0
|
- -99.8
|
- -100.0
|
Major asset sales previously announced which are expected
to be completed in 1996-97 or in the budget and forward
years include:
- one-third of the Commonwealth's equity in Telstra;
- the lease of Melbourne, Brisbane and Perth Airports;
- Australian National and National Rail; and
- a number of the business units of the Department of
Administrative Services.
New
Major Asset Sales
Australian Multimedia Enterprises Limited
The Government has decided that the Commonwealth will
divest Australian Multimedia Enterprises Limited by
March 1998 with the means of sale to be settled as
a part of the sale process.
Australian Defence Industries Limited
In 1997-98, the Government is expected to consider
the optimal timing for offering Australian Defence
Industries Limited for sale with the means of sale
and other sale issues also to be considered.
Auscript
The Government has decided to divest Auscript as soon
as possible by trade sale.
National Transmission Network
In light of the recent completion of a scoping study,
the Government will shortly consider whether to offer
the Network for sale with the means of sale and other
sale issues also to be considered.
Phase 2 Airports
The sale of Melbourne, Brisbane and Perth Airports
will be concluded in mid-1997, at which time Phase
1 Airport activities, including establishing an appropriate
regulatory regime, will be completed. It is expected
that the process for addressing the sale of Phase 2
airports will begin early in 1997-98.
Australian National Line Limited
The sale of Australian National Line Limited is a major
asset sale previously announced. It is expected to
be completed in the budget year or forward years.
Sales
Completed after the 1996-97 Budget was presented
Commonwealth Bank of Australia
The Government sold its remaining 50.4 per cent shareholding
in the Commonwealth Bank of Australia (CBA) in July
1996, following a public share offer and a buyback
of shares by CBA. The 399.1 million shares sold in
the public share offer were purchased by investors
under an instalment payment arrangement. Final instalments
are due to be paid by November 1997.
Commonwealth Funds Management
Commonwealth Funds Management (CFM) was sold in two
parts during December 1996. The CFM business was sold
to the Commonwealth Bank for $61.6 million. The subsidiary
company, Total Risk Management (TRM), was sold to Tower,
Perrin, Forster and Crosby Inc for $0.9 million. Proceeds
were received in 1996-97.
Avalon Airport Geelong (AAG)
In February 1997, the Government reached agreement
with Foxerco Pty Ltd, a company jointly owned by Linfox
and Serco, to grant it a long term lease of Avalon
Airport (50 years with a 49 year option) and to sell
the Commonwealth's shares in Avalon Airport Geelong
(AAG). The Government will receive $11 million in net
present value terms (over 20 years) based on current
revenue projections. Proceeds of $1.5 million from
the sale of the shares in AAG, together with initial
lease payments, were received in 1996-97.
Newington Armament Depot
The Newingtom Armament Depot site was sold during 1996-97
to the New South Wales Government. Sale proceeds are
expected in 1998-99 and 1999-2000.
Current
Major Asset Sales
Telstra
The Telstra (Dilution of Public Ownership) Act 1996
was passed by the Parliament in December 1996 and proclaimed
on 1 May 1997.
Planning for the partial sale of Telstra is now underway
using private sector advisers including: joint global
coordinators and joint lead managers; an independent
business adviser (without a selling role); domestic
and international legal counsel; and accounting advisers.
Other roles in the selling syndicate will be filled
later in 1997. It is expected that all Australian stockbroking
firms will be asked to sell Telstra shares.
Federal Airports
The sale of the long-term leases over all Federal airports
forms an important part of the Government's privatisation
programme.
The Government intends to sell long-term leases over
the airports in two stages. Expressions of interest
for Melbourne, Brisbane and Perth Airports were sought
from interested parties in September 1996. The sale
process for these Phase 1 airports is now well advanced,
with revised bids from a short-list of bidders being
lodged in mid-April 1997, and sale completion expected
by 1 July 1997. The next round of airport sales is
expected to commence in mid-1997.
The leasing of Sydney and Sydney West is to be deferred
pending resolution of noise issues at Sydney Airport
and an environmental impact study being conducted for
a second Sydney airport.
Australian Industry Development Corporation Limited
The Government announced in December 1996 that it would
seek expressions of interest in the acquisition of
Australian Industry Development Corporation Limited.
Expressions of interest were received in January 1997
and it is expected that the sale will be finalised
by 30 June 1997.
Australian National
The Government announced its $2 billion rail reform
package in November 1996. As a part of this package,
the Commonwealth's interests in Australian National
and National Rail will be offered for sale. Expressions
of interest for Australian National, as a whole or
in component parts, were sought in March 1997. Preliminary
work is progressing in regard to National Rail.
Department of Administrative Services Businesses
The sale of a number of business units of the Department
of Administrative Services (DAS) was announced in August
1996. These were: Asset Services; Works Australia;
DAS Interiors; DAS Centre for Environmental Management;
DAS Distribution; and DASFLEET (to be either sold or
re-financed). The Government subsequently decided to
sell Australian Operational Support Services and the
commercial arm of the Australian Property Group. The
scoping studies for all of the businesses have been
completed and expressions of interest have been sought
from the market. Sales are expected to be concluded
by mid-1997.
Other
Sale Activity
MacLeod Repatriation Hospital Site
The former MacLeod Repatriation Hospital is adjacent
to the Bundoora-Mont Park psychiatric precinct in Melbourne.
Discussions are being held with the Victorian Government
regarding possible purchase of the site as part of
the proposed redevelopment of this precinct.
Cockatoo Island
There was no progress on the sale during 1996-97 due
to ongoing litigation between the Department of Defence
and Cockatoo Island Dockyard Pty Ltd, the former manager
of the Island. The future disposal of the Island is
the portfolio responsibility of the Department of Defence.
SUMMARY OF OUTLAYS
MEASURES
- Summary of outlays measures in the 1996-97 Mid Year
Economic and Fiscal Outlook
|
-
|
- 1997-98
- $m
|
- 1998-99
- $m
|
- 1999-00
- $m
|
- 2000-01
- $m
|
- ADMINISTRATIVE SERVICES
|
-
|
-
|
-
|
-
|
- Funding for the Menzies Research Centre and the Evatt
Foundation
|
- 0.2
|
- 0.2
|
- 0.2
|
- 0.2
|
- Total
|
- 0.2
|
- 0.2
|
- 0.2
|
- 0.2
|
-
|
-
|
-
|
-
|
-
|
- COMMUNICATIONS AND THE ARTS
|
-
|
-
|
-
|
-
|
- Regional Telecommunications Infrastructure Fund
|
- 50.0
|
- 50.0
|
- 50.0
|
- 50.0
|
- Proceeds from sale of additional Spectrum
|
- nfp
|
- nfp
|
- nfp
|
- nfp
|
- Funding for Radiofrequency Electromagnetic Energy Public
Health Issues (a)
|
- 0.3
|
- 0.3
|
- 0.3
|
- 0.3
|
- Total
|
- nfp
|
- nfp
|
- nfp
|
- nfp
|
-
|
-
|
-
|
-
|
-
|
- EMPLOYMENT, EDUCATION, TRAINING AND YOUTH AFFAIRS
|
-
|
-
|
-
|
-
|
- Higher Education Contribution Scheme repayment exemption
for those in receipt of Medicare exemption or reduction
because of low family income (b)
|
- 0.0
|
- 0.0
|
- 0.0
|
- 0.0
|
- Change the age of Independence for AUSTUDY to 25 years
|
- 9.0
|
- 10.4
|
- 11.2
|
- 12.1
|
- Drought - Extension of recovery period (a)
|
- 2.8
|
- 0.4
|
- 0.0
|
- 0.0
|
- Total
|
- 11.8
|
- 10.8
|
- 11.2
|
- 12.1
|
-
|
-
|
-
|
-
|
-
|
- ENVIRONMENT, SPORT AND TERRITORIES
|
-
|
-
|
-
|
-
|
- Great Barrier Reef Marine Park Authority - Reinstatement
of savings related to the Environment Management Charge
revenue increase
|
- 2.7
|
- 0.0
|
- 0.0
|
- 0.0
|
- Additional funding for Natural Heritage Trust of Australia
Reserve
|
- 25.0
|
- 25.0
|
- 25.0
|
- 25.0
|
- Total
|
- 27.7
|
- 25.0
|
- 25.0
|
- 25.0
|
-
|
-
|
-
|
-
|
-
|
- HEALTH AND FAMILY SERVICES
|
-
|
-
|
-
|
-
|
- Provision of safety net arrangements in connection
with 1996-97 Budget measure limiting Medicare access
to new doctors without post graduate qualifications
|
- 0.4
|
- 5.8
|
- 11.3
|
- 16.1
|
- Adjust 1996-97 Budget measure reducing Medicare benefits
for psychiatry consultations in excess of 50 per patient
per year
|
- 0.4
|
- 0.4
|
- 0.4
|
- 0.4
|
- Funding for Radiofrequency Electromagnetic Energy Public
Health Issues (a)
|
- 0.7
|
- 0.7
|
- 0.7
|
- 0.7
|
- Drought - Extension of recovery period (a)
|
- 0.4
|
- 0.0
|
- 0.0
|
- 0.0
|
- Total
|
- 1.9
|
- 6.9
|
- 12.4
|
- 17.3
|
-
|
-
|
-
|
-
|
-
|
- IMMIGRATION AND MULTICULTURAL AFFAIRS
|
-
|
-
|
-
|
-
|
- Regionally sponsored migration scheme
|
- 0.5
|
- 0.5
|
- 0.5
|
- 0.5
|
- Total
|
- 0.5
|
- 0.5
|
- 0.5
|
- 0.5
|
-
|
-
|
-
|
-
|
-
|
- INDUSTRY, SCIENCE AND TOURISM
|
-
|
-
|
-
|
-
|
- Nuclear Spent Fuel Rods - Repayment of borrowings
|
- 3.9
|
- 0.0
|
- 0.0
|
- 0.0
|
- Extension of the operation of the Shipbuilding Bounty
to 31 December 1997 (c)
|
- 10.0
|
- 0.0
|
- 0.0
|
- 0.0
|
- Amendment of the proposed termination date of the book
bounty to 30 June 1997
|
- 3.6
|
- 0.0
|
- 0.0
|
- 0.0
|
- Total
|
- 17.5
|
- 0.0
|
- 0.0
|
- 0.0
|
-
|
-
|
-
|
-
|
-
|
- PRIMARY INDUSTRIES AND ENERGY
|
-
|
-
|
-
|
-
|
- Drought - Extension of recovery period (a)
|
- 27.3
|
- 0.0
|
- 0.0
|
- 0.0
|
- Total
|
- 27.3
|
- 0.0
|
- 0.0
|
- 0.0
|
-
|
-
|
-
|
-
|
-
|
- SOCIAL SECURITY
|
-
|
-
|
-
|
-
|
- Correction of anomalies in the measure to reduce the
maximum Rent Assistance payable to singles in shared
accommodation
|
- 1.7
|
- 1.7
|
- 1.8
|
- 1.8
|
- Exclude Disability Support Pensioners and Carer Pensioners
from the application of sharers' rate from Rent Assistance
(d)
|
- 5.4
|
- 7.0
|
- 7.5
|
- 13.2
|
- Interim Computer Mainframe Leases (d)
|
- 7.4
|
- 4.8
|
- 0.0
|
- 0.0
|
- Modify eligibility of, and payment conditions for,
Partners' and Widows' Allowance Recipients and Widows'
Pensions (d)
|
- 7.6
|
- 9.1
|
- 10.3
|
- 7.4
|
- Application of time limits to the recovery of certain
debts (d)
|
- 23.6
|
- 66.2
|
- 68.9
|
- 70.1
|
- Tighten Newstart Allowance activity test - delay in
implementation
|
- 0.8
|
- 0.0
|
- 0.0
|
- 0.0
|
- Drought - extension of recovery period (a)
|
- 2.2
|
- 0.0
|
- 0.0
|
- 0.0
|
- Total
|
- 48.6
|
- 88.8
|
- 88.4
|
- 92.5
|
-
|
-
|
-
|
-
|
-
|
- TRANSPORT AND REGIONAL DEVELOPMENT
|
-
|
-
|
-
|
-
|
- Restructure of Australian National Railways Commission
(ANRC)
|
- nfp
|
- nfp
|
- nfp
|
- nfp
|
- Total
|
- nfp
|
- nfp
|
- nfp
|
- nfp
|
- (a) Measure affects more than one portfolio.
- (b) This measure reduces the headline balance by $15.7
million in 1997-98, $16.0 million in 1998-99, $17.6
million in 1999-00 and $17.6 million in 2000-01.
- (c) See also the budget measure 'Extension of application
of the Shipbuilding Bounty' under the Industry, Science
and Tourism portfolio.
- (d) Estimates have been revised since the Mid Year
Economic and Fiscal Outlook.
|
Summary of outlays measures introduced in the Budget
and since the 1996-97 Mid Year Economic and Fiscal
Outlook
|
-
|
- 1997-98
- $m
|
- 1998-99
- $m
|
- 1999-00
- $m
|
- 2000-01
- $m
|
- ADMINISTRATIVE SERVICES
|
-
|
-
|
-
|
-
|
- Withdrawal from the direct provision of certain support
services
|
- 1.5
|
- -8.1
|
- -11.8
|
- -12.0
|
- Sale of the commercial arm of the Domestic Property
Group (formerly known as the Australian Property Group)
(a) (c)
|
- 13.3
|
- 8.7
|
- 1.5
|
- 1.5
|
- Revised funding arrangements for the repair, maintenance
and refurbishment of properties remaining in Commonwealth
ownership
|
- -46.8
|
- -52.2
|
- -8.2
|
- -29.7
|
- Reduction in major capital works
|
- -13.0
|
- 0.0
|
- 0.0
|
- 0.0
|
- Remove preset payments to fire brigades for callouts
on Commonwealth properties
|
- -1.7
|
- -14.9
|
- -15.2
|
- -15.5
|
- Restriction to VIP transport (COMCAR) services to Members
|
- 9.4
|
- 4.1
|
- 4.1
|
- 4.1
|
- Annual Grants in Aid to community organisations
|
- 0.1
|
- 0.1
|
- 0.1
|
- 0.1
|
- Savings in running costs to fund annual Grants in
Aid to community organisations
|
- -0.1
|
- -0.1
|
- -0.1
|
- -0.1
|
- Provision of funding to the Australian Electoral Commission
for the cost of the election of delegates to the Constitutional
Convention
|
- 24.0
|
- 0.0
|
- 0.0
|
- 0.0
|
- Efficiencies in Whole of Government Information Technology
Infrastructure (a)
|
- 0.0
|
- -25.0
|
- -1.8
|
- -2.0
|
- Organisation and conduct of the Constitutional Convention
(a)
|
- 0.1
|
- 0.0
|
- 0.0
|
- 0.0
|
- Total
|
- -13.2
|
- -87.4
|
- -31.4
|
- -53.6
|
-
|
-
|
-
|
-
|
-
|
- ATTORNEY-GENERAL'S
|
-
|
-
|
-
|
-
|
- Savings in Attorney-General's portfolio running costs
|
- -26.5
|
- -26.9
|
- -27.4
|
- -27.9
|
- Additional specific savings in Attorney-General's portfolio
running costs
|
- 0.0
|
- -7.1
|
- -7.2
|
- -7.4
|
- Reform of the provision of legal services provided
by the Legal Practice to enhance contestability and
competitiveness
|
- 14.8
|
- 8.5
|
- 0.0
|
- 0.0
|
- Introduction of full cost recovery for the Office of
Film and Literature Classification
|
- 0.0
|
- -1.2
|
- -1.2
|
- -1.2
|
- Additional savings from the transfer of the industrial
relations jurisdiction to the Federal Court
|
- 0.0
|
- -0.4
|
- -1.2
|
- -1.4
|
- Additional funding for the Federal Court and the National
Native Title Tribunal for workload increases and amendments
to the Native Title Act 1993
|
- 16.1
|
- 14.5
|
- 14.8
|
- 15.1
|
- Divestment of Auscript (a)
|
- 4.2
|
- -0.3
|
- -0.2
|
- 0.0
|
- Review of funding arrangements for the Australian Federal
Police Adjustment Scheme
|
- 0.9
|
- 1.0
|
- 1.0
|
- 1.0
|
- Additional funding to target serious and large scale
fraud and related crime against the Commonwealth
|
- 6.9
|
- 6.7
|
- 6.8
|
- 0.0
|
- Additional funding for the Protective Security Coordination
Centre for diplomatic and consular protection
|
- 1.1
|
- 0.0
|
- 0.0
|
- 0.0
|
- Rationalisation of the Australian Protective Service
through greater contestability
|
- 11.3
|
- 1.2
|
- -0.7
|
- -1.7
|
- Revised arrangements for personal security for Senators
and Members (other than Ministers), former office holders,
their staff, and their families
|
- -1.6
|
- -1.6
|
- -1.6
|
- -1.6
|
- Replacement of security vehicles
|
- 0.1
|
- 0.1
|
- 0.1
|
- 0.1
|
- Sydney 2000 Games - Olympics and Paralympics (a)
|
- 1.0
|
- 10.4
|
- 21.6
|
- 16.3
|
- Efficiencies in Whole of Government Information Technology
Infrastructure (a)
|
- 0.0
|
- 0.0
|
- -1.4
|
- -3.1
|
- Total
|
- 28.3
|
- 4.9
|
- 3.4
|
- -11.8
|
-
|
-
|
-
|
-
|
-
|
- COMMUNICATIONS AND THE ARTS
|
-
|
-
|
-
|
-
|
- Grants in support of Centenary of Federation community
activities
|
- 6.0
|
- 0.0
|
- 0.0
|
- 0.0
|
- Additional funding to the Visions of Australia programme
to continue the provision for touring of cultural exhibitions
|
- 1.5
|
- 1.5
|
- 0.0
|
- 0.0
|
- Savings from the Cultural Development Programme to
absorb the costs of the Visions of Australia programme
|
- -1.5
|
- -1.5
|
- 0.0
|
- 0.0
|
- Continuation of funding to the Australian Children's
Television Foundation
|
- 0.8
|
- 0.8
|
- 0.8
|
- 0.8
|
- Funding for development of the National Museum of Australia
|
- 7.0
|
- 0.0
|
- 0.0
|
- 0.0
|
- New funding for the Australian Film Finance Corporation
|
- 0.0
|
- 48.0
|
- 48.0
|
- 48.0
|
- Continued funding of Film Australia to maintain the
National Interest Programme
|
- 0.0
|
- 6.6
|
- 0.0
|
- 0.0
|
- Reduction in funding of the Australian Film Commission's
Television Production Fund
|
- -5.0
|
- 0.0
|
- 0.0
|
- 0.0
|
- Funding provided to Symphony Australia Holdings Pty
Ltd for orchestral services previously performed by
the ABC
|
- 32.0
|
- 32.5
|
- 33.1
|
- 33.7
|
- Transfer of base funding from the ABC to establish
Symphony Australia Holdings Pty Ltd
|
- -32.0
|
- -32.5
|
- -33.1
|
- -33.7
|
- Deferral of ABC debt repayments
|
- 4.8
|
- -4.8
|
- 0.0
|
- 0.0
|
- Additional funding to the Australian Broadcasting Corporation
(ABC) for the broadcast of English and Tok Pisin language
radio services by Radio Australia
|
- 4.7
|
- 4.8
|
- 4.9
|
- 5.0
|
- Savings from broadcasting and television capital works
to offset additional funding provided to the Australian
Broadcasting Corporation (ABC) for Radio Australia
services
|
- -3.2
|
- -3.3
|
- -3.4
|
- -3.4
|
- Savings in transmission costs arising from the reduced
broadcasting of shortwave radio services by Radio Australia
|
- -1.6
|
- -2.0
|
- -3.1
|
- -4.2
|
- Reduction in Government subsidy as a result of the
sale or wind-up of Australia Television
|
- -3.5
|
- -3.5
|
- 0.0
|
- 0.0
|
- Application of the efficiency dividend to the Special
Broadcasting Service
|
- -0.9
|
- -1.6
|
- -2.5
|
- -3.4
|
- Funding for setup costs and new functions of the Australian
Communications Authority
|
- 3.6
|
- 0.9
|
- 0.6
|
- 0.6
|
- Funding for costs incurred by AUSTEL in 1996-97 to
implement telecommunications reform initiatives
|
- 0.6
|
- 0.0
|
- 0.0
|
- 0.0
|
- Funding for the Australian Communications Authority
to enhance administration of cabler licensing
|
- 0.2
|
- 0.2
|
- 0.2
|
- 0.2
|
- Increased efficiency dividend on Communications and
the Arts portfolio running costs
|
- -3.1
|
- -3.1
|
- -3.1
|
- -3.2
|
- Efficiencies in Whole of Government Information Technology
Infrastructure (a)
|
- 0.0
|
- 0.0
|
- -1.0
|
- -2.2
|
- Total
|
- 10.4
|
- 43.0
|
- 41.4
|
- 38.2
|
-
|
-
|
-
|
-
|
-
|
- EMPLOYMENT, EDUCATION, TRAINING AND YOUTH AFFAIRS
|
-
|
-
|
-
|
-
|
- Phase out specific funding for Language Australia
|
- -0.5
|
- -1.0
|
- -1.5
|
- -1.5
|
- Improvement and streamlining of Higher Education Contribution
Scheme arrangements (d)
|
- 1.0
|
- 1.6
|
- 1.9
|
- 2.1
|
- Higher education restructuring and rationalisation
package
|
- 10.2
|
- 7.3
|
- 4.3
|
- 4.4
|
- Phased abolition of the Higher Education Commonwealth
Industry Places Scheme
|
- -5.2
|
- -16.5
|
- -22.7
|
- -23.0
|
- Reduction of National Board of Employment Education
and Training administrative budget and removal of Australian
Language and Literacy Council funds
|
- -2.9
|
- -2.7
|
- -2.8
|
- -2.8
|
- Increased AUSTUDY for families with two or more tertiary
students living away from home
|
- 1.6
|
- 1.5
|
- 1.6
|
- 1.6
|
- Improved targeting of ABSTUDY
|
- -5.0
|
- -10.9
|
- -11.2
|
- -11.6
|
- Benchmarking efficiencies in Vocational Education and
Training Grants to the States
|
- -10.0
|
- -20.3
|
- -20.7
|
- -21.0
|
- Changes to entry level training employer incentives
|
- -0.9
|
- 6.4
|
- 16.2
|
- 29.5
|
- Work for the Dole Initiative (a)
|
- 11.0
|
- 3.8
|
- 0.0
|
- 0.0
|
- Subsume National Skills Shortages Programme into the
regional assistance element of Enterprise and Adjustment
Programme
|
- -2.1
|
- -2.8
|
- -2.9
|
- -3.0
|
- Savings in Employment, Education, Training and Youth
Affairs portfolio running costs
|
- 0.0
|
- -15.2
|
- -15.5
|
- -15.8
|
- Labour Market Programme funding adjustment
|
- -30.2
|
- 0.0
|
- 0.0
|
- 0.0
|
- Rental assistance to people living in public housing
- Remove double subsidy (a)
|
- -0.1
|
- -0.2
|
- -0.2
|
- -0.2
|
- Efficiencies in Whole of Government Information Technology
Infrastructure (a)
|
- 0.0
|
- -0.7
|
- -11.6
|
- -11.4
|
- Total
|
- -33.1
|
- -49.7
|
- -65.1
|
- -52.7
|
-
|
-
|
-
|
-
|
-
|
- ENVIRONMENT SPORT AND TERRITORIES
|
-
|
-
|
-
|
-
|
- Environment, Sport and Territories portfolio savings
initiatives
|
- -5.0
|
- -5.7
|
- -4.5
|
- -5.2
|
- Natural Heritage Trust of Australia Reserve (a)
|
- 161.9
|
- 265.4
|
- 272.7
|
- 254.9
|
- Willandra Lakes Structural Adjustment Package
|
- 2.0
|
- 0.0
|
- 0.0
|
- 0.0
|
- Payment to QLD - Sugar Coast Environment Rescue Package
|
- 1.0
|
- 2.0
|
- 0.0
|
- 0.0
|
- Funding for capital works at Orielton Lagoon in Tasmania
|
- 0.7
|
- 0.0
|
- 0.0
|
- 0.0
|
- Sydney 2000 Games - Olympics and Paralympics (a)
|
- 0.0
|
- 50.0
|
- 50.0
|
- 50.0
|
- Discontinuation of the Save the Bush Programme
|
- -1.5
|
- -1.5
|
- 0.0
|
- 0.0
|
- Grant to AAP Mawson's Huts Foundation for the restoration
effort on Mawson's Huts (c)
|
- 0.3
|
- 0.0
|
- 0.0
|
- 0.0
|
- Maintain Local Government General Purpose Assistance
Grants in real terms - Determination of 1997-98 payments
|
- -14.7
|
- -15.2
|
- -15.8
|
- -16.4
|
- Restoration and management of National Assets Programme
in the ACT
|
- 5.0
|
- 5.1
|
- 5.2
|
- 5.3
|
- Indian Ocean Territories - Recurrent funding adjustment
|
- 3.0
|
- 0.0
|
- 0.0
|
- 0.0
|
- Efficiencies in Whole of Government Information Technology
Infrastructure (a)
|
- 0.0
|
- 0.0
|
- -0.2
|
- -1.9
|
- Total
|
- 152.7
|
- 300.0
|
- 307.4
|
- 286.7
|
-
|
-
|
-
|
-
|
-
|
- FINANCE
|
-
|
-
|
-
|
-
|
- Efficiencies in Whole of Government Information Technology
Infrastructure - Additional funding for Office of Government
Information Technology
|
- 0.0
|
- 8.6
|
- 4.7
|
- 0.0
|
- Divestment of Auscript - Office of Asset Sales - Cost
of sale (a)
|
- 0.4
|
- 0.0
|
- 0.0
|
- 0.0
|
- Sale of the commercial arm of the Domestic Property
Group (formerly known as the Australian Property Group)
- Office of Asset Sales - Cost of sale (a)
|
- 0.5
|
- 0.0
|
- 0.0
|
- 0.0
|
- Sale of the commercial arm of the Domestic Property
Group (formerly known as the Australian Property Group)
- Office of Asset Sales - Proceeds of sale (a)
|
- nfp
|
- nfp
|
- nfp
|
- nfp
|
- Office of Asset Sales - Additional running costs in
relation to sales/reviews in the 1997-98 Budget
|
- 0.3
|
- 0.0
|
- 0.0
|
- 0.0
|
- Efficiencies in Whole of Government Information Technology
Infrastructure (a)
|
- 0.0
|
- -2.0
|
- -2.3
|
- -2.5
|
- Total
|
- nfp
|
- nfp
|
- nfp
|
- nfp
|
-
|
-
|
-
|
-
|
-
|
- FOREIGN AFFAIRS AND TRADE
|
-
|
-
|
-
|
-
|
- Closure of Australian diplomatic missions in Copenhagen
and Nauru
|
- -1.5
|
- -1.9
|
- -2.0
|
- -2.0
|
- Reduction in Grants and Contributions Programme
|
- -0.9
|
- -1.0
|
- -1.0
|
- -1.0
|
- Reduction in overseas aid
|
- -7.5
|
- -7.7
|
- -7.9
|
- -8.1
|
- Transfer from the overseas aid programme to fund part
of the cost of maintaining Radio Australia services
|
- -4.0
|
- -4.1
|
- -4.2
|
- -4.3
|
- Increased cost recovery by Austrade
|
- -2.0
|
- -3.0
|
- -4.1
|
- -5.3
|
- Accelerated recovery of International Trade Enhancement
Scheme loan funds
|
- -5.0
|
- -3.0
|
- -1.0
|
- 0.0
|
- Sydney 2000 Games - Olympics and Paralympics (a)
|
- 0.4
|
- 2.6
|
- 3.7
|
- 2.1
|
- Efficiencies in Whole of Government Information Technology
Infrastructure (a)
|
- 0.0
|
- -0.1
|
- -1.4
|
- -2.1
|
- Total
|
- -20.5
|
- -18.2
|
- -17.9
|
- -20.7
|
-
|
-
|
-
|
-
|
-
|
- HEALTH AND FAMILY SERVICES
|
-
|
-
|
-
|
-
|
- National Public Health - Continuation of Public Health
Programmes
|
- 11.5
|
- 22.3
|
- 0.0
|
- 0.0
|
- Restructure arrangements for funding services related
to the provision of methadone
|
- 0.0
|
- -1.9
|
- -7.8
|
- -9.6
|
- Development of a National Food Hygiene Standard
|
- 0.9
|
- 1.7
|
- 1.2
|
- 0.0
|
- Supplementation of the Australia New Zealand Food Authority
funding base
|
- 0.7
|
- 1.8
|
- 1.6
|
- 1.3
|
- Comprehensive National Immunisation Strategy (a)(c)
|
- 3.3
|
- 3.3
|
- 3.3
|
- 3.4
|
- Funding mechanism for the purchase of essential vaccines
including Hepatitis B vaccine
|
- 2.6
|
- 3.9
|
- 3.9
|
- 4.0
|
- Hepatitis B Pre-Adolescent Immunisation Delivery Programme
|
- 0.2
|
- 0.4
|
- 0.5
|
- 0.5
|
- Strengthening Australia's health and medical research
workforce
|
- 0.8
|
- 1.4
|
- 2.3
|
- 2.6
|
- Revised process for Medicare Benefits Schedule listing
and review
|
- 1.5
|
- 0.5
|
- -0.5
|
- -3.1
|
- Adjust Medicare benefits when more than one person
is treated during a home visit
|
- -2.0
|
- -3.5
|
- -3.7
|
- -3.8
|
- Adjust Medicare benefits for some optometrical consultations
(a)
|
- -7.8
|
- -13.9
|
- -14.8
|
- -15.5
|
- National Rural and Remote Health Support Programme
|
- 2.0
|
- 3.6
|
- 5.5
|
- 6.3
|
- Pilot study of alternative funding arrangements for
rural obstetric services
|
- 0.0
|
- 0.0
|
- 0.0
|
- 0.0
|
- Refocusing the General Practice Strategy on outcomes
|
- -34.4
|
- -28.0
|
- -37.9
|
- -39.9
|
- Combine General Practice Evaluation Programmes and
adjust to reflect current spending levels
|
- -2.0
|
- -2.0
|
- -2.1
|
- -2.1
|
- Introduction of electronic commerce for Medicare claiming
|
- -0.1
|
- 0.1
|
- 11.7
|
- 16.4
|
- Therapeutic group premiums (a)
|
- -41.4
|
- -157.5
|
- -173.8
|
- -188.7
|
- National Prescriber Service
|
- 0.4
|
- -8.1
|
- -8.0
|
- -7.9
|
- Delisting medicine items for less serious medical conditions
from the Pharmaceutical Benefits Schedule (a)
|
- -10.9
|
- -29.7
|
- -33.4
|
- -37.6
|
- Public education campaign for private health insurance
and Health Insurance Commission restructuring
|
- 3.5
|
- 0.5
|
- 0.3
|
- 0.0
|
- Initiatives to stimulate microeconomic reform in management
of acute health care and information technology and
performance measurement
|
- 6.1
|
- 11.7
|
- 12.7
|
- 9.8
|
- Renewal of the National Mental Health Strategy
|
- 0.2
|
- 7.5
|
- 11.8
|
- 9.0
|
- Extension of funding for palliative care
|
- 14.7
|
- 0.0
|
- 0.0
|
- 0.0
|
- A Planning System to influence the location and supply
of new child care places with annual limit of 7,000
new private places for 1998 and 1999 only
|
- -9.7
|
- -41.8
|
- -72.3
|
- -83.1
|
- Improve targeting of Children's Services Programme
to work related care (a)
|
- -4.4
|
- -16.0
|
- -25.4
|
- -34.9
|
- Increase supply of Family Day Care places
|
- 0.7
|
- 1.7
|
- 3.3
|
- 5.1
|
- Reform of school age care (a)
|
- 5.0
|
- 5.1
|
- 2.5
|
- -1.3
|
- Broadbanding other family and children's services
|
- -3.0
|
- -6.4
|
- -6.6
|
- -6.8
|
- Pay Childcare Assistance fortnightly in arrears
|
- 0.0
|
- -32.5
|
- -3.1
|
- -3.2
|
- Revised arrangements for emergency relief funding
|
- 0.7
|
- 1.9
|
- 3.0
|
- 9.5
|
- Targeted support for people with dementia and their
carers
|
- 2.5
|
- 2.5
|
- 2.6
|
- 2.6
|
- Best practice grants for dementia specific facilities
|
- 0.6
|
- 0.0
|
- 0.0
|
- 0.0
|
- Residential aged care structural reform - Additional
funding for systems development
|
- 4.4
|
- 0.9
|
- 0.2
|
- 0.2
|
- Carers' support and information
|
- 1.2
|
- 2.3
|
- 2.3
|
- 2.4
|
- Additional accommodation support places for people
with disabilities and their families
|
- 5.9
|
- 11.8
|
- 18.0
|
- 18.3
|
- Replacement of speech processors for children with
cochlear implants
|
- 0.6
|
- 0.4
|
- 0.4
|
- 0.5
|
- Funding for National Telephone Typewriter Relay Service
|
- 0.0
|
- -7.9
|
- -7.9
|
- -8.0
|
- Support for social and economic micro-simulation modelling
|
- 0.1
|
- 0.3
|
- 0.3
|
- 0.3
|
- More Time for Business - Government's Small Business
Statement (a)(c)
|
- 0.3
|
- 0.0
|
- 0.0
|
- 0.0
|
- Revised arrangements for carers of adults and children
with disabilities (a)
|
- -0.3
|
- 20.4
|
- 22.8
|
- 25.7
|
- Extend the period of the income test for the 'low income'
Health Care Card from four to eight weeks (a)
|
- 0.0
|
- -1.7
|
- -1.8
|
- -1.8
|
- Amendments to migrant two-year waiting period for social
security payments (a)(b)(c)
|
- 8.1
|
- 0.9
|
- 2.8
|
- 2.8
|
- Introduce a Bonus Plan for persons deferring retirement
(a)
|
- 0.0
|
- -0.6
|
- -1.7
|
- -2.5
|
- Link treatment benefit eligibility to pension rate
(a)
|
- 0.0
|
- -0.1
|
- -0.1
|
- -0.1
|
- Work for the Dole Initiative (a)
|
- 0.5
|
- 0.1
|
- 0.0
|
- 0.0
|
- Addressing anomalies in entitlements for veterans deployed
overseas (a)
|
- -0.1
|
- -0.2
|
- -0.3
|
- -0.4
|
- Efficiencies in Whole of Government Information Technology
Infrastructure (a)
|
- 0.0
|
- -1.9
|
- -11.0
|
- -10.5
|
- Total
|
- -37.1
|
- -246.7
|
- -299.2
|
- -340.1
|
-
|
-
|
-
|
-
|
-
|
- IMMIGRATION AND MULTICULTURAL AFFAIRS
|
-
|
-
|
-
|
-
|
- Health assessments, health undertakings and medical
reviews
|
- 2.3
|
- 1.5
|
- 1.6
|
- 1.6
|
- Enhanced services for business entrants
|
- 0.8
|
- 0.8
|
- 0.9
|
- 1.0
|
- Merging of the Migration Internal Review Office and
the Immigration Review Tribunal (c)
|
- 1.3
|
- 0.7
|
- -0.5
|
- -1.3
|
- Extension of the Migration Agents Registration Scheme
(c)
|
- 0.6
|
- 0.0
|
- 0.0
|
- 0.0
|
- Increased efficiency dividend on Immigration and Multicultural
Affairs portfolio running costs
|
- -3.4
|
- -3.5
|
- -3.6
|
- -3.6
|
- Efficiencies in Whole of Government Information Technology
Infrastructure (a)
|
- 0.0
|
- -0.3
|
- -3.6
|
- -3.6
|
- Total
|
- 1.6
|
- -0.8
|
- -5.2
|
- -5.9
|
-
|
-
|
-
|
-
|
-
|
- INDUSTRIAL RELATIONS
|
-
|
-
|
-
|
-
|
- Referral to the Commonwealth of the Victorian industrial
relations system
|
- 2.2
|
- 2.3
|
- 2.3
|
- 2.4
|
- Efficiencies in Whole of Government Information Technology
Infrastructure (a)
|
- 0.0
|
- 0.0
|
- -0.4
|
- -0.8
|
- Total
|
- 2.2
|
- 2.3
|
- 1.9
|
- 1.6
|
-
|
-
|
-
|
-
|
-
|
- INDUSTRY, SCIENCE AND TOURISM
|
-
|
-
|
-
|
-
|
- Enhanced assistance to the pharmaceutical industry
(c)
|
- 0.1
|
- 0.2
|
- 22.7
|
- 49.0
|
- Extension of application of the Shipbuilding Bounty
|
- 8.0
|
- 21.3
|
- 1.0
|
- 0.0
|
- Monitoring telecommunications industry development
|
- 0.6
|
- 0.7
|
- 0.8
|
- 0.9
|
- Facilitation of small and medium sized enterprises
- Supplier access to major projects
|
- 0.8
|
- 0.6
|
- 0.4
|
- 0.4
|
- Savings in the Department of Industry, Science and
Tourism running costs to fund the 'Facilitation of
small and medium sized enterprises - Supplier access
to major projects'
|
- -0.8
|
- -0.6
|
- -0.4
|
- -0.4
|
- More Time for Business - Government's Small Business
Statement (a)(c)
|
- 4.7
|
- 8.2
|
- 5.1
|
- 4.5
|
- Australian Leather Holdings Ltd Package (c)
|
- 12.5
|
- 12.5
|
- 0.0
|
- 0.0
|
- Funding for Gene Technology Regulation
|
- 1.3
|
- 1.1
|
- 0.0
|
- 0.0
|
- Sydney 2000 Games - Olympics and Paralympics (a)
|
- 3.0
|
- 0.0
|
- 0.0
|
- 0.0
|
- Replacement and upgrade of Customs Marine Fleet
|
- 5.2
|
- 5.0
|
- 7.0
|
- 8.7
|
- Increased running costs associated with measures to
reduce fuel substitution
|
- 1.4
|
- 1.5
|
- 1.6
|
- 1.6
|
- Savings in Office of National Tourism running costs
|
- -0.7
|
- -0.3
|
- -0.1
|
- 0.0
|
- Savings from Cooperative Research Centres Programme
|
- -1.0
|
- -9.2
|
- 0.0
|
- 0.0
|
- Increased efficiency dividend on Industry, Science
and Tourism portfolio running costs
|
- -2.8
|
- -2.9
|
- -2.9
|
- -2.9
|
- Efficiencies in Whole of Government Information Technology
Infrastructure (a)
|
- 0.0
|
- 0.0
|
- -4.7
|
- -11.0
|
- Total
|
- 32.3
|
- 38.1
|
- 30.5
|
- 50.8
|
-
|
-
|
-
|
-
|
-
|
- PARLIAMENT
|
-
|
-
|
-
|
-
|
- Organisation and conduct of the Constitutional Convention
(a)
|
- 0.0
|
- 0.0
|
- 0.0
|
- 0.0
|
- Efficiencies in Whole of Government Information Technology
Infrastructure (a)
|
- 0.0
|
- 0.0
|
- -0.6
|
- -1.4
|
- Total
|
- 0.0
|
- 0.0
|
- -0.6
|
- -1.4
|
-
|
-
|
-
|
-
|
-
|
- PRIMARY INDUSTRIES AND ENERGY
|
-
|
-
|
-
|
-
|
- NSW Sugar Export Industry - Infrastructure support
(c)
|
- 1.0
|
- 0.0
|
- 0.0
|
- 0.0
|
- Reallocation of funds from natural resource management
programmes
|
- -5.0
|
- -5.1
|
- -5.2
|
- -5.3
|
- Quality Food Australia (c)
|
- 0.2
|
- 0.0
|
- 0.0
|
- 0.0
|
- Supermarket to Asia - The Delicatessen
|
- 1.0
|
- 0.0
|
- 0.0
|
- 0.0
|
- Integrated Rural Policy Package
|
- 44.7
|
- 46.3
|
- 52.4
|
- 55.4
|
- Rural Adjustment Scheme
|
- -46.3
|
- -43.7
|
- -50.3
|
- -55.3
|
- Reallocation of funds from the Rural Communities Access
Programme
|
- -2.4
|
- 0.0
|
- 0.0
|
- 0.0
|
- Australian Quarantine and Inspection Service - Implementation
of reports into quarantine and imported fish and fish
products
|
- 15.0
|
- 20.2
|
- 20.3
|
- 20.5
|
- Australian Quarantine and Inspection Service - Implementation
of the Review of Export Meat Inspection (redundancies)
|
- 13.1
|
- 11.1
|
- 12.9
|
- 7.2
|
- South East Fisheries Adjustment Package
|
- 1.5
|
- 0.0
|
- 0.0
|
- 0.0
|
- Fisheries Research and Development Corporation
|
- -3.6
|
- 0.0
|
- 0.0
|
- 0.0
|
- Fisheries Resources Research Fund
|
- -0.2
|
- -0.2
|
- -0.2
|
- -0.2
|
- National Electricity Market reform and corporatisation
of the Snowy Mountains Hydro-electric Authority
|
- 2.5
|
- 0.5
|
- 0.0
|
- 0.0
|
- Rationalisation of the National Energy Efficiency Programme
|
- -2.8
|
- -2.8
|
- -2.7
|
- -2.7
|
- The Energy Research and Development Corporation
|
- -2.6
|
- -9.0
|
- -11.3
|
- -13.8
|
- Savings in Primary Industries and Energy portfolio
running costs
|
- -1.0
|
- 0.0
|
- 0.0
|
- 0.0
|
- Efficiencies in Whole of Government Information Technology
Infrastructure (a)
|
- 0.0
|
- 0.0
|
- -0.9
|
- -1.2
|
- Natural Heritage Trust of Australia Reserve (a)
|
- na
|
- na
|
- na
|
- na
|
- Total
|
- 15.1
|
- 17.3
|
- 15.0
|
- 4.6
|
-
|
-
|
-
|
-
|
-
|
- PRIME MINISTER AND CABINET
|
-
|
-
|
-
|
-
|
- Establishment of the Federation Fund
|
- 0.0
|
- 100.0
|
- 200.0
|
- 300.0
|
- Improved integration of young offenders into mainstream
community and economic life - Pilot projects
|
- 1.0
|
- 0.0
|
- 0.0
|
- 0.0
|
- Operational funding for national women's non-government
organisations
|
- 0.5
|
- 0.5
|
- 0.5
|
- 0.5
|
- Organisation and conduct of the Constitutional Convention
(a)
|
- 3.8
|
- 0.0
|
- 0.0
|
- 0.0
|
- Aboriginal and Torres Strait Islander Affairs Agencies
funding arrangements - Guaranteed funding with an increased
base
|
- 15.0
|
- 15.2
|
- 15.5
|
- 15.8
|
- Efficiencies in Whole of Government Information Technology
Infrastructure (a)
|
- 0.0
|
- 0.0
|
- -1.3
|
- -1.7
|
- Total
|
- 20.3
|
- 115.7
|
- 214.7
|
- 314.6
|
-
|
-
|
-
|
-
|
-
|
- SOCIAL SECURITY
|
-
|
-
|
-
|
-
|
- Maintain the single rate of pension at 25 per cent
of male total average weekly earnings (a)(c)
|
- 57.3
|
- 409.2
|
- 639.6
|
- 942.3
|
- Pay all Department of Social Security payments fortnightly
in arrears
|
- 0.2
|
- 19.7
|
- -100.8
|
- -18.9
|
- Introduce a Bonus Plan for persons deferring retirement
(a)
|
- 2.4
|
- -16.9
|
- -36.8
|
- -36.0
|
- Simplify and amend date of effect rules for income
support payments (a)
|
- 0.2
|
- 5.5
|
- -23.9
|
- -26.8
|
- Revised arrangements for Financial Information Service
and Migrant Liaison Officers
|
- -4.2
|
- -4.3
|
- -4.3
|
- -4.4
|
- Reform of the income and assets test treatment of income
streams by the Department of Social Security and the
Department of Veterans' Affairs (a)
|
- 6.7
|
- -0.9
|
- -6.4
|
- -9.9
|
- Revised arrangements for carers of adults and children
with disabilities (a)
|
- -2.8
|
- -23.2
|
- -28.5
|
- -33.5
|
- Amendments to migrant two-year waiting period for social
security payments (a)(b)(c)
|
- 106.0
|
- 59.5
|
- 40.3
|
- 40.0
|
- Amendments to activity test penalty periods for Newstart
Allowance (b)(c)
|
- 31.9
|
- 30.3
|
- 31.8
|
- 29.0
|
- Apply consistent hardship rules to waiting periods
for Newstart Allowance and related payments
|
- 0.5
|
- 0.1
|
- 9.9
|
- 9.6
|
- Work for the Dole Initiative (a)
|
- 5.3
|
- 0.9
|
- 0.0
|
- 0.0
|
- Consistently treat lump sums for Social Security recipients
as either income over 12 months or as a deemed asset
|
- 1.5
|
- -3.7
|
- -6.2
|
- -6.3
|
- Expansion of temporary activity test exemptions in
special circumstances
|
- -0.9
|
- -1.3
|
- -1.4
|
- -1.4
|
- Increase Australian Taxation Office Employment Declaration
Form matching with Department of Social Security data
|
- -27.9
|
- -27.4
|
- -28.2
|
- -28.9
|
- Apply preclusion periods to high income seasonal or
intermittent workers
|
- 0.8
|
- -5.0
|
- -5.7
|
- -6.0
|
- Comprehensive National Immunisation Strategy (a)(c)
|
- -11.8
|
- -26.6
|
- 9.2
|
- 4.6
|
- Continue funding for the Family Service Centre and
Retirement Service Centre pilots
|
- 1.9
|
- 0.0
|
- 0.0
|
- 0.0
|
- Pay Family Payment above the minimum rate when a child
and/or parent/s go overseas for up to eight weeks
|
- 4.2
|
- 6.8
|
- 7.0
|
- 7.1
|
- Improvements to the Data-matching Programme and increased
review activity
|
- -16.1
|
- -31.6
|
- -39.4
|
- -40.4
|
- Parenting Payment simplification and rationalisation
package
|
- 4.0
|
- -1.0
|
- -1.8
|
- -2.1
|
- Tightening of the hardship provisions for minimum Family
Payment and Maternity Allowance
|
- 0.1
|
- -3.5
|
- -3.6
|
- -3.7
|
- Rental assistance to people living in public housing
- Remove double subsidy (a)
|
- -21.1
|
- -58.0
|
- -59.7
|
- -61.2
|
- Funding arrangements under the Commonwealth State Housing
Agreement
|
- -50.0
|
- -50.0
|
- -50.0
|
- -50.0
|
- Addressing anomalies in entitlements for veterans deployed
overseas (a)
|
- -0.3
|
- -0.7
|
- -1.1
|
- -1.6
|
- Reform of school age care (a)
|
- 1.1
|
- 0.6
|
- 0.4
|
- 0.4
|
- Improve targeting of Children's Services Programme
to work related care (a)
|
- 1.5
|
- 0.9
|
- 0.5
|
- 0.6
|
- Extend the period of the income test for the 'low income'
Health Care Card from four to eight weeks (a)
|
- 0.2
|
- 0.1
|
- 0.0
|
- 0.0
|
- Increased efficiency dividend on Department of Social
Security running costs
|
- -0.8
|
- -0.8
|
- -0.9
|
- -0.9
|
- Efficiencies in Whole of Government Information Technology
Infrastructure (a)
|
- 0.0
|
- -5.9
|
- -25.4
|
- -24.8
|
- Total
|
- 89.9
|
- 272.8
|
- 314.6
|
- 676.8
|
-
|
-
|
-
|
-
|
-
|
- TRANSPORT AND REGIONAL DEVELOPMENT
|
-
|
-
|
-
|
-
|
- Funding of Airport Environment Officers and Airport
Building Controllers at federal airports subject to
sale
|
- 1.4
|
- 1.4
|
- 1.4
|
- 1.4
|
- Federal Airports Corporation - Conversion of grant
to equity injection for the extension of the runway
at Adelaide Airport
|
- -25.0
|
- -3.0
|
- 0.0
|
- 0.0
|
- Funds for Roads of National Importance in WA
|
- 10.0
|
- 10.0
|
- 10.0
|
- 10.0
|
- Rephasing of funding for the National Rail Infrastructure
Authority
|
- -15.3
|
- -27.0
|
- -19.0
|
- -18.2
|
- Continuation of funding for the National Road Transport
Commission
|
- 0.6
|
- 1.2
|
- 1.2
|
- 1.2
|
- Realignment of Tasmanian Freight Equalisation Scheme
assistance rates
|
- -3.0
|
- -3.0
|
- -3.0
|
- -3.0
|
- Efficiencies in Whole of Government Information Technology
Infrastructure (a)
|
- 0.0
|
- 0.0
|
- -0.4
|
- -1.0
|
- Total
|
- -31.3
|
- -20.4
|
- -9.8
|
- -9.6
|
-
|
-
|
-
|
-
|
-
|
- TREASURY
|
-
|
-
|
-
|
-
|
- More Time for Business - Government's Small Business
Statement (a)(c)
|
- 1.8
|
- 0.6
|
- 0.3
|
- 0.3
|
- Savings in Treasury portfolio running costs
|
- -2.7
|
- -2.7
|
- -2.7
|
- -2.8
|
- Additional special revenue assistance to the ACT in
the form of transitional allowances for education and
health (c)
|
- 10.0
|
- 5.0
|
- 0.0
|
- 0.0
|
- Partial deferral of State fiscal contributions from
the ACT and Tasmania (c)
|
- 13.5
|
- -13.5
|
- 0.0
|
- 0.0
|
- Extension of real per capita guarantee on Financial
Assistance Grants to the States and Territories (c)
|
- 0.0
|
- 0.0
|
- 202.1
|
- 207.2
|
- Australian Bureau of Statistics - Savings in statistical
collections
|
- -5.1
|
- -5.2
|
- -5.3
|
- -5.4
|
- Australian Bureau of Statistics - Increased cost recovery
on the sale of products and services
|
- -2.0
|
- -2.0
|
- -2.1
|
- -2.1
|
- Tax Law Improvement Project - Extension of administrative
funding
|
- 1.1
|
- 1.9
|
- 0.0
|
- 0.0
|
- Australian Taxation Office - Savings through efficiencies
in corporate support
|
- -10.0
|
- -10.2
|
- -10.3
|
- -10.5
|
- Australian Taxation Office - Savings through rationalisation
of income tax withholding arrangements
|
- 0.0
|
- -9.1
|
- -11.4
|
- -11.6
|
- Australian Taxation Office - Savings through phasing
out the Superannuation Holding Accounts Reserve
|
- -10.0
|
- -4.1
|
- -5.2
|
- -5.3
|
- Australian Taxation Office - Savings through phasing
out the community education campaign on superannuation
|
- -3.4
|
- 0.0
|
- 0.0
|
- 0.0
|
- Australian Taxation Office - Savings through alternative
methods of data capture and other processing efficiencies
|
- -5.0
|
- -5.1
|
- -5.2
|
- -5.3
|
- Australian Taxation Office - Savings through administrative
efficiencies and further rationalisation of activities
|
- 0.0
|
- 0.0
|
- -9.3
|
- -9.5
|
- Australian Taxation Office - Opting out of the Superannuation
Guarantee system
|
- 2.4
|
- 2.1
|
- 1.3
|
- 1.3
|
- Australian Taxation Office - Choice of Superannuation
Fund
|
- 2.0
|
- 4.4
|
- 3.5
|
- 2.4
|
- Taxation rebate for savings
|
- 1.0
|
- -1079.0
|
- -2414.0
|
- -3980.0
|
- Australian Competition and Consumer Commission - New
regulatory arrangements for telecommunications
|
- 3.4
|
- 2.1
|
- 1.9
|
- 1.9
|
- Australian Competition and Consumer Commission - Gas
regulation role
|
- 1.8
|
- 1.5
|
- 1.5
|
- 1.5
|
- Enhancement of National Competition Council responsibilities
|
- 0.8
|
- 0.8
|
- 0.8
|
- 0.8
|
- Efficiencies in Whole of Government Information Technology
Infrastructure (a)
|
- 0.0
|
- -2.2
|
- -21.5
|
- -22.2
|
- Total
|
- -0.4
|
- -1114.7
|
- -2275.6
|
- -3839.3
|
-
|
-
|
-
|
-
|
-
|
- VETERANS' AFFAIRS
|
-
|
-
|
-
|
-
|
- Maintain the single rate of pension at 25 per cent
of male total average weekly earnings (a)(c)
|
- 6.5
|
- 41.0
|
- 59.9
|
- 87.3
|
- Allow maximum lump sum advances to all Department of
Veterans' Affairs pensioners
|
- 0.2
|
- 0.0
|
- 0.0
|
- 0.0
|
- Introduce a Bonus Plan for persons deferring retirement
(a)
|
- 1.4
|
- -3.9
|
- -3.9
|
- -3.5
|
- Reform of the income and assets test treatment of income
streams by the Department of Social Security and the
Department of Veterans' Affairs (a)
|
- 0.9
|
- 0.2
|
- 0.1
|
- 0.1
|
- Rental assistance to people living in public housing
- Remove double subsidy (a)
|
- -0.0
|
- -0.1
|
- -0.1
|
- -0.1
|
- Simplify and amend date of effect rules for income
support payments (a)
|
- 3.2
|
- 5.7
|
- -1.3
|
- -1.6
|
- Indexation of the lump sum equivalent for the Disability
Pension
|
- -0.1
|
- -0.3
|
- -0.4
|
- -0.6
|
- Addressing anomalies in entitlements for veterans deployed
overseas (a)
|
- 2.5
|
- 5.2
|
- 7.4
|
- 8.9
|
- Extend the five year Refurbishment Programme for the
Australian War Graves
|
- 0.4
|
- 0.5
|
- 0.2
|
- 0.0
|
- Security and structural works and management at Papua
New Guinea War Cemeteries
|
- 0.4
|
- 0.7
|
- 0.6
|
- 0.2
|
- Link treatment benefit eligibility to pension rate
(a)
|
- 0.0
|
- 0.2
|
- 0.2
|
- 0.2
|
- Medication management and treatment awareness
|
- -0.8
|
- -6.5
|
- -6.5
|
- -6.5
|
- Improvement in services in rural and remote areas
|
- 0.1
|
- -0.0
|
- -0.1
|
- -0.1
|
- Adjust Medicare benefits for some optometrical consultations
(a)
|
- -0.2
|
- -0.3
|
- -0.3
|
- -0.3
|
- Delisting medicine items for less serious medical conditions
from the Pharmaceutical Benefits Schedule (a)
|
- -0.6
|
- -1.7
|
- -1.8
|
- -2.0
|
- Therapeutic group premiums (a)
|
- -2.8
|
- -9.4
|
- -10.0
|
- -10.7
|
- Introduce panel diagnosis for certain conditions
|
- -0.5
|
- -2.9
|
- -5.0
|
- -7.1
|
- Supplementation in lieu of an entrance fee for the
Australian War Memorial
|
- 0.7
|
- 0.7
|
- 0.7
|
- 0.7
|
- Efficiencies in Whole of Government Information Technology
Infrastructure (a)
|
- 0.0
|
- 0.0
|
- -0.0
|
- -0.0
|
- Total
|
- 11.3
|
- 29.1
|
- 39.7
|
- 64.9
|
-
|
-
|
-
|
-
|
-
|
- CROSS PORTFOLIO
|
-
|
-
|
-
|
-
|
- Efficiencies in Whole of Government Information Technology
Infrastructure (a)
|
- 0.0
|
- -38.1
|
- -89.5
|
- -103.5
|
- Total
|
- 0.0
|
- -38.1
|
- -89.5
|
- -103.5
|
(a) Measure affects more than one portfolio.
(b) Decision arising out of Senate action.
(c) Measures announced between Mid Year Economic and
Fiscal Outlook and the Budget.
- (d) This measure reduces the headline balance by $1.6
million in 1997-98, $4.5 million in 1998-99, $5.6 million
in 1999-2000 and $6.2 million in 2000-01.
STATISTICAL APPENDIX
Introduction
Twelve tables are presented in this appendix covering
outlays transactions of the Commonwealth budget sector.
Statement 7 provides a definition of the Commonwealth
budget sector and defines terminology employed to describe
transactions in these tables, in particular, definitions
of the terms outlays and revenue and explanation of
the function and economic type classifications.
A list of tables in this appendix is provided below:
| Table
I
| Commonwealth Budget Outlays by Function ($m)
|
| Table
II
| Commonwealth Budget Outlays by Function - Annual Percentage
Change
|
| Table
III
| Commonwealth Budget Outlays by Function - Annual Percentage
Change (1989-90 prices)
|
| Table
IV
| Commonwealth Budget Outlays by Function as a Proportion
of Total Budget Outlays (per cent)
|
| Table
V
| Commonwealth Budget Outlays by Function and Subfunction
($m)
|
| Table
VI
| Commonwealth Budget Sector Outlays by Economic Type
($m)
|
| Table
VII
| Commonwealth Budget Sector Outlays by Economic Type
as a Proportion of Total Outlays (per cent)
|
| Table
VIII
| Commonwealth Budget Sector Outlays by Economic Type
- Annual Percentage Change (1989-90 prices)
|
| Table
IX
| Commonwealth Budget Portfolio Outlays by Major Function,
1997-98 ($m)
|
| Table
X
| Commonwealth Budget Portfolio Outlays by Major Economic
Type, 1997-98 ($m)
|
| Table
XI
| Outlays on Approved Capital Works of Commonwealth Departments
and Agencies ($m)
|
| Table
XIIa
| Commonwealth Budget Running Costs ($m) and Portfolio
Estimates of Average Staffing Levels (ASL) of Agencies
Operating on the Commonwealth Public Account
|
| Table
XIIb
| Commonwealth Budget Running Costs ($m)
|
-
Table I
| Table I - Commonwealth Budget Outlays by Function ($m)
|
|
|
|
|
|
|
|
|
|
|
|
|
|
|
|
|
|
|
|
|
|
|
|
|
|
|
|
|
|
|
|
|
|
|
|
|
|
| 1987-88
| 88-89
| 89-90
| 90-91
| 91-92
| 92-93
| 93-94
| 94-95
| 95-96
| 96-97
| 97-98
| 98-99
| 99-00
| 00-01
|
|
|
|
|
|
|
|
|
|
|
|
|
|
|
|
|
|
|
| 1.
| Total General Public Services
|
| 5180
| 5486
| 5398
| 6202
| 6698
| 6403
| 6798
| 6794
| 6792
| 7089
| 7030
| 6874
| 7117
| 7136
|
|
| A.
| Legislative and Executive Affairs
| 629
| 470
| 451
| 426
| 459
| 514
| 471
| 487
| 594
| 492
| 549
| 577
| 504
| 494
|
|
| B.
| Financial and Fiscal Affairs
| 1102
| 1166
| 1313
| 1550
| 1737
| 1557
| 1688
| 1503
| 1696
| 1829
| 1779
| 1656
| 1624
| 1608
|
|
| C.
| Foreign Economic Aid
| 1389
| 1555
| 1590
| 1711
| 1861
| 1963
| 2026
| 2153
| 2268
| 1982
| 1935
| 2044
| 2068
| 2101
|
|
| D.
| General Research
| 544
| 554
| 634
| 738
| 855
| 963
| 1010
| 1037
| 1070
| 1149
| 1227
| 1246
| 1210
| 1162
|
|
| E.
| General Services
| 412
| 518
| 126
| 299
| 222
| 181
| 184
| 178
| 221
| 95
| -150
| -92
| 139
| 213
|
|
| F.
| Government Superannuation Benefits
| 1103
| 1222
| 1284
| 1478
| 1564
| 1225
| 1418
| 1437
| 944
| 1541
| 1689
| 1444
| 1572
| 1558
|
| 2.
| Defence
|
| 6967
| 7295
| 7913
| 8480
| 8731
| 9703
| 9746
| 9731
| 10011
| 10003
| 10405
| 10637
| 10849
| 11022
|
| 3.
| Public Order and Safety
|
| 645
| 693
| 803
| 768
| 945
| 914
| 829
| 868
| 924
| 1277
| 1139
| 881
| 881
| 897
|
| 4.
| Education
|
| 5683
| 6021
| 6576
| 7475
| 8373
| 9147
| 9769
| 10152
| 10662
| 11067
| 10980
| 11047
| 11140
| 11205
|
| 5.
| Health
|
| 10050
| 10762
| 11901
| 12935
| 13830
| 14811
| 16092
| 17126
| 18616
| 19294
| 20700
| 21422
| 22449
| 23617
|
| 6.
| Social Security and Welfare
|
| 22751
| 23997
| 26395
| 30656
| 35504
| 38627
| 42026
| 43606
| 46754
| 49953
| 50938
| 51496
| 53019
| 54206
|
| 7.
| Housing and Community Amenities
|
| 1352
| 1214
| 1293
| 1083
| 1154
| 1394
| 1135
| 1135
| 1216
| 863
| 1147
| 1111
| 1063
| 1018
|
| 8.
| Recreation and Culture
|
| 1041
| 1046
| 1062
| 1197
| 1253
| 1267
| 1122
| 1270
| 1428
| 1394
| 1319
| 1328
| 1321
| 1255
|
| 9.
| Fuel and Energy
|
| 108
| 128
| 46
| 72
| 117
| 53
| -22
| 42
| 37
| 13
| 13
| -903
| 11
| 8
|
| 10.
| Agriculture, Forestry and Fishing
|
| 1590
| 1525
| 1673
| 2413
| 1934
| 1704
| 1642
| 1864
| 1876
| 1850
| 1949
| 1953
| 1916
| 1767
|
| 11.
| Mining and Mineral Resources, other than
|
|
|
|
|
|
|
|
|
|
|
|
|
|
|
|
|
| Fuels; Manufacturing; and Construction
|
| 1001
| 1040
| 1218
| 1442
| 1540
| 1376
| 1510
| 1676
| 1651
| 1681
| 1727
| 1642
| 1532
| 1443
|
| 12.
| Transport and Communication
|
| 1722
| 1719
| 1663
| 1785
| 1512
| 2404
| 1068
| 1232
| 743
| -1523
| 1485
| 1403
| 1379
| 1346
|
| 13.
| Total Other Economic Affairs
|
| 1382
| 1369
| 1495
| 1768
| 2187
| 3129
| 3188
| 3503
| 4291
| 3469
| 3171
| 2892
| 2839
| 2817
|
|
| A.
| Tourism and Area Promotion
| 47
| 43
| 72
| 66
| 79
| 87
| 99
| 101
| 104
| 97
| 98
| 87
| 87
| 88
|
|
| B.
| Labour and Employment Affairs
| 1216
| 1205
| 1276
| 1439
| 1834
| 2747
| 2780
| 3104
| 3850
| 3052
| 2755
| 2512
| 2467
| 2445
|
|
| C.
| Other Economic Affairs, nec
| 119
| 122
| 147
| 262
| 274
| 295
| 310
| 298
| 336
| 321
| 317
| 293
| 284
| 284
|
| 14.
| Total Other Purposes
|
| 19997
| 20568
| 20466
| 19868
| 19045
| 18658
| 19468
| 23015
| 21689
| 22431
| 14926
| 23817
| 29038
| 30079
|
|
| A.
| Public Debt Interest
| 7857
| 7397
| 7276
| 6063
| 5626
| 5288
| 6465
| 7994
| 9126
| 9321
| 8920
| 8987
| 8097
| 7306
|
|
| B.
| General Purpose Inter-
|
|
|
|
|
|
|
|
|
|
|
|
|
|
|
|
|
| Government Transactions
| 13211
| 13670
| 14254
| 13828
| 13088
| 14174
| 15427
| 15068
| 13798
| 17440
| 17053
| 18619
| 18848
| 19703
|
|
| C.
| Natural Disaster Relief
| -15
| 30
| 1
| 139
| 28
| -14
| 22
| 6
| -4
| 26
| 31
| 32
| 32
| 32
|
|
| D.
| Contingency Reserve
| -
| -
| -
| -
| -
| -
| -
| -
| -
| -155
| -1247
| 1189
| 2071
| 3037
|
|
| E.
| Asset Sales
| -1056
| -528
| -1065
| -161
| 302
| -790
| -2446
| -52
| -1230
| -4200
| -9830
| -5010
| -10
| -
|
| TOTAL OUTLAYS
|
|
| 79467
| 82860
| 87903
| 96143
| 102822
| 109590
| 114372
| 122012
| 126689
| 128861
| 126928
| 135599
| 144553
| 147815
|
|
|
|
|
|
|
|
|
|
|
|
|
|
|
|
|
|
|
-
Table II
| Table II - Commonwealth Budget Outlays by Function
- Annual Percentage Change
|
|
|
|
|
|
|
|
|
|
|
|
|
|
|
|
|
|
|
|
|
|
|
|
|
|
|
|
|
|
|
|
|
|
|
|
|
|
| 1987-88
| 88-89
| 89-90
| 90-91
| 91-92
| 92-93
| 93-94
| 94-95
| 95-96
| 96-97
| 97-98
| 98-99
| 99-00
| 00-01
|
|
|
|
|
|
|
|
|
|
|
|
|
|
|
|
|
|
|
| 1.
| Total General Public Services
|
| 6.4
| 5.9
| -1.6
| 14.9
| 8.0
| -4.4
| 6.2
| -0.1
| 0.0
| 4.4
| -0.8
| -2.2
| 3.5
| 0.3
|
|
| A.
| Legislative and Executive Affairs
| 16.4
| -25.4
| -4.1
| -5.4
| 7.8
| 11.9
| -8.4
| 3.3
| 22.1
| -17.1
| 11.4
| 5.1
| -12.5
| -2.0
|
|
| B.
| Financial and Fiscal Affairs
| -5.3
| 5.9
| 12.6
| 18.0
| 12.1
| -10.4
| 8.4
| -10.9
| 12.8
| 7.9
| -2.7
| -6.9
| -1.9
| -1.0
|
|
| C.
| Foreign Economic Aid
| 4.5
| 12.0
| 2.3
| 7.6
| 8.8
| 5.5
| 3.2
| 6.2
| 5.4
| -12.6
| -2.3
| 5.6
| 1.2
| 1.6
|
|
| D.
| General Research
| 0.7
| 1.9
| 14.4
| 16.4
| 15.8
| 12.6
| 5.0
| 2.7
| 3.2
| 7.4
| 6.8
| 1.5
| -2.9
| -4.0
|
|
| E.
| General Services
| 1.6
| 25.6
| -75.6
| 136.4
| -25.8
| -18.2
| 1.6
| -3.3
| 24.0
| -56.8
| na
| -38.4
| na
| 53.7
|
|
| F.
| Government Superannuation Benefits
| 24.3
| 10.8
| 5.0
| 15.1
| 5.8
| -21.7
| 15.8
| 1.3
| -34.3
| 63.3
| 9.6
| -14.5
| 8.9
| -0.9
|
| 2.
| Defence
|
| 2.1
| 4.7
| 8.5
| 7.2
| 3.0
| 11.1
| 0.4
| -0.2
| 2.9
| -0.1
| 4.0
| 2.2
| 2.0
| 1.6
|
| 3.
| Public Order and Safety
|
| 8.5
| 7.4
| 16.0
| -4.4
| 23.1
| -3.2
| -9.3
| 4.7
| 6.5
| 38.1
| -10.8
| -22.7
| 0.0
| 1.8
|
| 4.
| Education
|
| 9.3
| 6.0
| 9.2
| 13.7
| 12.0
| 9.2
| 6.8
| 3.9
| 5.0
| 3.8
| -0.8
| 0.6
| 0.8
| 0.6
|
| 5.
| Health
|
| 10.1
| 7.1
| 10.6
| 8.7
| 6.9
| 7.1
| 8.7
| 6.4
| 8.7
| 3.6
| 7.3
| 3.5
| 4.8
| 5.2
|
| 6.
| Social Security and Welfare
|
| 9.6
| 5.5
| 10.0
| 16.1
| 15.8
| 8.8
| 8.8
| 3.8
| 7.2
| 6.8
| 2.0
| 1.1
| 3.0
| 2.2
|
| 7.
| Housing and Community Amenities
|
| -17.4
| -10.2
| 6.5
| -16.2
| 6.6
| 20.8
| -18.6
| 0.0
| 7.2
| -29.0
| 32.9
| -3.2
| -4.4
| -4.2
|
| 8.
| Recreation and Culture
|
| 9.0
| 0.5
| 1.6
| 12.6
| 4.7
| 1.2
| -11.5
| 13.2
| 12.4
| -2.4
| -5.4
| 0.7
| -0.5
| -5.0
|
| 9.
| Fuel and Energy
|
| -20.0
| 18.6
| -64.2
| 57.2
| 62.0
| -54.7
| -141.4
| na
| -11.5
| -64.9
| -3.2
| na
| -101.2
| -23.8
|
| 10.
| Agriculture, Forestry and Fishing
|
| 15.1
| -4.1
| 9.7
| 44.2
| -19.8
| -11.9
| -3.7
| 13.6
| 0.6
| -1.4
| 5.3
| 0.2
| -1.9
| -7.8
|
| 11.
| Mining and Mineral Resources, other than
|
|
|
|
|
|
|
|
|
|
|
|
|
|
|
|
|
| Fuels; Manufacturing; and Construction
|
| 24.7
| 3.8
| 17.2
| 18.4
| 6.8
| -10.6
| 9.7
| 11.0
| -1.5
| 1.8
| 2.7
| -4.9
| -6.7
| -5.8
|
| 12.
| Transport and Communication
|
| -0.3
| -0.2
| -3.2
| 7.3
| -15.3
| 59.0
| -55.6
| 15.3
| -39.7
| na
| -197.5
| -5.5
| -1.7
| -2.4
|
| 13.
| Total Other Economic Affairs
|
| 2.6
| -0.9
| 9.2
| 18.2
| 23.7
| 43.1
| 1.9
| 9.9
| 22.5
| -19.1
| -8.6
| -8.8
| -1.8
| -0.8
|
|
| A.
| Tourism and Area Promotion
| 22.9
| -9.2
| 68.6
| -8.0
| 18.8
| 9.9
| 14.2
| 1.8
| 3.7
| -7.4
| 1.8
| -11.6
| -0.4
| 1.8
|
|
| B.
| Labour and Employment Affairs
| 2.5
| -0.9
| 5.9
| 12.8
| 27.5
| 49.8
| 1.2
| 11.7
| 24.0
| -20.7
| -9.7
| -8.8
| -1.8
| -0.9
|
|
| C.
| Other Economic Affairs, nec
| -2.4
| 2.1
| 21.0
| 78.0
| 4.3
| 7.7
| 5.1
| -3.8
| 12.7
| -4.5
| -1.1
| -7.6
| -2.9
| -0.2
|
| 14.
| Total Other Purposes
|
| -3.9
| 2.9
| -0.5
| -2.9
| -4.1
| -2.0
| 4.3
| 18.2
| -5.8
| 3.4
| -33.5
| 59.6
| 21.9
| 3.6
|
|
| A.
| Public Debt Interest
| -0.1
| -5.9
| -1.6
| -16.7
| -7.2
| -6.0
| 22.3
| 23.6
| 14.2
| 2.1
| -4.3
| 0.7
| -9.9
| -9.8
|
|
| B.
| General Purpose Inter-
|
|
|
|
|
|
|
|
|
|
|
|
|
|
|
|
|
| Government Transactions
| 2.1
| 3.5
| 4.3
| -3.0
| -5.3
| 8.3
| 8.8
| -2.3
| -8.4
| 26.4
| -2.2
| 9.2
| 1.2
| 4.5
|
|
| C.
| Natural Disaster Relief
| na
| na
| -97.8
| na
| -79.8
| -148.6
| na
| -74.9
| -177.6
| na
| 19.5
| 4.6
| 0.0
| 0.0
|
|
| D.
| Contingency Reserve
| na
| na
| na
| na
| na
| na
| na
| na
| na
| na
| na
| -195.3
| 74.2
| 46.6
|
|
| E.
| Asset Sales
| na
| -50.0
| 101.6
| -84.8
| na
| na
| 209.6
| -97.9
| na
| 241.3
| 134.0
| -49.0
| -99.8
| -100.0
|
| TOTAL OUTLAYS
|
|
| 4.4
| 4.3
| 6.1
| 9.4
| 6.9
| 6.6
| 4.4
| 6.7
| 3.8
| 1.7
| -1.5
| 6.8
| 6.6
| 2.3
|
|
|
|
|
|
|
|
|
|
|
|
|
|
|
|
|
|
|
-
Table III
|
| Table III - Commonwealth Budget Outlays by Function
- Annual Percentage Change (1989-90 Prices) (a)
|
|
|
|
|
|
|
|
|
|
|
|
|
|
|
|
|
|
|
|
|
|
|
|
|
|
|
|
|
|
|
|
|
|
|
|
|
|
|
|
| 1987-88
| 88-89
| 89-90
| 90-91
| 91-92
| 92-93
| 93-94
| 94-95
| 95-96
| 96-97
| 97-98
| 98-99
| 99-00
| 00-01
|
|
| OUTLAYS
|
|
|
|
|
|
|
|
|
|
|
|
|
|
|
|
|
|
| 1.
| Total General Public Services
|
| -0.5
| -2.2
| -7.6
| 10.1
| 6.1
| -5.6
| 5.0
| -1.3
| -2.8
| 2.0
| -2.8
| -4.6
| 1.0
| -2.2
|
|
|
| A.
| Legislative and Executive Affairs
| 8.8
| -31.1
| -9.9
| -9.3
| 5.8
| 10.6
| -9.5
| 2.0
| 18.7
| -18.9
| 9.2
| 2.5
| -14.6
| -4.4
|
|
|
| B.
| Financial and Fiscal Affairs
| -11.4
| -2.3
| 5.7
| 13.2
| 10.1
| -11.5
| 7.2
| -12.1
| 9.7
| 5.4
| -4.7
| -9.2
| -4.3
| -3.4
|
|
|
| C.
| Foreign Economic Aid
| -2.3
| 3.4
| -4.0
| 3.1
| 6.8
| 4.2
| 2.1
| 4.9
| 2.5
| -14.6
| -4.3
| 3.1
| -1.3
| -0.9
|
|
|
| D.
| General Research
| -5.8
| -5.9
| 7.4
| 11.6
| 13.8
| 11.3
| 3.8
| 1.4
| 0.3
| 5.0
| 4.6
| -0.9
| -5.2
| -6.3
|
|
|
| E.
| General Services
| -5.0
| 15.9
| -77.1
| 126.6
| -27.2
| -19.2
| 0.4
| -4.6
| 20.6
| -57.8
| na
| -39.9
| -247.0
| 50.0
|
|
|
| F.
| Government Superannuation Benefits
| 16.3
| 2.3
| -1.4
| 10.4
| 3.9
| -22.6
| 14.5
| 0.0
| -36.1
| 59.6
| 7.4
| -16.6
| 6.3
| -3.3
|
|
| 2.
| Defence
|
| -4.5
| -3.3
| 1.9
| 2.7
| 1.1
| 9.8
| -0.7
| -1.4
| 0.1
| -2.3
| 1.9
| -0.2
| -0.5
| -0.9
|
|
| 3.
| Public Order and Safety
|
| 1.5
| -0.8
| 8.9
| -8.4
| 20.9
| -4.4
| -10.3
| 3.3
| 3.6
| 35.0
| -12.6
| -24.5
| -2.4
| -0.7
|
|
| 4.
| Education
|
| 2.2
| -2.2
| 2.6
| 9.0
| 10.0
| 7.9
| 5.6
| 2.6
| 2.2
| 1.5
| -2.8
| -1.8
| -1.6
| -1.9
|
|
| 5.
| Health
|
| 3.0
| -1.1
| 3.8
| 4.2
| 5.0
| 5.8
| 7.5
| 5.1
| 5.7
| 1.3
| 5.1
| 1.0
| 2.3
| 2.6
|
|
| 6.
| Social Security and Welfare
|
| 2.6
| -2.6
| 3.3
| 11.4
| 13.7
| 7.5
| 7.6
| 2.4
| 4.3
| 4.4
| -0.1
| -1.3
| 0.5
| -0.3
|
|
| 7.
| Housing and Community Amenities
|
| -22.7
| -17.1
| 0.0
| -19.7
| 4.7
| 19.3
| -19.5
| -1.3
| 4.2
| -30.6
| 30.2
| -5.5
| -6.7
| -6.6
|
|
| 8.
| Recreation and Culture
|
| 2.0
| -7.2
| -4.6
| 8.0
| 2.8
| 0.0
| -12.4
| 11.8
| 9.3
| -4.5
| -7.3
| -1.7
| -2.9
| -7.3
|
|
| 9.
| Fuel and Energy
|
| -25.2
| 9.5
| -66.4
| 50.7
| 59.1
| -55.2
| -140.9
| na
| -13.9
| -65.7
| -5.2
| na
| -101.2
| -25.7
|
|
| 10.
| Agriculture, Forestry and Fishing
|
| 7.7
| -11.4
| 3.0
| 38.3
| -21.3
| -13.0
| -4.7
| 12.1
| -2.1
| -3.6
| 3.2
| -2.2
| -4.3
| -10.0
|
|
| 11.
| Mining and Mineral Resources, other than
|
|
|
|
|
|
|
|
|
|
|
|
|
|
|
|
|
|
| Fuels; Manufacturing; and Construction
|
| 16.6
| -4.2
| 10.0
| 13.5
| 4.9
| -11.7
| 8.5
| 9.6
| -4.2
| -0.5
| 0.6
| -7.2
| -9.0
| -8.1
|
|
| 12.
| Transport and Communication
|
| -6.7
| -7.9
| -9.1
| 2.9
| -16.8
| 57.1
| -56.1
| 13.9
| -41.3
| na
| -195.5
| -7.8
| -4.1
| -4.8
|
|
| 13.
| Total Other Economic Affairs
|
| -4.0
| -8.5
| 2.5
| 13.4
| 21.5
| 41.3
| 0.8
| 8.5
| 19.1
| -21.0
| -10.5
| -11.0
| -4.2
| -3.2
|
|
|
| A.
| Tourism and Area Promotion
| 14.9
| -16.1
| 58.3
| -11.8
| 16.6
| 8.6
| 12.9
| 0.5
| 0.9
| -9.4
| -0.3
| -13.7
| -2.8
| -0.7
|
|
|
| B.
| Labour and Employment Affairs
| -4.2
| -8.5
| -0.6
| 8.2
| 25.2
| 48.0
| 0.1
| 10.2
| 20.7
| -22.5
| -11.5
| -11.0
| -4.1
| -3.3
|
|
|
| C.
| Other Economic Affairs, nec
| -8.7
| -5.7
| 13.6
| 70.6
| 2.5
| 6.4
| 3.9
| -5.0
| 9.6
| -6.7
| -3.2
| -9.8
| -5.2
| -2.6
|
|
| 14.
| Total Other Purposes
|
| -10.1
| -5.0
| -6.6
| -6.9
| -5.9
| -3.2
| 3.2
| 16.7
| -8.3
| 1.1
| -34.8
| 55.6
| 19.1
| 1.1
|
|
|
| A.
| Public Debt Interest
| -6.6
| -13.1
| -7.6
| -20.1
| -8.9
| -7.2
| 20.9
| 22.1
| 11.0
| -0.2
| -6.2
| -1.7
| -12.1
| -12.0
|
|
|
| B.
| General Purpose Inter-
|
|
|
|
|
|
|
|
|
|
|
|
|
|
|
|
|
|
| Government Transactions
| -4.5
| -4.5
| -2.1
| -7.0
| -7.0
| 7.0
| 7.6
| -3.6
| -10.9
| 23.6
| -4.2
| 6.6
| -1.2
| 2.0
|
|
|
| C.
| Natural Disaster Relief
| na
| na
| -97.9
| na
| -80.1
| -148.1
| na
| -75.3
| -175.5
| na
| 17.1
| 2.1
| -2.4
| -2.4
|
|
|
| D.
| Contingency Reserve
| na
| na
| na
| na
| na
| na
| na
| na
| na
| na
| na
| -192.9
| 70.2
| 43.1
|
|
|
| E.
| Asset Sales
| na
| -53.8
| 89.3
| -85.5
| na
| na
| 206.2
| -97.9
| na
| 233.7
| 129.3
| -50.3
| -99.8
| -100.0
|
|
| TOTAL OUTLAYS
|
|
| -2.4
| -3.7
| -0.4
| 4.9
| 5.0
| 5.3
| 3.2
| 5.3
| 1.0
| -0.6
| -3.4
| 4.2
| 4.1
| -0.2
|
|
| (a)
| The Non-farm GDP (NFGDP) deflator is used as a general
measure of price change.
|
|
|
|
|
|
|
|
|
|
|
|
|
|
|
|
|
|
|
|
|
|
|
|
|
|
|
|
|
|
|
|
|
|
|
-
Table IV
| Table IV - Commonwealth Budget Outlays by Function
As a Proportion of Total Budget Outlays (per cent)
|
|
|
|
|
|
|
|
|
|
|
|
|
|
|
|
|
|
|
|
|
|
|
|
|
|
|
|
|
|
|
|
|
|
|
|
|
|
| 1987-88
| 88-89
| 89-90
| 90-91
| 91-92
| 92-93
| 93-94
| 94-95
| 95-96
| 96-97
| 97-98
| 98-99
| 99-00
| 00-01
|
|
|
|
|
|
|
|
|
|
|
|
|
|
|
|
|
|
|
| 1.
| Total General Public Services
|
| 6.5
| 6.6
| 6.1
| 6.5
| 6.5
| 5.8
| 5.9
| 5.6
| 5.4
| 5.5
| 5.5
| 5.1
| 4.9
| 4.8
|
|
| A.
| Legislative and Executive Affairs
| 0.8
| 0.6
| 0.5
| 0.4
| 0.4
| 0.5
| 0.4
| 0.4
| 0.5
| 0.4
| 0.4
| 0.4
| 0.3
| 0.3
|
|
| B.
| Financial and Fiscal Affairs
| 1.4
| 1.4
| 1.5
| 1.6
| 1.7
| 1.4
| 1.5
| 1.2
| 1.3
| 1.4
| 1.4
| 1.2
| 1.1
| 1.1
|
|
| C.
| Foreign Economic Aid
| 1.7
| 1.9
| 1.8
| 1.8
| 1.8
| 1.8
| 1.8
| 1.8
| 1.8
| 1.5
| 1.5
| 1.5
| 1.4
| 1.4
|
|
| D.
| General Research
| 0.7
| 0.7
| 0.7
| 0.8
| 0.8
| 0.9
| 0.9
| 0.9
| 0.8
| 0.9
| 1.0
| 0.9
| 0.8
| 0.8
|
|
| E.
| General Services
| 0.5
| 0.6
| 0.1
| 0.3
| 0.2
| 0.2
| 0.2
| 0.1
| 0.2
| 0.1
| -0.1
| -0.1
| 0.1
| 0.1
|
|
| F.
| Government Superannuation Benefits
| 1.4
| 1.5
| 1.5
| 1.5
| 1.5
| 1.1
| 1.2
| 1.2
| 0.7
| 1.2
| 1.3
| 1.1
| 1.1
| 1.1
|
| 2.
| Defence
|
| 8.8
| 8.8
| 9.0
| 8.8
| 8.5
| 8.9
| 8.5
| 8.0
| 7.9
| 7.8
| 8.2
| 7.8
| 7.5
| 7.5
|
| 3.
| Public Order and Safety
|
| 0.8
| 0.8
| 0.9
| 0.8
| 0.9
| 0.8
| 0.7
| 0.7
| 0.7
| 1.0
| 0.9
| 0.6
| 0.6
| 0.6
|
| 4.
| Education
|
| 7.2
| 7.3
| 7.5
| 7.8
| 8.1
| 8.3
| 8.5
| 8.3
| 8.4
| 8.6
| 8.7
| 8.1
| 7.7
| 7.6
|
| 5.
| Health
|
| 12.6
| 13.0
| 13.5
| 13.5
| 13.5
| 13.5
| 14.1
| 14.0
| 14.7
| 15.0
| 16.3
| 15.8
| 15.5
| 16.0
|
| 6.
| Social Security and Welfare
|
| 28.6
| 29.0
| 30.0
| 31.9
| 34.5
| 35.2
| 36.7
| 35.7
| 36.9
| 38.8
| 40.1
| 38.0
| 36.7
| 36.7
|
| 7.
| Housing and Community Amenities
|
| 1.7
| 1.5
| 1.5
| 1.1
| 1.1
| 1.3
| 1.0
| 0.9
| 1.0
| 0.7
| 0.9
| 0.8
| 0.7
| 0.7
|
| 8.
| Recreation and Culture
|
| 1.3
| 1.3
| 1.2
| 1.2
| 1.2
| 1.2
| 1.0
| 1.0
| 1.1
| 1.1
| 1.0
| 1.0
| 0.9
| 0.8
|
| 9.
| Fuel and Energy
|
| 0.1
| 0.2
| 0.1
| 0.1
| 0.1
| 0.0
| 0.0
| 0.0
| 0.0
| 0.0
| 0.0
| -0.7
| 0.0
| 0.0
|
| 10.
| Agriculture, Forestry and Fishing
|
| 2.0
| 1.8
| 1.9
| 2.5
| 1.9
| 1.6
| 1.4
| 1.5
| 1.5
| 1.4
| 1.5
| 1.4
| 1.3
| 1.2
|
| 11.
| Mining and Mineral Resources, other than
|
|
|
|
|
|
|
|
|
|
|
|
|
|
|
|
|
| Fuels; Manufacturing; and Construction
|
| 1.3
| 1.3
| 1.4
| 1.5
| 1.5
| 1.3
| 1.3
| 1.4
| 1.3
| 1.3
| 1.4
| 1.2
| 1.1
| 1.0
|
| 12.
| Transport and Communication
|
| 2.2
| 2.1
| 1.9
| 1.9
| 1.5
| 2.2
| 0.9
| 1.0
| 0.6
| -1.2
| 1.2
| 1.0
| 1.0
| 0.9
|
| 13.
| Total Other Economic Affairs
|
| 1.7
| 1.7
| 1.7
| 1.8
| 2.1
| 2.9
| 2.8
| 2.9
| 3.4
| 2.7
| 2.5
| 2.1
| 2.0
| 1.9
|
|
| A.
| Tourism and Area Promotion
| 0.1
| 0.1
| 0.1
| 0.1
| 0.1
| 0.1
| 0.1
| 0.1
| 0.1
| 0.1
| 0.1
| 0.1
| 0.1
| 0.1
|
|
| B.
| Labour and Employment Affairs
| 1.5
| 1.5
| 1.5
| 1.5
| 1.8
| 2.5
| 2.4
| 2.5
| 3.0
| 2.4
| 2.2
| 1.9
| 1.7
| 1.7
|
|
| C.
| Other Economic Affairs, nec
| 0.2
| 0.1
| 0.2
| 0.3
| 0.3
| 0.3
| 0.3
| 0.2
| 0.3
| 0.2
| 0.2
| 0.2
| 0.2
| 0.2
|
| 14.
| Total Other Purposes
|
| 25.2
| 24.8
| 23.3
| 20.7
| 18.5
| 17.0
| 17.0
| 18.9
| 17.1
| 17.4
| 11.8
| 17.6
| 20.1
| 20.3
|
|
| A.
| Public Debt Interest
| 9.9
| 8.9
| 8.3
| 6.3
| 5.5
| 4.8
| 5.7
| 6.6
| 7.2
| 7.2
| 7.0
| 6.6
| 5.6
| 4.9
|
|
| B.
| General Purpose Inter-
|
|
|
|
|
|
|
|
|
|
|
|
|
|
|
|
|
| Government Transactions
| 16.6
| 16.5
| 16.2
| 14.4
| 12.7
| 12.9
| 13.5
| 12.3
| 10.9
| 13.5
| 13.4
| 13.7
| 13.0
| 13.3
|
|
| C.
| Natural Disaster Relief
| 0.0
| 0.0
| 0.0
| 0.1
| 0.0
| 0.0
| 0.0
| 0.0
| 0.0
| 0.0
| 0.0
| 0.0
| 0.0
| 0.0
|
|
| D.
| Contingency Reserve
| -
| -
| -
| -
| -
| -
| -
| -
| -
| -0.1
| -1.0
| 0.9
| 1.4
| 2.1
|
|
| E.
| Asset Sales
| -1.3
| -0.6
| -1.2
| -0.2
| 0.3
| -0.7
| -2.1
| 0.0
| -1.0
| -3.3
| -7.7
| -3.7
| 0.0
| -
|
| TOTAL OUTLAYS
|
|
| 100.0
| 100.0
| 100.0
| 100.0
| 100.0
| 100.0
| 100.0
| 100.0
| 100.0
| 100.0
| 100.0
| 100.0
| 100.0
| 100.0
|
|
|
|
|
|
|
|
|
|
|
|
|
|
|
|
|
|
|
-
-
Table V
| Table V - Commonwealth Budget Outlays by Function and
Subfunction ($m)
|
|
|
|
|
|
|
|
|
|
|
|
|
|
|
|
|
|
|
|
|
|
|
|
|
|
|
|
|
|
|
|
|
|
|
|
|
|
| 1987-88
| 88-89
| 89-90
| 90-91
| 91-92
| 92-93
| 93-94
| 94-95
| 95-96
| 96-97
| 97-98
| 98-99
| 99-00
| 00-01
|
| Total General Public Services
|
|
| 5180
| 5486
| 5398
| 6202
| 6698
| 6403
| 6798
| 6794
| 6792
| 7089
| 7030
| 6874
| 7117
| 7136
|
| Legislative and Executive Affairs
|
|
|
|
|
|
|
|
|
|
|
|
|
|
|
|
|
| Parliamentary Outlays
|
|
| 476
| 309
| 266
| 259
| 285
| 292
| 307
| 313
| 345
| 328
| 341
| 338
| 341
| 344
|
| Other Legislative Services
|
|
| 93
| 98
| 112
| 76
| 78
| 126
| 71
| 83
| 160
| 82
| 122
| 163
| 88
| 74
|
| Executive Affairs
|
|
| 61
| 63
| 72
| 91
| 97
| 96
| 93
| 90
| 89
| 83
| 87
| 76
| 76
| 76
|
| Total Legislative and Executive Affairs
|
|
| 629
| 470
| 451
| 426
| 459
| 514
| 471
| 487
| 594
| 492
| 549
| 577
| 504
| 494
|
| Financial and Fiscal Affairs
|
|
|
|
|
|
|
|
|
|
|
|
|
|
|
|
|
| Financial and Statistical Services
|
|
| 1130
| 1251
| 1436
| 1679
| 1847
| 1694
| 1783
| 1793
| 1983
| 2111
| 2081
| 1940
| 1930
| 1974
|
| Taxes Paid by Budget Agencies
|
|
| -28
| -84
| -123
| -129
| -109
| -137
| -95
| -290
| -287
| -282
| -302
| -284
| -305
| -366
|
| Total Financial and Fiscal Affairs
|
|
| 1102
| 1166
| 1313
| 1550
| 1737
| 1557
| 1688
| 1503
| 1696
| 1829
| 1779
| 1656
| 1624
| 1608
|
| Foreign Economic Aid
|
|
|
|
|
|
|
|
|
|
|
|
|
|
|
|
|
| Bilateral Aid
|
|
| 743
| 809
| 902
| 865
| 921
| 976
| 1022
| 1070
| 1192
| 995
| 873
| 958
| 1000
| 1025
|
| Multilateral Aid
|
|
| 212
| 317
| 202
| 339
| 340
| 339
| 300
| 322
| 337
| 348
| 379
| 396
| 392
| 392
|
| Aid Administration
|
|
| 31
| 35
| 41
| 41
| 43
| 47
| 51
| 54
| 69
| 64
| 67
| 65
| 65
| 66
|
| Foreign Affairs-Non Aid
|
|
| 403
| 394
| 445
| 465
| 558
| 601
| 652
| 706
| 670
| 575
| 616
| 626
| 610
| 619
|
| Total Foreign Economic Aid
|
|
| 1389
| 1555
| 1590
| 1711
| 1861
| 1963
| 2026
| 2153
| 2268
| 1982
| 1935
| 2044
| 2068
| 2101
|
| General Research
|
|
|
|
|
|
|
|
|
|
|
|
|
|
|
|
|
| CSIRO
|
|
| 348
| 348
| 376
| 416
| 448
| 458
| 462
| 461
| 417
| 433
| 467
| 481
| 484
| 465
|
| Australian Nuclear Science and
|
|
|
|
|
|
|
|
|
|
|
|
|
|
|
|
|
| Technology Organisation
|
|
| 51
| 54
| 58
| 63
| 64
| 68
| 64
| 66
| 66
| 64
| 70
| 75
| 68
| 68
|
| Australian Research Council
|
|
| 73
| 86
| 126
| 173
| 231
| 267
| 300
| 312
| 351
| 401
| 429
| 445
| 411
| 381
|
| Other General Research, nec
|
|
| 72
| 66
| 75
| 87
| 111
| 169
| 183
| 198
| 237
| 251
| 261
| 245
| 247
| 247
|
| Total General Research
|
|
| 544
| 554
| 634
| 738
| 855
| 963
| 1010
| 1037
| 1070
| 1149
| 1227
| 1246
| 1210
| 1162
|
| General Services
|
|
|
|
|
|
|
|
|
|
|
|
|
|
|
|
|
| Commonwealth Employees' Compensation
|
|
| -
| 102
| -24
| 24
| 62
| 74
| 85
| 63
| 33
| 65
| 77
| 83
| 85
| 89
|
| Estate Management
|
|
| -32
| 16
| 5
| 143
| -24
| -109
| -68
| -101
| -100
| -213
| -559
| -344
| -94
| -26
|
| Common Service Businesses
|
|
| 18
| -76
| 10
| 19
| 55
| 86
| 17
| 55
| 78
| 22
| 43
| 29
| 37
| 38
|
| Other General Services
|
|
| 426
| 475
| 136
| 114
| 128
| 130
| 150
| 161
| 209
| 222
| 289
| 140
| 111
| 112
|
| Total General Services
|
|
| 412
| 518
| 126
| 299
| 222
| 181
| 184
| 178
| 221
| 95
| -150
| -92
| 139
| 213
|
| Government Superannuation Benefits
|
|
|
|
|
|
|
|
|
|
|
|
|
|
|
|
|
| Net Superannaution Payments
|
|
| 1103
| 1222
| 1284
| 1478
| 1564
| 1225
| 1418
| 1437
| 944
| 1541
| 1689
| 1444
| 1572
| 1558
|
|
|
|
|
|
|
|
|
|
|
|
|
|
|
|
|
|
|
| Defence
|
|
|
|
|
|
|
|
|
|
|
|
|
|
|
|
|
| Personnel Costs
|
|
| 2649
| 2806
| 2900
| 3038
| 3191
| 3849
| 3768
| 3681
| 3863
| 4020
| 4114
| 4086
| 4004
| 4045
|
| Defence Equipment and Stores
|
|
| 2614
| 2708
| 2957
| 3354
| 3499
| 3755
| 3730
| 3806
| 3866
| 3945
| 4133
| 4402
| 4571
| 4597
|
| Defence Facilities
|
|
| 295
| 295
| 357
| 324
| 286
| 352
| 492
| 542
| 528
| 485
| 489
| 520
| 529
| 544
|
| Defence Housing
|
|
| 156
| 139
| 192
| 182
| 198
| 233
| 193
| 129
| 106
| 17
| 105
| 150
| 154
| 159
|
| Defence Industry
|
|
| 296
| 336
| 258
| 177
| 150
| 92
| 82
| 62
| 23
| 54
| 23
| 19
| 18
| 18
|
| Defence Science
|
|
| 187
| 210
| 225
| 227
| 232
| 231
| 239
| 229
| 248
| 245
| 215
| 211
| 223
| 227
|
| Defence Other
|
|
| 770
| 801
| 1024
| 1177
| 1175
| 1190
| 1242
| 1281
| 1377
| 1237
| 1325
| 1249
| 1350
| 1432
|
| Total Defence
|
|
| 6967
| 7295
| 7913
| 8480
| 8731
| 9703
| 9746
| 9731
| 10011
| 10003
| 10405
| 10637
| 10849
| 11022
|
| Public Order and Safety
|
|
|
|
|
|
|
|
|
|
|
|
|
|
|
|
|
| Courts and Legal Services
|
|
| 286
| 310
| 344
| 369
| 508
| 481
| 390
| 379
| 421
| 473
| 483
| 435
| 425
| 447
|
| Security and Intelligence Services
|
|
| 74
| 76
| 102
| 99
| 100
| 106
| 104
| 117
| 116
| 119
| 131
| 118
| 120
| 119
|
| Criminal Investigations
|
|
| 185
| 202
| 241
| 186
| 218
| 227
| 228
| 242
| 268
| 242
| 234
| 233
| 241
| 237
|
| Other Public Order and Safety
|
|
| 100
| 104
| 116
| 113
| 119
| 100
| 108
| 129
| 119
| 443
| 291
| 95
| 94
| 94
|
| Total Public Order and Safety
|
|
| 645
| 693
| 803
| 768
| 945
| 914
| 829
| 868
| 924
| 1277
| 1139
| 881
| 881
| 897
|
| Education
|
|
|
|
|
|
|
|
|
|
|
|
|
|
|
|
|
| Higher Education
|
|
| 2452
| 2551
| 2934
| 3327
| 3580
| 3851
| 4160
| 4238
| 4481
| 4580
| 4186
| 3988
| 3890
| 3747
|
| Vocational and Other Education
|
|
| 361
| 330
| 340
| 376
| 421
| 563
| 638
| 748
| 810
| 900
| 920
| 925
| 944
| 967
|
| Schools
|
|
| 1959
| 2142
| 2184
| 2418
| 2689
| 2884
| 3067
| 3246
| 3344
| 3533
| 3691
| 3831
| 3941
| 4065
|
| Student Assistance
|
|
| 820
| 913
| 1018
| 1237
| 1555
| 1683
| 1720
| 1741
| 1902
| 1865
| 1985
| 2086
| 2155
| 2216
|
| General Administration
|
|
| 90
| 85
| 100
| 117
| 128
| 166
| 184
| 180
| 124
| 187
| 198
| 216
| 209
| 210
|
| Total Education
|
|
| 5683
| 6021
| 6576
| 7475
| 8373
| 9147
| 9769
| 10152
| 10662
| 11067
| 10980
| 11047
| 11140
| 11205
|
| Health
|
|
|
|
|
|
|
|
|
|
|
|
|
|
|
|
|
| Medical Services and Benefits
|
|
| 3470
| 3742
| 4285
| 4761
| 5128
| 5604
| 6109
| 6640
| 7107
| 7301
| 7584
| 7905
| 8351
| 8768
|
| Hospital Services
|
|
| 3634
| 3862
| 4071
| 4399
| 4570
| 4795
| 5177
| 5323
| 5492
| 5613
| 6207
| 6402
| 6612
| 6839
|
| Pharmaceutical Services and Benefits
|
|
| 1059
| 1134
| 1298
| 1297
| 1414
| 1623
| 1920
| 2133
| 2564
| 2678
| 3013
| 3176
| 3556
| 3986
|
| Nursing Home Subsidies and Domicile Care
|
|
| 1464
| 1609
| 1796
| 1932
| 2025
| 2068
| 2028
| 2119
| 2324
| 2484
| 2636
| 2757
| 2828
| 2905
|
| Aboriginal and Torres Strait Islander Health
|
|
| -
| -
| -
| -
| -
| -
| -
| -
| 115
| 112
| 127
| 131
| 132
| 126
|
| Other Health Services
|
|
| 239
| 260
| 318
| 409
| 508
| 543
| 667
| 727
| 796
| 899
| 904
| 843
| 796
| 813
|
| General Administration
|
|
| 184
| 156
| 133
| 137
| 185
| 177
| 193
| 184
| 218
| 207
| 228
| 209
| 174
| 179
|
| Total Health
|
|
| 10050
| 10762
| 11901
| 12935
| 13830
| 14811
| 16092
| 17126
| 18616
| 19294
| 20700
| 21422
| 22449
| 23617
|
|
|
|
|
|
|
|
|
|
|
|
|
|
|
|
|
|
|
| Social Security and Welfare
|
|
|
|
|
|
|
|
|
|
|
|
|
|
|
|
|
| Assistance to the Aged
|
|
| 7233
| 7854
| 8621
| 9722
| 10575
| 11306
| 12488
| 12711
| 13333
| 14455
| 14792
| 15588
| 16416
| 17115
|
| Assistance to Veterans and Dependants
|
|
| 3118
| 3182
| 3396
| 3677
| 3785
| 3848
| 3906
| 4019
| 4357
| 4469
| 4372
| 4350
| 4338
| 4293
|
| Assistance to People with Disabilities
|
|
| 2478
| 2736
| 3021
| 3509
| 3967
| 4361
| 4905
| 5140
| 5584
| 5895
| 5798
| 5757
| 6032
| 6150
|
| Assistance to Families with Children
|
|
| 3853
| 4138
| 5004
| 5605
| 6853
| 8020
| 9149
| 10203
| 12519
| 14006
| 14708
| 15077
| 15823
| 16323
|
| Assistance to the Unemployed and Sick
|
|
| 3886
| 3689
| 3679
| 5212
| 7181
| 7862
| 8102
| 7831
| 7016
| 7327
| 7515
| 7224
| 7015
| 6914
|
| Other Welfare Programmes
|
|
| 903
| 979
| 1063
| 1136
| 1190
| 1103
| 1229
| 1257
| 1328
| 1122
| 852
| 778
| 772
| 770
|
| Aboriginal Advancement Programmes nec
|
|
| 386
| 464
| 529
| 603
| 673
| 840
| 916
| 1042
| 1051
| 974
| 1061
| 1114
| 1138
| 1162
|
| General Administration
|
|
| 899
| 966
| 1087
| 1200
| 1300
| 1319
| 1403
| 1456
| 1616
| 1768
| 1919
| 1698
| 1573
| 1569
|
| Recoveries and Repayments
|
|
| -5
| -11
| -6
| -8
| -20
| -31
| -73
| -53
| -50
| -62
| -78
| -89
| -89
| -89
|
| Total Social Security and Welfare
|
|
| 22751
| 23997
| 26395
| 30656
| 35504
| 38627
| 42026
| 43606
| 46754
| 49953
| 50938
| 51496
| 53019
| 54206
|
| Housing and Community Amenities
|
|
|
|
|
|
|
|
|
|
|
|
|
|
|
|
|
| Housing Assistance to Other Governments
|
|
| 1016
| 920
| 895
| 767
| 914
| 890
| 876
| 912
| 905
| 804
| 850
| 836
| 822
| 818
|
| Defence Service Homes
|
|
| 11
| 52
| 179
| 150
| 92
| 53
| 41
| 43
| 52
| 31
| 25
| 25
| 25
| 25
|
| Urban and Regional Development
|
|
| 43
| 5
| 28
| 10
| 16
| 331
| 97
| 39
| 72
| -19
| 35
| 5
| -2
| -5
|
| Environment Protection
|
|
| 39
| 38
| 49
| 56
| 66
| 65
| 75
| 87
| 133
| 145
| 206
| 211
| 188
| 155
|
| Other Housing and Community Amenities
|
|
| 235
| 193
| 120
| 72
| 33
| 22
| 22
| 16
| 20
| -115
| 22
| 28
| 26
| 20
|
| General Administration
|
|
| 7
| 6
| 21
| 29
| 33
| 33
| 25
| 37
| 35
| 17
| 9
| 5
| 4
| 4
|
| Total Housing and Community Amenities
|
|
| 1352
| 1214
| 1293
| 1083
| 1154
| 1394
| 1135
| 1135
| 1216
| 863
| 1147
| 1111
| 1063
| 1018
|
| Recreation and Culture
|
|
|
|
|
|
|
|
|
|
|
|
|
|
|
|
|
| Broadcasting
|
|
| 567
| 605
| 661
| 721
| 728
| 724
| 561
| 628
| 754
| 736
| 654
| 652
| 661
| 669
|
| Arts and Cultural Heritage
|
|
| 381
| 351
| 275
| 322
| 327
| 332
| 338
| 406
| 418
| 460
| 462
| 422
| 402
| 406
|
| Sport and Recreation
|
|
| 44
| 34
| 53
| 71
| 75
| 93
| 96
| 113
| 93
| 96
| 98
| 151
| 155
| 83
|
| National Estate and Parks
|
|
| 49
| 55
| 73
| 83
| 123
| 118
| 127
| 123
| 163
| 102
| 105
| 102
| 102
| 96
|
| Total Recreation and Culture
|
|
| 1041
| 1046
| 1062
| 1197
| 1253
| 1267
| 1122
| 1270
| 1428
| 1394
| 1319
| 1328
| 1321
| 1255
|
| Fuel and Energy
|
|
|
|
|
|
|
|
|
|
|
|
|
|
|
|
|
| Fossil Fuels
|
|
| 58
| 38
| 43
| 20
| 80
| 19
| 7
| 3
| 4
| 3
| 4
| 4
| 4
| 4
|
| Electricity
|
|
| 38
| 78
| -11
| 18
| 8
| -1
| -67
| -3
| -8
| -2
| -4
| -914
| 2
| 2
|
| Energy Research, Conservation & Gen Admin
|
|
| 12
| 12
| 14
| 33
| 29
| 35
| 38
| 43
| 42
| 12
| 14
| 7
| 5
| 3
|
| Total Fuel and Energy
|
|
| 108
| 128
| 46
| 72
| 117
| 53
| -22
| 42
| 37
| 13
| 13
| -903
| 11
| 8
|
|
|
|
|
|
|
|
|
|
|
|
|
|
|
|
|
|
|
| Agriculture, Forestry and Fishing
|
|
|
|
|
|
|
|
|
|
|
|
|
|
|
|
|
| Wool
|
|
| 447
| 489
| 496
| 1148
| 504
| 277
| 242
| 293
| 197
| 123
| 122
| 133
| 149
| 169
|
| Grains
|
|
| 173
| 3
| 76
| 48
| 93
| 83
| 97
| 83
| 142
| 150
| 120
| 116
| 76
| 75
|
| Dairy
|
|
| 166
| 157
| 144
| 142
| 172
| 170
| 188
| 186
| 199
| 194
| 196
| 200
| 203
| 48
|
| Cattle, Sheep and Pig
|
|
| 104
| 144
| 130
| 169
| 181
| 178
| 167
| 152
| 143
| 143
| 143
| 143
| 147
| 147
|
| Fishing, Horticulture and Other Agriculture
|
|
| 76
| 87
| 99
| 115
| 85
| 87
| 91
| 102
| 107
| 116
| 126
| 123
| 124
| 121
|
| Sub Total
|
|
| 965
| 879
| 944
| 1621
| 1036
| 795
| 785
| 816
| 787
| 725
| 706
| 715
| 699
| 560
|
| General Assistance not Allocated
|
|
|
|
|
|
|
|
|
|
|
|
|
|
|
|
|
| to Specific Industries
|
|
| 506
| 517
| 556
| 615
| 733
| 743
| 684
| 870
| 885
| 892
| 899
| 894
| 901
| 900
|
| Natural Resources Development & Management
|
|
| 44
| 50
| 88
| 74
| 60
| 76
| 80
| 88
| 98
| 89
| 216
| 220
| 196
| 187
|
| General Administration
|
|
| 75
| 79
| 85
| 103
| 106
| 90
| 93
| 90
| 105
| 143
| 128
| 125
| 121
| 120
|
| Total Agriculture, Forestry and Fishing
|
|
| 1590
| 1525
| 1673
| 2413
| 1934
| 1704
| 1642
| 1864
| 1876
| 1850
| 1949
| 1953
| 1916
| 1767
|
| Mining and Mineral Resources, Other
|
|
|
|
|
|
|
|
|
|
|
|
|
|
|
|
|
| Than Fuels; Manufacturing; and Construction
|
|
|
|
|
|
|
|
|
|
|
|
|
|
|
|
|
| Mining and Mineral Resources
|
|
| 277
| 347
| 455
| 495
| 543
| 540
| 614
| 770
| 821
| 941
| 900
| 913
| 983
| 1059
|
| Manufacturing
|
|
| 405
| 387
| 461
| 413
| 449
| 459
| 438
| 452
| 431
| 477
| 561
| 470
| 316
| 146
|
| Assistance to Exporters
|
|
| 316
| 299
| 300
| 529
| 542
| 370
| 402
| 424
| 375
| 258
| 264
| 259
| 232
| 238
|
| Other Industry Assistance
|
|
| 3
| 6
| 2
| 6
| 6
| 8
| 55
| 30
| 24
| 4
| 2
| ..
| ..
| -
|
| Total Mining and Mineral Resources, other
|
|
|
|
|
|
|
|
|
|
|
|
|
|
|
|
|
| than Fuels; Manufacturing; and Construction
|
|
| 1001
| 1040
| 1218
| 1442
| 1540
| 1376
| 1510
| 1676
| 1651
| 1681
| 1727
| 1642
| 1532
| 1443
|
| Transport and Communication
|
|
|
|
|
|
|
|
|
|
|
|
|
|
|
|
|
| Communication
|
|
| -66
| 19
| -221
| -263
| -285
| -100
| -215
| -178
| -653
| -3014
| 121
| 119
| 120
| 121
|
| Air Transport
|
|
| -182
| 130
| 242
| 148
| 74
| 116
| -206
| 107
| 193
| 51
| 238
| 180
| 166
| 89
|
| Road Transport
|
|
| 1330
| 1305
| 1359
| 1585
| 1359
| 1815
| 1045
| 851
| 874
| 867
| 867
| 855
| 813
| 832
|
| Rail Transport
|
|
| 49
| 49
| 63
| 106
| 83
| 365
| 230
| 255
| 111
| 364
| 62
| 52
| 84
| 108
|
| Sea Transport
|
|
| 41
| 38
| 64
| 104
| 258
| 143
| 139
| 111
| 127
| 126
| 121
| 119
| 121
| 120
|
| Other Transport and Communication
|
|
| 551
| 178
| 156
| 105
| 23
| 65
| 74
| 85
| 91
| 81
| 76
| 76
| 76
| 76
|
| Total Transport and Communication
|
|
| 1722
| 1719
| 1663
| 1785
| 1512
| 2404
| 1068
| 1232
| 743
| -1523
| 1485
| 1403
| 1379
| 1346
|
| Total Other Economic Affairs
|
|
| 1382
| 1369
| 1495
| 1768
| 2187
| 3129
| 3188
| 3503
| 4291
| 3469
| 3171
| 2892
| 2839
| 2817
|
| Tourism and Area Promotion
|
|
|
|
|
|
|
|
|
|
|
|
|
|
|
|
|
| Tourism
|
|
| 47
| 43
| 72
| 66
| 79
| 87
| 99
| 101
| 104
| 97
| 98
| 87
| 87
| 88
|
|
|
|
|
|
|
|
|
|
|
|
|
|
|
|
|
|
|
| Labour and Employment Affairs
|
|
|
|
|
|
|
|
|
|
|
|
|
|
|
|
|
| Vocational and Industry Training
|
|
| 165
| 197
| 192
| 178
| 200
| 338
| 318
| 336
| 264
| 291
| 276
| 311
| 351
| 307
|
| Labour Market Assist to Jobseekers and Industry
|
|
| 779
| 714
| 754
| 877
| 1208
| 1866
| 1978
| 2228
| 3013
| 2240
| 1936
| 1682
| 1602
| 1613
|
| Industrial Relations
|
|
| 160
| 159
| 171
| 201
| 215
| 302
| 219
| 261
| 239
| 190
| 186
| 184
| 185
| 185
|
| Immigration
|
|
| 112
| 134
| 159
| 183
| 211
| 242
| 265
| 280
| 334
| 331
| 356
| 335
| 329
| 340
|
| Total Labour and Employment Affairs
|
|
| 1216
| 1205
| 1276
| 1439
| 1834
| 2747
| 2780
| 3104
| 3850
| 3052
| 2755
| 2512
| 2467
| 2445
|
| Other Economic Affairs, nec
|
|
|
|
|
|
|
|
|
|
|
|
|
|
|
|
|
| Economic Regulation and Trade
|
|
| 36
| 34
| 53
| 152
| 162
| 179
| 191
| 185
| 199
| 192
| 183
| 157
| 152
| 151
|
| Meteorological Services
|
|
| 84
| 88
| 95
| 110
| 112
| 116
| 119
| 114
| 137
| 129
| 135
| 136
| 132
| 132
|
| Total Other Economic Affairs, nec
|
|
| 119
| 122
| 147
| 262
| 274
| 295
| 310
| 298
| 336
| 321
| 317
| 293
| 284
| 284
|
| Total Other Purposes
|
|
| 19997
| 20568
| 20466
| 19868
| 19045
| 18658
| 19468
| 23015
| 21689
| 22431
| 14926
| 23817
| 29038
| 30079
|
| Public Debt Interest
|
|
|
|
|
|
|
|
|
|
|
|
|
|
|
|
|
| Gross Interest on Behalf of the Commonwealth
|
|
| 5840
| 5360
| 5293
| 4221
| 3934
| 3881
| 5373
| 7002
| 8566
| 8874
| 8537
| 8674
| 7845
| 7191
|
| Gross Interest on Behalf of the States
|
|
| 2108
| 2082
| 2124
| 2032
| 1861
| 1566
| 1242
| 1117
| 676
| 470
| 391
| 320
| 259
| 117
|
| Interest Received on Commonwealth Stock
|
|
| -90
| -45
| -141
| -190
| -168
| -160
| -150
| -125
| -116
| -23
| -8
| -7
| -7
| -2
|
| Total Public Debt Interest
|
|
| 7857
| 7397
| 7276
| 6063
| 5626
| 5288
| 6465
| 7994
| 9126
| 9321
| 8920
| 8987
| 8097
| 7306
|
| General Purpose Inter-Government Transactions
|
|
|
|
|
|
|
|
|
|
|
|
|
|
|
|
|
| General Revenue Assistance to the States
|
|
| 12465
| 12973
| 13278
| 13601
| 13704
| 14087
| 14355
| 15066
| 15777
| 15822
| 16203
| 17067
| 18238
| 18898
|
| General Purpose Capital Assistance to the States
|
|
| -130
| 90
| 54
| -1263
| -2219
| -2038
| -521
| -1660
| -3852
| -748
| -768
| -80
| -1136
| -994
|
| Debt Assistance to the States
|
|
| 52
| 51
| 50
| 54
| 257
| 160
| 113
| 144
| 92
| 233
| 73
| 36
| 91
| 84
|
| Local Government Assistance
|
|
| 642
| 664
| 689
| 711
| 1040
| 1080
| 1084
| 1095
| 1165
| 1216
| 1205
| 1258
| 1304
| 1352
|
| ASC - Revenue Assistance to the States
|
|
| -
| -
| -
| 68
| 116
| 118
| 124
| 122
| 126
| 130
| 134
| 139
| 143
| 147
|
| Assistance to Other Governments, nec
|
|
| 182
| -107
| 182
| 656
| 190
| 766
| 271
| 300
| 490
| 786
| 205
| 199
| 208
| 216
|
| Total General Purpose Inter-
|
|
|
|
|
|
|
|
|
|
|
|
|
|
|
|
|
| Government Transactions
|
|
| 13211
| 13670
| 14254
| 13828
| 13088
| 14174
| 15427
| 15068
| 13798
| 17440
| 17053
| 18619
| 18848
| 19703
|
| Natural Disaster Relief
|
|
|
|
|
|
|
|
|
|
|
|
|
|
|
|
|
| Natural Disaster Relief Assistance
|
|
| -15
| 30
| 1
| 139
| 28
| -14
| 22
| 6
| -4
| 26
| 31
| 32
| 32
| 32
|
| Contingency Reserve
|
|
|
|
|
|
|
|
|
|
|
|
|
|
|
|
|
| Contingency Reserve
|
|
| -
| -
| -
| -
| -
| -
| -
| -
| -
| -155
| -1247
| 1189
| 2071
| 3037
|
| Asset Sales
|
|
|
|
|
|
|
|
|
|
|
|
|
|
|
|
|
| Asset Sales
|
|
| -1056
| -528
| -1065
| -161
| 302
| -790
| -2446
| -52
| -1230
| -4200
| -9830
| -5010
| -10
| -
|
| TOTAL OUTLAYS
|
|
| 79467
| 82860
| 87903
| 96143
| 102822
| 109590
| 114372
| 122012
| 126689
| 128861
| 126928
| 135599
| 144553
| 147815
|
-
-
Table VI
| Table VI - Commonwealth Budget Sector Outlays by Economic
Type ($m)
|
|
|
|
|
|
|
|
|
|
|
|
|
|
|
|
|
|
|
|
|
|
|
|
|
|
|
|
|
|
|
|
|
|
|
|
|
|
|
|
|
| 1987-88
| 88-89
| 89-90
| 90-91
| 91-92
| 92-93
| 93-94
| 94-95
| 95-96
| 96-97
| 97-98
| 98-99
| 99-00
| 00-01
|
| CURRENT OUTLAYS
|
|
|
|
|
|
|
|
|
|
|
|
|
|
|
|
|
|
|
| Final Consumption Expenditure
|
|
| 14169
| 14891
| 15675
| 17177
| 18199
| 19244
| 20024
| 20428
| 21487
| 22226
| 23448
| 23108
| 23319
| 23522
|
|
|
| Defence Salaries
|
| 3054
| 3139
| 3033
| 3177
| 3339
| 3455
| 3417
| 3269
| 3372
| 3502
| 3578
| 3563
| 3473
| 3504
|
|
|
|
| Non-Salaries
| 3717
| 3958
| 4632
| 5113
| 5220
| 6039
| 6240
| 6359
| 6575
| 6483
| 6801
| 7001
| 7302
| 7441
|
|
|
| Non-Defence Salaries
|
| 3815
| 3783
| 3806
| 4233
| 4524
| 4764
| 5058
| 4972
| 5006
| 4834
| 4726
| 4322
| 4249
| 4280
|
|
|
|
| Non-Salaries
| 3583
| 4011
| 4204
| 4654
| 5116
| 4986
| 5309
| 5829
| 6534
| 7406
| 8343
| 8222
| 8295
| 8296
|
|
| Total Current Transfer Payments
|
|
| 61605
| 63942
| 68746
| 74665
| 81229
| 86465
| 93343
| 99325
| 106577
| 110450
| 111688
| 113741
| 116765
| 118890
|
|
|
| Interest
|
| 7904
| 7475
| 7352
| 6155
| 5706
| 5357
| 6576
| 8103
| 9219
| 9466
| 9051
| 9115
| 8226
| 7439
|
|
|
| Subsidies (a)
|
| 1878
| 1712
| 1964
| 2651
| 2347
| 2359
| 2558
| 2585
| 2736
| 2975
| 2754
| 2669
| 2598
| 2365
|
|
|
| Personal Benefit Payments
|
| 26815
| 25019
| 26374
| 30669
| 35276
| 38202
| 41120
| 42400
| 45541
| 48332
| 49030
| 49931
| 51502
| 52676
|
|
|
| Grants to Non-Profit Institutions
|
| 960
| 1102
| 1162
| 1144
| 1519
| 1836
| 1938
| 2374
| 3005
| 2781
| 2652
| 2606
| 2721
| 2818
|
|
|
| Grants to Non-Budget Sector (a)
|
| 2361
| 6175
| 7918
| 8781
| 9355
| 10395
| 11562
| 12790
| 13571
| 13614
| 14789
| 15176
| 15951
| 16707
|
|
|
| Grants to State Governments
|
| 17032
| 17593
| 18626
| 19563
| 20552
| 21425
| 22088
| 22948
| 24098
| 24747
| 24868
| 25685
| 27100
| 28068
|
|
|
| Grants Through State Governments
|
| 3720
| 3865
| 4178
| 4565
| 5179
| 5463
| 5999
| 6601
| 6857
| 7146
| 7123
| 7121
| 7165
| 7274
|
|
|
| Grants Direct to Local Governments
|
| 88
| 79
| 95
| 95
| 155
| 190
| 185
| 198
| 211
| 224
| 231
| 236
| 253
| 269
|
|
|
| Grants Overseas
|
| 843
| 916
| 1070
| 1036
| 1124
| 1195
| 1257
| 1296
| 1305
| 1152
| 1170
| 1181
| 1228
| 1254
|
|
|
| Other Transfers
|
| 4
| 5
| 7
| 5
| 17
| 41
| 60
| 31
| 33
| 12
| 21
| 21
| 21
| 22
|
| TOTAL CURRENT OUTLAYS
|
|
|
| 75773
| 78833
| 84421
| 91842
| 99429
| 105709
| 113367
| 119753
| 128064
| 132675
| 135137
| 136849
| 140084
| 142412
|
| CAPITAL OUTLAYS
|
|
|
|
|
|
|
|
|
|
|
|
|
|
|
|
|
|
|
| Capital Outlays on Goods (b)
|
|
| 627
| 535
| 686
| 970
| 1089
| 778
| 634
| 536
| 662
| 159
| 167
| 298
| 556
| 744
|
|
| Capital Outlays on Land
|
|
| -378
| -121
| 24
| -65
| 10
| -71
| -197
| -84
| -37
| 25
| -662
| 92
| 63
| -9
|
|
| Total Capital Transfer Payments
|
|
| 4110
| 3789
| 3979
| 4943
| 4445
| 5643
| 4005
| 3354
| 3273
| 3723
| 2781
| 2652
| 2604
| 2618
|
|
|
| Grants to Non-Budget Sector (a)
|
| 647
| 304
| 93
| 97
| 170
| 126
| 216
| 424
| 304
| 655
| 336
| 296
| 306
| 312
|
|
|
| Grants to State Governments
|
| 2781
| 2847
| 3353
| 4060
| 3390
| 4453
| 3243
| 2572
| 2618
| 2717
| 2156
| 2107
| 2065
| 2083
|
|
|
| Grants Through State Governments
|
| 291
| 228
| 195
| 285
| 307
| 430
| 269
| 162
| 158
| 154
| 131
| 137
| 129
| 125
|
|
|
| Grants Direct to Local Governments
|
| 16
| 35
| 13
| 13
| 22
| 320
| 63
| 7
| 29
| 16
| 11
| 7
| 4
| 2
|
|
|
| Grants to Other Sectors
|
| 375
| 374
| 326
| 488
| 556
| 314
| 214
| 190
| 164
| 181
| 148
| 105
| 101
| 95
|
|
| Total Net Advances
|
|
| -665
| -176
| -1207
| -1547
| -2151
| -2469
| -3438
| -1547
| -5272
| -7620
| -10276
| -5187
| -394
| -405
|
|
|
| To Non-Budget Sector
|
| -46
| 59
| -136
| -260
| 320
| 114
| -425
| -24
| -667
| -3267
| 18
| -874
| -26
| -26
|
|
|
| To Other Governments
|
| -46
| -124
| -485
| -1858
| -2753
| -2669
| -1314
| -2017
| -4128
| -1038
| -885
| -196
| -1251
| -1112
|
|
|
| To Other Sectors
|
| -573
| -110
| -585
| 571
| 282
| 86
| -1699
| 494
| -477
| -3315
| -9409
| -4118
| 883
| 733
|
| TOTAL CAPITAL OUTLAYS
|
|
|
| 3694
| 4028
| 3482
| 4301
| 3394
| 3881
| 1004
| 2259
| -1375
| -3714
| -7990
| -2145
| 2829
| 2948
|
|
| Contingency Reserve (c)
|
|
| -
| -
| -
| -
| -
| -
| -
| -
| -
| -100
| -219
| 895
| 1640
| 2455
|
| TOTAL OUTLAYS
|
|
|
| 79467
| 82860
| 87903
| 96143
| 102822
| 109590
| 114372
| 122012
| 126689
| 128861
| 126928
| 135599
| 144553
| 147815
|
| (a)
|
| Current grants to PTEs are classified as subsidies
and are not included in Grants to the Non-budget sector.
|
|
|
|
|
|
|
|
|
|
|
|
|
|
|
|
| (b)
|
| Capital Outlays on Goods covers the purchase of new
fixed assets, purchases less sales of secondhand fixed
assets and stocks.
|
|
|
|
|
|
|
|
|
|
|
|
|
|
|
|
| (c)
|
| An allowance for parameter revisions which could not
be included in detailed estimates.
|
|
|
|
|
|
|
|
|
|
|
|
|
|
|
|
Table VII
| Table VII - Commonwealth Budget Sector Outlays by Economic
Type as a Proportion of Total Outlays (%)
|
|
|
|
|
|
|
|
|
|
|
|
|
|
|
|
|
|
|
|
|
|
|
|
|
|
|
|
|
|
|
|
|
|
|
|
|
|
|
|
|
| 1987-88
| 88-89
| 89-90
| 90-91
| 91-92
| 92-93
| 93-94
| 94-95
| 95-96
| 96-97
| 97-98
| 98-99
| 99-00
| 00-01
|
| CURRENT OUTLAYS
|
|
|
|
|
|
|
|
|
|
|
|
|
|
|
|
|
|
|
| Final Consumption Expenditure
|
|
| 17.8
| 18.0
| 17.8
| 17.9
| 17.7
| 17.6
| 17.5
| 16.7
| 17.0
| 17.2
| 18.5
| 17.0
| 16.1
| 15.9
|
|
|
| Defence Salaries
|
| 3.8
| 3.8
| 3.4
| 3.3
| 3.2
| 3.2
| 3.0
| 2.7
| 2.7
| 2.7
| 2.8
| 2.6
| 2.4
| 2.4
|
|
|
|
| Non-Salaries
| 4.7
| 4.8
| 5.3
| 5.3
| 5.1
| 5.5
| 5.5
| 5.2
| 5.2
| 5.0
| 5.4
| 5.2
| 5.1
| 5.0
|
|
|
| Non-Defence Salaries
|
| 4.8
| 4.6
| 4.3
| 4.4
| 4.4
| 4.3
| 4.4
| 4.1
| 4.0
| 3.8
| 3.7
| 3.2
| 2.9
| 2.9
|
|
|
|
| Non-Salaries
| 4.5
| 4.8
| 4.8
| 4.8
| 5.0
| 4.5
| 4.6
| 4.8
| 5.2
| 5.7
| 6.6
| 6.1
| 5.7
| 5.6
|
|
| Total Current Transfer Payments
|
|
| 77.5
| 77.2
| 78.2
| 77.7
| 79.0
| 78.9
| 81.6
| 81.4
| 84.1
| 85.7
| 88.0
| 83.9
| 80.8
| 80.4
|
|
|
| Interest
|
| 9.9
| 9.0
| 8.4
| 6.4
| 5.5
| 4.9
| 5.7
| 6.6
| 7.3
| 7.3
| 7.1
| 6.7
| 5.7
| 5.0
|
|
|
| Subsidies
|
| 2.4
| 2.1
| 2.2
| 2.8
| 2.3
| 2.2
| 2.2
| 2.1
| 2.2
| 2.3
| 2.2
| 2.0
| 1.8
| 1.6
|
|
|
| Personal Benefit Payments
|
| 33.7
| 30.2
| 30.0
| 31.9
| 34.3
| 34.9
| 36.0
| 34.8
| 35.9
| 37.5
| 38.6
| 36.8
| 35.6
| 35.6
|
|
|
| Grants to Non-Profit Institutions
|
| 1.2
| 1.3
| 1.3
| 1.2
| 1.5
| 1.7
| 1.7
| 1.9
| 2.4
| 2.2
| 2.1
| 1.9
| 1.9
| 1.9
|
|
|
| Grants to Non-Budget Sector
|
| 3.0
| 7.5
| 9.0
| 9.1
| 9.1
| 9.5
| 10.1
| 10.5
| 10.7
| 10.6
| 11.7
| 11.2
| 11.0
| 11.3
|
|
|
| Grants to State Governments
|
| 21.4
| 21.2
| 21.2
| 20.3
| 20.0
| 19.6
| 19.3
| 18.8
| 19.0
| 19.2
| 19.6
| 18.9
| 18.7
| 19.0
|
|
|
| Grants Through State Governments
|
| 4.7
| 4.7
| 4.8
| 4.7
| 5.0
| 5.0
| 5.2
| 5.4
| 5.4
| 5.5
| 5.6
| 5.3
| 5.0
| 4.9
|
|
|
| Grants Direct to Local Governments
|
| 0.1
| 0.1
| 0.1
| 0.1
| 0.2
| 0.2
| 0.2
| 0.2
| 0.2
| 0.2
| 0.2
| 0.2
| 0.2
| 0.2
|
|
|
| Grants Overseas
|
| 1.1
| 1.1
| 1.2
| 1.1
| 1.1
| 1.1
| 1.1
| 1.1
| 1.0
| 0.9
| 0.9
| 0.9
| 0.8
| 0.8
|
|
|
| Other Transfers
|
| ..
| ..
| ..
| ..
| ..
| ..
| 0.1
| ..
| ..
| ..
| ..
| ..
| ..
| ..
|
| TOTAL CURRENT OUTLAYS
|
|
|
| 95.4
| 95.1
| 96.0
| 95.5
| 96.7
| 96.5
| 99.1
| 98.1
| 101.1
| 103.0
| 106.5
| 100.9
| 96.9
| 96.3
|
| CAPITAL OUTLAYS
|
|
|
|
|
|
|
|
|
|
|
|
|
|
|
|
|
|
|
| Capital Outlays on Goods
|
|
| 0.8
| 0.6
| 0.8
| 1.0
| 1.1
| 0.7
| 0.6
| 0.4
| 0.5
| 0.1
| 0.1
| 0.2
| 0.4
| 0.5
|
|
| Capital Outlays on Land
|
|
| -0.5
| -0.1
| ..
| -0.1
| ..
| -0.1
| -0.2
| -0.1
| ..
| ..
| -0.5
| 0.1
| ..
| ..
|
|
| Total Capital Transfer Payments
|
|
| 5.2
| 4.6
| 4.5
| 5.1
| 4.3
| 5.1
| 3.5
| 2.7
| 2.6
| 2.9
| 2.2
| 2.0
| 1.8
| 1.8
|
|
|
| Grants to Non-Budget Sector
|
| 0.8
| 0.4
| 0.1
| 0.1
| 0.2
| 0.1
| 0.2
| 0.3
| 0.2
| 0.5
| 0.3
| 0.2
| 0.2
| 0.2
|
|
|
| Grants to State Governments
|
| 3.5
| 3.4
| 3.8
| 4.2
| 3.3
| 4.1
| 2.8
| 2.1
| 2.1
| 2.1
| 1.7
| 1.6
| 1.4
| 1.4
|
|
|
| Grants Through State Governments
|
| 0.4
| 0.3
| 0.2
| 0.3
| 0.3
| 0.4
| 0.2
| 0.1
| 0.1
| 0.1
| 0.1
| 0.1
| 0.1
| 0.1
|
|
|
| Grants Direct to Local Governments
|
| ..
| ..
| ..
| ..
| ..
| 0.3
| 0.1
| ..
| ..
| ..
| ..
| ..
| ..
| ..
|
|
|
| Grants to Other Sectors
|
| 0.5
| 0.5
| 0.4
| 0.5
| 0.5
| 0.3
| 0.2
| 0.2
| 0.1
| 0.1
| 0.1
| 0.1
| 0.1
| 0.1
|
|
| Total Net Advances
|
|
| -0.8
| -0.2
| -1.4
| -1.6
| -2.1
| -2.3
| -3.0
| -1.3
| -4.2
| -5.9
| -8.1
| -3.8
| -0.3
| -0.3
|
|
|
| To Non-Budget Sector
|
| -0.1
| 0.1
| -0.2
| -0.3
| 0.3
| 0.1
| -0.4
| ..
| -0.5
| -2.5
| ..
| -0.6
| ..
| ..
|
|
|
| To Other Governments
|
| -0.1
| -0.1
| -0.6
| -1.9
| -2.7
| -2.4
| -1.1
| -1.7
| -3.3
| -0.8
| -0.7
| -0.1
| -0.9
| -0.8
|
|
|
| To Other Sectors
|
| -0.7
| -0.1
| -0.7
| 0.6
| 0.3
| 0.1
| -1.5
| 0.4
| -0.4
| -2.6
| -7.4
| -3.0
| 0.6
| 0.5
|
| TOTAL CAPITAL OUTLAYS
|
|
|
| 4.6
| 4.9
| 4.0
| 4.5
| 3.3
| 3.5
| 0.9
| 1.9
| -1.1
| -2.9
| -6.3
| -1.6
| 2.0
| 2.0
|
|
| Contingency Reserve
|
|
| -
| -
| -
| -
| -
| -
| -
| -
| -
| -0.1
| -0.2
| 0.7
| 1.1
| 1.7
|
| TOTAL OUTLAYS
|
|
|
| 100.0
| 100.0
| 100.0
| 100.0
| 100.0
| 100.0
| 100.0
| 100.0
| 100.0
| 100.0
| 100.0
| 100.0
| 100.0
| 100.0
|
Table VIII
| Table VIII-Commonwealth Budget Sector Outlays by Economic
Type-Annual Percentage Change
|
|
|
|
|
|
|
|
|
|
|
|
|
|
|
|
|
|
| (1989-90 Prices) (a)
|
|
|
|
|
|
|
|
|
|
|
|
|
|
|
|
|
|
|
|
|
|
| 1987-88
| 88-89
| 89-90
| 90-91
| 91-92
| 92-93
| 93-94
| 94-95
| 95-96
| 96-97
| 97-98
| 98-99
| 99-00
| 00-01
|
| CURRENT OUTLAYS
|
|
|
|
|
|
|
|
|
|
|
|
|
|
|
|
|
|
|
| Final Consumption Expenditure
|
|
| -3.1
| -3.0
| -1.2
| 5.1
| 4.1
| 4.5
| 2.9
| 0.7
| 2.3
| 1.1
| 3.4
| -3.8
| -1.5
| -1.6
|
|
|
| Defence Salaries
|
| -3.0
| -5.1
| -9.3
| 0.4
| 3.2
| 2.2
| -2.2
| -5.6
| 0.3
| 1.5
| 0.1
| -2.8
| -4.9
| -1.6
|
|
|
|
| Non-Salaries
| -9.1
| -1.7
| 9.9
| 5.8
| 0.3
| 14.3
| 2.2
| 0.6
| 0.6
| -3.6
| 2.8
| 0.5
| 1.8
| -0.6
|
|
|
| Non-Defence Salaries
|
| -3.2
| -8.4
| -5.5
| 6.6
| 5.0
| 4.0
| 5.0
| -3.0
| -2.1
| -5.6
| -4.2
| -10.7
| -4.1
| -1.7
|
|
|
|
| Non-Salaries
| 4.0
| 3.3
| -1.6
| 6.1
| 8.0
| -3.7
| 5.3
| 8.4
| 9.0
| 10.8
| 10.4
| -3.8
| -1.6
| -2.4
|
|
| Total Current Transfer Payments
|
|
| 0.8
| -4.2
| 1.0
| 4.1
| 6.8
| 5.2
| 6.8
| 5.1
| 4.4
| 1.3
| -0.9
| -0.6
| 0.2
| -0.7
|
|
|
| Interest
|
| -6.7
| -12.7
| -7.7
| -19.7
| -9.0
| -7.2
| 21.4
| 21.7
| 10.7
| 0.4
| -6.3
| -1.7
| -11.9
| -11.8
|
|
|
| Subsidies
|
| 1.1
| -15.8
| 7.7
| 29.4
| -13.1
| -0.7
| 7.2
| -0.2
| 2.9
| 6.3
| -9.3
| -5.4
| -5.0
| -11.2
|
|
|
| Personal Benefit Payments
|
| 4.2
| -13.8
| -1.0
| 11.5
| 13.0
| 7.0
| 6.4
| 1.8
| 4.5
| 3.7
| -0.6
| -0.6
| 0.7
| -0.2
|
|
|
| Grants to Non-Profit Institutions
|
| -19.7
| 6.0
| -1.0
| -5.6
| 30.4
| 19.4
| 4.4
| 20.9
| 23.2
| -9.6
| -6.6
| -4.1
| 1.9
| 1.1
|
|
|
| Grants to Non-Budget Sector
|
| 6.5
| 141.5
| 20.4
| 6.3
| 4.6
| 9.8
| 10.0
| 9.2
| 3.2
| -1.9
| 6.4
| 0.2
| 2.6
| 2.2
|
|
|
| Grants to State Governments
|
| 0.1
| -4.6
| -0.6
| 0.7
| 3.2
| 3.0
| 2.0
| 2.6
| 2.1
| 0.4
| -1.6
| 0.8
| 3.0
| 1.0
|
|
|
| Grants Through State Governments
|
| 1.4
| -4.1
| 1.5
| 4.8
| 11.4
| 4.2
| 8.6
| 8.6
| 1.0
| 1.9
| -2.3
| -2.4
| -1.8
| -1.0
|
|
|
| Grants Direct to Local Governments
|
| -4.3
| -16.5
| 12.7
| -4.2
| 60.0
| 21.4
| -3.5
| 5.6
| 3.7
| 3.6
| 0.9
| -0.2
| 4.8
| 3.5
|
|
|
| Grants Overseas
|
| -2.6
| 0.4
| 9.7
| -7.1
| 6.5
| 5.1
| 4.0
| 1.8
| -2.0
| -13.7
| -0.5
| -1.5
| 1.4
| -0.4
|
|
|
| Other Transfers
|
| 27.0
| 14.9
| 30.3
| -25.4
| 219.0
| 143.6
| 43.4
| -49.4
| 5.4
| -64.6
| 67.9
| -0.8
| -0.7
| -0.7
|
| TOTAL CURRENT OUTLAYS
|
|
|
| 0.0
| -3.9
| 0.6
| 4.3
| 6.3
| 5.0
| 6.1
| 4.3
| 4.0
| 1.3
| -0.2
| -1.2
| -0.1
| -0.8
|
| CAPITAL OUTLAYS
|
|
|
|
|
|
|
|
|
|
|
|
|
|
|
|
|
|
|
| Capital Outlays on Goods
|
|
| 4.3
| -21.2
| 20.3
| 35.7
| 10.2
| -29.4
| -19.3
| -16.6
| 20.1
| -76.5
| 3.0
| 74.2
| 81.8
| 30.5
|
|
| Capital Outlays on Land
|
|
| na
| -70.4
| -118.6
| na
| -115.0
| na
| 173.5
| -57.7
| -57.1
| -164.8
| na
| -113.6
| -33.3
| -114.4
|
|
| Total Capital Transfer Payments
|
|
| -10.2
| -14.9
| -1.4
| 19.1
| -11.7
| 25.4
| -29.8
| -17.3
| -5.1
| 11.2
| -26.8
| -6.9
| -4.2
| -1.9
|
|
|
| Grants to Non-Budget Sector
|
| -8.5
| -56.6
| -71.3
| 0.0
| 72.9
| -27.1
| 69.8
| 93.9
| -30.2
| 110.6
| -49.8
| -14.0
| 0.8
| -0.5
|
|
|
| Grants to State Governments
|
| -14.5
| -5.5
| 10.6
| 16.1
| -18.0
| 29.8
| -28.0
| -21.7
| -1.0
| 1.5
| -22.3
| -4.6
| -4.4
| -1.6
|
|
|
| Grants Through State Governments
|
| 12.6
| -27.6
| -20.0
| 40.3
| 5.8
| 38.5
| -38.1
| -40.5
| -5.1
| -5.1
| -16.5
| 1.8
| -8.2
| -5.2
|
|
|
| Grants Direct to Local Governments
|
| 5.5
| 108.8
| -66.0
| -4.1
| 71.9
| na
| -80.5
| -89.2
| na
| -47.4
| -31.9
| -38.9
| -39.0
| -44.7
|
|
|
| Grants to Other Sectors
|
| 9.1
| -7.8
| -18.2
| 43.6
| 11.7
| -44.1
| -32.6
| -12.6
| -16.0
| 8.1
| -20.2
| -30.3
| -6.6
| -7.6
|
|
| Total Net Advances
|
|
| -217.4
| -75.6
| na
| 22.9
| 36.5
| 13.4
| 37.8
| -55.6
| 231.5
| 41.3
| 32.1
| -50.7
| -92.6
| 0.2
|
|
|
| To Non-Budget Sector
|
| -64.6
| -217.2
| na
| 82.3
| -221.1
| -64.8
| na
| -94.4
| na
| na
| -100.5
| na
| -97.1
| -2.8
|
|
|
| To Other Governments
|
| -107.9
| 149.9
| na
| na
| 45.5
| -4.2
| -51.3
| 51.5
| 99.0
| -75.4
| -16.5
| -78.4
| na
| -13.3
|
|
|
| To Other Sectors
|
| na
| -82.2
| na
| -193.5
| -51.4
| -69.8
| na
| -128.7
| -193.9
| na
| 178.1
| -57.3
| -120.9
| -19.0
|
| TOTAL CAPITAL OUTLAYS
|
|
|
| -34.7
| 0.7
| -18.8
| 18.4
| -22.5
| 13.0
| -74.4
| 122.1
| -159.2
| 164.1
| 110.8
| -73.8
| -228.7
| 1.7
|
|
| Contingency Reserve
|
|
| na
| na
| na
| na
| na
| na
| na
| na
| na
| na
| 114.6
| na
| 78.8
| 46.0
|
| TOTAL OUTLAYS
|
|
|
| -2.4
| -3.7
| -0.4
| 4.9
| 5.0
| 5.3
| 3.2
| 5.3
| 1.0
| -0.6
| -3.5
| 4.3
| 4.0
| -0.2
|
| (a) The Non-farm GDP (NFGDP) deflator is used as a
general measure of price change.
|
|
|
|
|
|
|
|
|
|
|
|
|
|
|
|
|
|
Table IX
| Table IX - Commonwealth Budget Portfolio Outlays by
Major Function, 1997-98 ($m)
|
|
|
|
|
|
|
|
|
|
|
|
|
|
|
|
|
|
|
|
| General
|
| Public
|
|
| Social
| Housing and
|
|
|
| Public
|
| Order
|
|
| Security
| Community
|
|
| PORTFOLIO
| Services
| Defence
| and Safety
| Education
| Health
| and Welfare
| Amenities
|
|
| Parliament
| 164.2
| -
| -
| -
| -
| -
| -
|
|
| Attorney-General's
| 35.9
| -
| 1024.6
| -
| -
| 57.6
| -
|
|
| Communications and the Arts
| 4.6
| -
| -
| 15.6
| -
| -
| -
|
|
| Defence
| 1020.7
| 10407.1
| -
| -
| -
| -
| -
|
|
| Veterans' Affairs
| -
| -
| -
| 9.9
| 1747.5
| 4572.1
| 24.9
|
|
| Employment, Education, Training and Youth Affairs
| 431.8
| -
| -
| 10851.6
| -
| 3.6
| -
|
|
| Environment, Sport and Territories
| 84.6
| -
| 4.4
| 7.4
| 5.0
| -
| 213.5
|
|
| Finance
| 800.8
| -2.4
| -
| -
| -
| -
| -4.8
|
|
| Administrative Services
| 24.8
| -
| 13.0
| -
| -
| -
| 5.3
|
|
| Foreign Affairs and Trade
| 1966.8
| -
| 51.5
| -
| -
| -
| -
|
|
| Health and Family Services
| 8.9
| -
| -
| -
| 18947.0
| 3256.3
| -
|
|
| Immigration and Multicultural Affairs
| 0.9
| -
| -
| 95.6
| -
| 71.2
| -
|
|
| Industrial Relations
| 82.3
| -
| -
| -
| -
| -
| -
|
|
| Industry, Science and Tourism
| 1066.1
| -
| 37.2
| -
| -
| 12.9
| 6.2
|
|
| Primary Industries and Energy
| -
| -
| 0.6
| -
| -
| 21.1
| 32.9
|
|
| Prime Minister and Cabinet
| 86.6
| -
| 7.8
| -
| -
| 1037.2
| -
|
|
| Social Security
| -
| -
| -
| -
| -
| 41282.5
| 947.1
|
|
| Transport and Regional Development
| ..
| -
| -
| -
| -
| 5.0
| -3.8
|
|
| Treasury
| 1251.1
| -
| -
| -
| -
| 618.8
| -73.9
|
|
| Contingency Reserve
| -
| -
| -
| -
| -
| -
| -
|
|
| TOTAL
| 7030.0
| 10404.8
| 1139.0
| 10980.1
| 20699.5
| 50938.3
| 1147.3
|
|
|
|
|
|
|
|
|
|
|
|
|
|
|
| Agriculture,
| Mining and
|
| Other
|
|
|
|
| Recreation
| Fuel and
| Forestry
| Mineral
| Transport and
| Economic
| Other
|
|
| PORTFOLIO
| and Culture
| Energy
| and Fishing
| Resources
| Communication
| Affairs
| Purposes
| TOTAL
|
| Parliament
| -
| -
| -
| -
| -
| -
| -
| 164.2
|
| Attorney-General's
| -
| -
| -
| -
| -
| -
| -
| 1118.1
|
| Communications and the Arts
| 1073.0
| -
| -
| -
| 120.8
| -
| -25.0
| 1189.1
|
| Defence
| 1.8
| -
| -
| -
| -
| -
| -
| 11429.7
|
| Veterans' Affairs
| 36.1
| -
| -
| -
| -
| 0.6
| -
| 6391.1
|
| Employment, Education, Training and Youth Affairs
| -
| -
| -
| -
| -
| 2212.0
| -
| 13498.9
|
| Environment, Sport and Territories
| 207.6
| 2.4
| 93.9
| -
| 3.3
| 131.6
| 1224.8
| 1978.6
|
| Finance
| -1.0
| -
| -
| -
| -
| -
| -9806.2
| -9013.5
|
| Administrative Services
| ..
| -
| -
| -
| -
| 9.2
| -
| 52.6
|
| Foreign Affairs and Trade
| -
| -
| -
| 294.3
| -
| -
| -
| 2312.6
|
| Health and Family Services
| -
| -
| -
| -
| -
| -
| -
| 22212.2
|
| Immigration and Multicultural Affairs
| 0.8
| -
| -
| -
| -
| 356.2
| -
| 524.7
|
| Industrial Relations
| -
| -
| -
| -
| -
| 186.5
| -
| 268.7
|
| Industry, Science and Tourism
| -
| -
| 624.4
| 1344.8
| -
| 107.1
| -
| 3198.6
|
| Primary Industries and Energy
| -
| 10.3
| 1231.5
| 87.5
| -
| -
| 185.5
| 1569.4
|
| Prime Minister and Cabinet
| -
| -
| -
| -
| -
| -
| -
| 1131.6
|
| Social Security
| -
| -
| -
| -
| -
| -
| -
| 42229.6
|
| Transport and Regional Development
| -
| -
| -
| -
| 1360.6
| 7.6
| -
| 1369.4
|
| Treasury
| -
| -
| -0.7
| -
| -
| 160.1
| 24569.5
| 26524.9
|
| Contingency Reserve
| -
| -
| -
| -
| -
| -
| -1222.2
| -1222.2
|
| TOTAL
| 1318.6
| 12.6
| 1949.1
| 1726.7
| 1484.8
| 3170.8
| 14926.4
| 126928.1
|
|
|
|
|
|
|
|
|
|
|
Table X
| Table X - Commonwealth Budget Portfolio Outlays by
Major Economic Type, 1997-98 ($m)
|
|
|
|
|
|
|
|
|
|
|
|
|
|
|
|
|
|
|
|
| Final
|
| Personal
| Capital Outlays
| Assistance
|
|
|
|
|
| Consumption
|
| Benefit
| on Goods
| to Other
| Other
| Contingency
|
|
| PORTFOLIO
| Expenditure
| Interest
| Payments
| and Land
| Governments
| Transfers
| Reserve nec
| TOTAL
|
| Parliament
| 157.2
| -
| -
| 7.0
| -
| -
| -
| 164.2
|
| Attorney-General's
| 753.6
| -
| -
| 31.5
| 236.9
| 96.1
| -
| 1118.1
|
| Communications and the Arts
| 169.1
| -
| 5.5
| 7.2
| 0.8
| 1006.5
| -
| 1189.1
|
| Defence
| 11403.7
| -
| 7.0
| -
| -
| 19.0
| -
| 11429.7
|
| Veterans' Affairs
| 1709.2
| -
| 4445.7
| 10.3
| 12.7
| 213.1
| -
| 6391.1
|
| Employment, Education, Training and Youth Affairs
| 1467.6
| -
| 2031.9
| 37.4
| 7514.1
| 2447.8
| -
| 13498.9
|
| Environment, Sport and Territories
| 521.6
| -
| -
| 48.5
| 1247.6
| 160.8
| -
| 1978.6
|
| Finance
| 1061.1
| 1.1
| 0.5
| -16.4
| 33.0
| -10092.8
| -
| -9013.5
|
| Administrative Services
| 374.6
| -
| -
| -324.4
| 2.1
| ..
| -
| 52.6
|
| Foreign Affairs and Trade
| 653.1
| ..
| 0.7
| 20.8
| -
| 1637.9
| -
| 2312.6
|
| Health and Family Services
| 999.7
| -
| 2414.3
| 27.8
| 6702.2
| 12068.2
| -
| 22212.2
|
| Immigration and Multicultural Affairs
| 464.6
| -
| ..
| 10.2
| ..
| 49.7
| -
| 524.7
|
| Industrial Relations
| 154.3
| -
| 1.2
| -1.3
| -
| 114.5
| -
| 268.7
|
| Industry, Science and Tourism
| 522.5
| -
| -
| 55.8
| 25.6
| 2594.8
| -
| 3198.6
|
| Primary Industries and Energy
| 380.1
| 14.7
| 21.6
| 52.2
| 338.9
| 761.8
| -
| 1569.4
|
| Prime Minister and Cabinet
| 95.2
| -
| -
| 2.2
| 1.5
| 1032.7
| -
| 1131.6
|
| Social Security
| 1465.6
| -
| 39611.2
| 50.1
| 1099.1
| 3.5
| -
| 42229.6
|
| Transport and Regional Development
| 105.6
| -
| 15.9
| 104.2
| 895.2
| 248.5
| -
| 1369.4
|
| Treasury
| 1290.0
| 9035.0
| 462.3
| 96.8
| 16410.5
| -769.7
| -
| 26524.9
|
| Contingency Reserve
| -300.0
| -
| 11.5
| -714.7
| -
| -
| -219.0
| -1222.2
|
| TOTAL
| 23448.5
| 9050.9
| 49029.5
| -494.9
| 34520.3
| 11592.8
| -219.0
| 126928.1
|
-
Table XI
-
|
- Estimate
|
- Budget
|
- Estimate
|
- Estimate
|
- Estimate
|
- Portfolio/Details
|
- 96-97
|
- 97-98
|
- 98-99
|
- 99-00
|
- 00-01
|
- Administrative Services
|
-
|
-
|
-
|
-
|
-
|
- Overseas property services
|
- 67.1
|
- 96.0
|
- 35.7
|
- 12.4
|
- 13.2
|
- Domestic property services
|
- 71.3
|
- 68.0
|
- 36.9
|
- 29.1
|
- 28.7
|
- Attorney-General's
|
-
|
-
|
-
|
-
|
-
|
- Department
|
- 1.8
|
- 2.5
|
- 1.5
|
- 0.0
|
- 16.3
|
- Communications & the Arts
|
-
|
-
|
-
|
-
|
-
|
- Old Parliament House
|
- 5.5
|
- 4.0
|
- 0.3
|
- 0.0
|
- 0.0
|
- National Gallery of Australia
|
- 1.8
|
- 0.0
|
- 0.0
|
- 0.0
|
- 0.0
|
- National Museum of Australia
|
- 0.7
|
- 5.5
|
- 0.0
|
- 0.0
|
- 0.0
|
- National Film and Sound Archive
|
- 0.3
|
- 0.0
|
- 0.0
|
- 0.0
|
- 0.0
|
- Defence
|
-
|
-
|
-
|
-
|
-
|
- Defence Facilities
|
- 425.0
|
- 436.1
|
- 463.6
|
- 479.9
|
- 491.8
|
- Environment, Sport, Territories & Local Government
|
-
|
-
|
-
|
-
|
-
|
- Antartic Division
|
- 1.0
|
- 0.7
|
- 0.4
|
- 0.0
|
- 0.0
|
- Australian National Parks and Wildlife Service
|
- 2.6
|
- 2.8
|
- 3.5
|
- 5.3
|
- 5.3
|
- Territories Program
|
- 21.7
|
- 12.2
|
- 2.9
|
- 2.1
|
- 2.1
|
- Bureau of Meteorology
|
- 3.1
|
- 3.2
|
- 3.2
|
- 3.2
|
- 3.2
|
- National Capital Authority
|
- 5.9
|
- 10.2
|
- 4.0
|
- 4.0
|
- 4.0
|
- Health & Family Services
|
-
|
-
|
-
|
-
|
-
|
- Department
|
- 4.6
|
- 0.0
|
- 0.0
|
- 0.0
|
- 0.0
|
- Industry, Science & Tourism
|
-
|
-
|
-
|
-
|
-
|
- Australian Nuclear Science and Technology Organisation
|
- 6.8
|
- 6.0
|
- 6.6
|
- 6.6
|
- 6.6
|
- Commonwealth Scientific and Industrial Research
|
- 35.5
|
- 26.7
|
- 28.0
|
- 31.1
|
- 32.7
|
- Organisation
|
-
|
-
|
-
|
-
|
-
|
- Parliament
|
- 2.6
|
- 2.6
|
- 2.7
|
- 2.7
|
- 2.8
|
- Primary Industries and Energy
|
-
|
-
|
-
|
-
|
-
|
- Department - Screw Worm Fly Facility
|
- 2.9
|
- 0.3
|
- 0.0
|
- 0.0
|
- 0.0
|
- Murray-Darling Basin Commission
|
- 16.8
|
- 7.5
|
- 0.9
|
- 3.1
|
- 3.1
|
- Australian Geological Survey Organisation
|
- 57.9
|
- 40.3
|
- 1.9
|
- 1.6
|
- 1.6
|
- Rehabilitation of Maralinga Atomic Test Site
|
- 22.9
|
- 27.1
|
- 17.2
|
- 14.4
|
- 0.0
|
- Prime Minister & Cabinet
|
-
|
-
|
-
|
-
|
-
|
- Aboriginal & Torres Strait Islander Commission
|
- 4.1
|
- 2.2
|
- 2.7
|
- 6.2
|
- 3.2
|
- Aboriginal Hostels Limited
|
- 2.2
|
- 2.2
|
- 2.2
|
- 2.2
|
- 2.2
|
-
|
-
|
-
|
-
|
-
|
-
|
- TOTAL
|
- 763.9
|
- 750.7
|
- 614.4
|
- 603.9
|
- 616.7
|
- (a) Capital Works cover buildings and engineering works
and associated facilities. They include instalment
purchase projects and expenditure on design work. Excluded
are: outright purchases of land and completed buildings,
repairs and maintenance, expenditure on staff housing,
computers, plant and equipment, fittings for specialised
functions and works funded by grants or specific purpose
payments to State/Territories.
Table XIIa
-
|
- Running Costs Appropriations ($m) (b)
|
- ASL (a)
|
-
|
- 1996-97
|
- 1997-98
|
- 1998-99
|
- 1999-00
|
- 2000-01
|
- 1996-97
|
- 1997-98
|
-
|
- Estimate
|
- Budget
|
- Estimate
|
- Estimate
|
- Estimate
|
- Estimate
|
- Budget
|
- Parliament
|
-
|
-
|
-
|
-
|
-
|
-
|
-
|
- Senate
|
- 22.5
|
- 25.5
|
- 24.3
|
- 24.4
|
- 24.6
|
- 244
|
- 250
|
- House of Representatives
|
- 22.8
|
- 23.9
|
- 24.1
|
- 24.1
|
- 24.3
|
- 235
|
- 232
|
- Parliamentary Reporting Staff
|
- 30.3
|
- 30.6
|
- 30.7
|
- 30.8
|
- 30.4
|
- 289
|
- 289
|
- Parliamentary Library
|
- 15.1
|
- 15.3
|
- 15.2
|
- 15.2
|
- 15.3
|
- 201
|
- 195
|
- Joint House Department
|
- 32.7
|
- 37.8
|
- 34.1
|
- 34.3
|
- 34.4
|
- 301
|
- 280
|
- Total
|
- 123.3
|
- 133.3
|
- 128.4
|
- 128.7
|
- 129.0
|
- 1270
|
- 1246
|
- Attorney-General's
|
-
|
-
|
-
|
-
|
-
|
-
|
-
|
- Attorney-General's Department
|
- 71.3
|
- 79.8
|
- 67.7
|
- 66.0
|
- 66.4
|
- 434
|
- 427
|
- Legal Practice
|
- 37.5
|
- 36.3
|
- 35.0
|
- 35.5
|
- 35.8
|
- 1281
|
- 1163
|
- Aust Federal Police
|
- 250.2
|
- 238.8
|
- 243.0
|
- 250.6
|
- 252.0
|
- 2730
|
- 2647
|
- AUSTRAC
|
- 8.3
|
- 7.8
|
- 7.4
|
- 7.4
|
- 7.5
|
- 43
|
- 41
|
- Human Rights & Equal Opp Comm
|
- 20.5
|
- 17.9
|
- 13.3
|
- 13.2
|
- 13.3
|
- 200
|
- 170
|
- National Crime Authority
|
- 36.7
|
- 44.7
|
- 41.6
|
- 42.0
|
- 35.5
|
- 263
|
- 255
|
- Office of Parliamentary Counsel
|
- 6.2
|
- 7.3
|
- 6.7
|
- 6.7
|
- 6.8
|
- 47
|
- 47
|
- Office of Dir of Public Prosecutions
|
- 56.3
|
- 54.1
|
- 51.8
|
- 52.0
|
- 52.7
|
- 410
|
- 400
|
- Family Court of Australia
|
- 99.7
|
- 107.1
|
- 99.1
|
- 100.0
|
- 101.0
|
- 780
|
- 760
|
- Federal Court of Australia
|
- 53.4
|
- 53.7
|
- 52.2
|
- 51.7
|
- 52.0
|
- 363
|
- 336
|
- Administrative Appeals Tribunal
|
- 25.6
|
- 27.2
|
- 25.2
|
- 25.2
|
- 25.3
|
- 159
|
- 158
|
- Aust Bureau of Criminal Intelligence
|
- 5.3
|
- 6.3
|
- 5.2
|
- 5.2
|
- 5.2
|
- 24
|
- 22
|
- National Native Title Tribunal
|
- 16.1
|
- 23.8
|
- 21.9
|
- 22.3
|
- 22.5
|
- 150
|
- 160
|
- Office of Film and Literature Classif
|
- 5.1
|
- 4.6
|
- 2.7
|
- 2.7
|
- 2.7
|
- 38
|
- 38
|
- Total
|
- 692.1
|
- 709.4
|
- 672.8
|
- 680.5
|
- 678.7
|
- 6922
|
- 6624
|
- Communications and the Arts
|
-
|
-
|
-
|
-
|
-
|
-
|
-
|
- Dept of Communications and the Arts
|
- 110.0
|
- 110.1
|
- 104.5
|
- 105.0
|
- 105.8
|
- 1085
|
- 1086
|
- Defence
|
-
|
-
|
-
|
-
|
-
|
-
|
-
|
- Department of Defence - total (c)
|
- 5516.2
|
- 5648.3
|
- 5613.5
|
- 5578.1
|
- 5696.5
|
- 80380
|
- 79067
|
- Veterans' Affairs
|
-
|
-
|
-
|
-
|
-
|
-
|
-
|
- Department of Veterans' Affairs
|
- 239.9
|
- 221.9
|
- 209.8
|
- 204.6
|
- 205.2
|
- 3055
|
- 2520
|
- Employment, Education, Training
|
-
|
-
|
-
|
-
|
-
|
-
|
-
|
- and Youth Affairs
|
-
|
-
|
-
|
-
|
-
|
-
|
-
|
- Department of Employ, Education
|
-
|
-
|
-
|
-
|
-
|
-
|
-
|
- Training and Youth Affairs
|
- 950.1
|
- 753.2
|
- 356.5
|
- 322.0
|
- 327.7
|
- 11493
|
- 7333
|
- Nat Board of Employ, Educ & Training
|
- 5.0
|
- 3.9
|
- 3.5
|
- 3.6
|
- 3.7
|
- 30
|
- 30
|
- Total
|
- 955.1
|
- 757.2
|
- 360.0
|
- 325.6
|
- 331.4
|
- 11523
|
- 7363
|
- Environment, Sport and Territories
|
-
|
-
|
-
|
-
|
-
|
-
|
-
|
- Dept of Environ, Sport & Territories
|
- 76.4
|
- 69.9
|
- 62.6
|
- 53.6
|
- 53.0
|
- 797
|
- 740
|
- C'wealth Bureau of Meteorology
|
- 142.6
|
- 151.7
|
- 150.3
|
- 146.5
|
- 142.9
|
- 1414
|
- 1365
|
- Antarctic Division
|
- 42.1
|
- 43.4
|
- 44.6
|
- 45.0
|
- 45.4
|
- 298
|
- 305
|
- Territories
|
- 3.0
|
- 4.4
|
- 0.9
|
- 1.0
|
- 1.0
|
- 21
|
- 11
|
- National Capital Planning Authority
|
- 7.9
|
- 7.1
|
- 6.2
|
- 6.2
|
- 6.3
|
- 65
|
- 64
|
- Total
|
- 272.0
|
- 276.5
|
- 264.6
|
- 252.3
|
- 248.5
|
- 2595
|
- 2485
|
- Finance
|
-
|
-
|
-
|
-
|
-
|
-
|
-
|
- Department of Finance
|
- 73.6
|
- 73.1
|
- 67.5
|
- 67.7
|
- 68.5
|
- 669
|
- 540
|
- Australian National Audit Office
|
- 48.8
|
- 51.9
|
- 48.9
|
- 49.6
|
- 50.4
|
- 377
|
- 343
|
- Commonwealth Superannuation Admin
|
- 25.2
|
- 25.0
|
- 24.7
|
- 24.8
|
- 24.7
|
- 376
|
- 353
|
- Office of Govt Information Technology
|
- 12.0
|
- 15.2
|
- 16.7
|
- 12.4
|
- 7.8
|
- 33
|
- 62
|
- Office of Asset Sales
|
- 6.8
|
- 4.9
|
- 0.0
|
- 0.0
|
- 0.0
|
- 41
|
- 33
|
- Total
|
- 166.4
|
- 170.1
|
- 157.7
|
- 154.6
|
- 151.5
|
- 1496
|
- 1331
|
- Administrative Services
|
-
|
-
|
-
|
-
|
-
|
-
|
-
|
- Dept of Administrative Services
|
- 174.6
|
- 174.7
|
- 156.2
|
- 150.3
|
- 151.2
|
- 1320
|
- 1115
|
- Australian Electoral Commission
|
- 63.3
|
- 72.0
|
- 65.8
|
- 66.1
|
- 66.6
|
- 734
|
- 734
|
- Total
|
- 237.9
|
- 246.7
|
- 222.1
|
- 216.5
|
- 217.8
|
- 2054
|
- 1849
|
- Foreign Affairs and Trade
|
-
|
-
|
-
|
-
|
-
|
-
|
-
|
- Dept of Foreign Affairs and Trade
|
- 461.6
|
- 540.7
|
- 440.4
|
- 444.1
|
- 448.3
|
- 3719
|
- 3618
|
- Aust-Japan Foundation
|
- 0.7
|
- 1.0
|
- 0.7
|
- 0.7
|
- 0.8
|
- 3
|
- 3
|
- Aust Agency for International Develope
|
- 54.5
|
- 58.1
|
- 55.0
|
- 55.2
|
- 55.6
|
- 542
|
- 535
|
- Total
|
- 516.8
|
- 599.8
|
- 496.1
|
- 500.1
|
- 504.7
|
- 4264
|
- 4156
|
- Health and Family Services
|
-
|
-
|
-
|
-
|
-
|
-
|
-
|
- Dept of Health and Family Services
|
- 290.8
|
- 303.6
|
- 284.1
|
- 262.0
|
- 268.4
|
- 3399
|
- 3161
|
- Professional Services Review Scheme
|
- 1.1
|
- 1.9
|
- 1.9
|
- 1.4
|
- 1.4
|
- 5
|
- 10
|
- Total
|
- 291.9
|
- 305.4
|
- 285.9
|
- 263.4
|
- 269.9
|
- 3404
|
- 3171
|
- Immigration & Multicultural Affairs
|
-
|
-
|
-
|
-
|
-
|
-
|
-
|
- Dept of Immig & Multicultural Affairs
|
- 330.7
|
- 351.3
|
- 331.3
|
- 331.1
|
- 344.6
|
- 3271
|
- 3313
|
- Immigration Review Tribunal
|
- 7.5
|
- 7.2
|
- 10.6
|
- 9.6
|
- 8.9
|
- 69
|
- 65
|
- Refugee Review Tribunal
|
- 14.1
|
- 15.7
|
- 15.2
|
- 14.0
|
- 12.0
|
- 166
|
- 173
|
- Total
|
- 352.4
|
- 374.2
|
- 357.0
|
- 354.7
|
- 365.6
|
- 3506
|
- 3551
|
- Industrial Relations
|
-
|
-
|
-
|
-
|
-
|
-
|
-
|
- Department of Industrial Relations
|
- 62.4
|
- 67.3
|
- 64.8
|
- 64.9
|
- 65.3
|
- 526
|
- 610
|
- Affirmative Action Agency
|
- 2.2
|
- 2.2
|
- 2.0
|
- 2.0
|
- 2.0
|
- 20
|
- 21
|
- Australian Industrial Registry
|
- 40.3
|
- 40.2
|
- 40.5
|
- 40.9
|
- 41.2
|
- 298
|
- 302
|
- Total
|
- 104.9
|
- 109.8
|
- 107.2
|
- 107.8
|
- 108.5
|
- 844
|
- 933
|
- Industry, Science and Tourism
|
-
|
-
|
-
|
-
|
-
|
-
|
-
|
- Dept of Industry, Science & Tourism
|
- 128.4
|
- 132.5
|
- 108.4
|
- 95.4
|
- 92.7
|
- 1022
|
- 1102
|
- Aust Customs Service
|
- 381.8
|
- 383.3
|
- 388.0
|
- 398.1
|
- 400.0
|
- 4075
|
- 4022
|
- Anti-Dumping Authority
|
- 1.5
|
- 1.7
|
- 1.7
|
- 1.7
|
- 1.7
|
- 17
|
- 17
|
- Total
|
- 511.7
|
- 517.4
|
- 498.1
|
- 495.2
|
- 494.4
|
- 5114
|
- 5141
|
- Primary Industries and Energy
|
-
|
-
|
-
|
-
|
-
|
-
|
-
|
- Dept of Primary Industries and Energy
|
- 119.6
|
- 101.4
|
- 97.5
|
- 91.8
|
- 90.0
|
- 1054
|
- 1053
|
- ABARE
|
- 22.1
|
- 22.6
|
- 22.5
|
- 22.6
|
- 22.9
|
- 233
|
- 228
|
- Aust Geological Survey Organisation
|
- 71.3
|
- 59.0
|
- 53.3
|
- 54.4
|
- 55.5
|
- 534
|
- 510
|
- Total
|
- 213.0
|
- 182.9
|
- 173.3
|
- 168.8
|
- 168.4
|
- 1821
|
- 1791
|
- Prime Minister and Cabinet
|
-
|
-
|
-
|
-
|
-
|
-
|
-
|
- Dept of Prime Minister and Cabinet
|
- 45.1
|
- 47.1
|
- 41.3
|
- 41.3
|
- 41.5
|
- 391
|
- 397
|
- Commonwealth Ombudsman
|
- 8.4
|
- 8.4
|
- 7.8
|
- 7.9
|
- 7.9
|
- 89
|
- 87
|
- Governor-Gen Office & Establishments
|
- 7.1
|
- 8.2
|
- 8.0
|
- 8.1
|
- 8.2
|
- 76
|
- 74
|
- Office of Inspector-Gen of Intel & Sec
|
- 0.6
|
- 0.6
|
- 0.6
|
- 0.6
|
- 0.6
|
- 6
|
- 6
|
- Office of National Assessments
|
- 6.7
|
- 6.1
|
- 6.1
|
- 5.9
|
- 5.9
|
- 65
|
- 65
|
- Public Service and Merit Protection Comm
|
- 24.8
|
- 21.6
|
- 18.1
|
- 18.1
|
- 18.2
|
- 177
|
- 160
|
- Total
|
- 92.7
|
- 92.1
|
- 82.0
|
- 81.8
|
- 82.3
|
- 804
|
- 789
|
- Social Security
|
-
|
-
|
-
|
-
|
-
|
-
|
-
|
- Department of Social Security
|
- 1443.0
|
- 84.0
|
- 79.7
|
- 83.1
|
- 83.8
|
- 23021
|
- 830
|
- Commonwealth Service Delivery Agency
|
- 0.0
|
- 1710.2
|
- 1526.6
|
- 1407.0
|
- 1403.5
|
- na
|
- 26722
|
- Total
|
- 1443.0
|
- 1794.2
|
- 1606.3
|
- 1490.1
|
- 1487.2
|
- 23021
|
- 27552
|
- Transport and Regional Development
|
-
|
-
|
-
|
-
|
-
|
-
|
-
|
- Dept of Transport & Regional Devel
|
- 93.1
|
- 79.0
|
- 76.7
|
- 76.0
|
- 76.9
|
- 816
|
- 709
|
- Dept. of theTreasury
|
-
|
-
|
-
|
-
|
-
|
-
|
-
|
- Department of the Treasury
|
- 51.3
|
- 50.5
|
- 46.5
|
- 44.2
|
- 44.1
|
- 520
|
- 509
|
- Australian Bureau of Statistics
|
- 325.4
|
- 243.2
|
- 237.2
|
- 239.2
|
- 268.1
|
- 3950
|
- 3200
|
- Australian Taxation Office
|
- 1233.4
|
- 1289.6
|
- 1196.2
|
- 1185.7
|
- 1220.2
|
- 17045
|
- 16150
|
- Aust Competition & Consumer Comm
|
- 31.4
|
- 34.6
|
- 34.2
|
- 34.1
|
- 34.2
|
- 306
|
- 335
|
- National Competition Council
|
- 1.9
|
- 2.7
|
- 2.9
|
- 2.9
|
- 2.9
|
- 14
|
- 19
|
- Insurance and Superannuation Comm
|
- 41.7
|
- 37.8
|
- 36.1
|
- 36.1
|
- 36.4
|
- 468
|
- 444
|
- Industry Commission
|
- 26.1
|
- 24.6
|
- 20.1
|
- 20.3
|
- 21.6
|
- 236
|
- 223
|
- Economic Planning Advisory Comm
|
- 2.6
|
- 0.2
|
- 0.0
|
- 0.0
|
- 0.0
|
- 15
|
- 1
|
- Total
|
- 1713.7
|
- 1683.2
|
- 1573.2
|
- 1562.4
|
- 1627.6
|
- 22554
|
- 20881
|
- Contingency Reserve
|
- -50.0
|
- -300.0
|
-
|
-
|
-
|
-
|
-
|
- Grand Total
|
- 13596.1
|
- 13711.5
|
- 12989.3
|
- 12746.1
|
- 12949.8
|
- 176527
|
- 172242
|
- Excluding Contingency Reserve
|
- 13646.1
|
- 14011.5
|
- 12989.3
|
- 12746.1
|
- 12949.8
|
-
|
-
|
- Excluding Defence Military Salaries
|
- 10437.1
|
- 10750.6
|
- 9767.2
|
- 9530.6
|
- 9706.6
|
-
|
-
|
-
|
-
|
-
|
-
|
-
|
-
|
-
|
-
|
- (a) Staffing Level statistics are provided by portfolios
as these estimates are not compiled by the Department
of Finance. Staffing statistics are not a control point
within the running costs arrangements and are indicative
only. Figures are also published in Portfolio Budget
Statements. In addition, Statement 4 contains a section
on downsizing of the Australian Public Service.
- (b) Data now aligns with data presented in Budget Paper
No 4 (1997-98).
- (c) Data for the Department of Defence aligns with
data in Budget Paper No4 (1997-98). As such it includes
military personnel costs and excludes property operating
expenses as appropriated under Sub Division 185-02
of the Bills. Defence operates under global budget
funding arrangements and is not subject to most running
cost operating arrangements.s.
Table XIIb
| Table XIIb - Commonwealth Budget Running Costs ($m)
|
|
|
|
|
|
|
|
|
|
|
|
|
|
|
|
|
|
|
|
|
|
|
|
|
|
|
|
|
|
|
|
| Net Salaries ($m) (a)
|
|
|
|
| Net Non-Salary Running Costs ($m) (a)
|
|
|
|
| Section 35 Receipts (b)
|
|
|
|
|
| 1996-97
| 1997-98
| 1998-99
| 1999-00
| 2000-01
| 1996-97
| 1997-98
| 1998-99
| 1999-00
| 2000-01
| 1997-98
| 1998-99
| 1999-00
| 2000-01
|
|
| Estimate
| Budget
| Estimate
| Estimate
| Estimate
| Estimate
| Budget
| Estimate
| Estimate
| Estimate
| Budget
| Estimate
| Estimate
| Estimate
|
|
|
|
| (includes Superannuation)
|
|
|
|
|
|
|
|
|
|
|
|
| Parliament
|
|
|
|
|
|
|
|
|
|
|
|
|
|
|
| Senate
| 13.4
| 15.1
| 14.3
| 14.4
| 14.5
| 9.0
| 10.2
| 9.9
| 9.8
| 9.9
| 0.2
| 0.2
| 0.2
| 0.2
|
| House of Representatives
| 12.6
| 13.1
| 13.2
| 13.2
| 13.4
| 10.2
| 10.8
| 10.8
| 10.7
| 10.8
| 0.1
| 0.1
| 0.1
| 0.1
|
| Parliamentary Reporting Staff
| 16.8
| 16.8
| 16.9
| 17.0
| 17.1
| 13.5
| 13.4
| 13.4
| 13.3
| 12.7
| 0.5
| 0.5
| 0.5
| 0.5
|
| Parliamentary Library
| 10.8
| 11.2
| 11.0
| 11.1
| 11.2
| 4.2
| 4.1
| 4.1
| 4.1
| 4.1
| 0.0
| 0.0
| 0.0
| 0.0
|
| Joint House Department
| 14.9
| 14.1
| 14.2
| 14.3
| 14.4
| 17.8
| 21.0
| 17.2
| 17.2
| 17.3
| 2.7
| 2.7
| 2.7
| 2.7
|
| Total
| 68.5
| 70.3
| 69.5
| 70.0
| 70.6
| 54.7
| 59.4
| 55.3
| 55.2
| 54.8
| 3.6
| 3.6
| 3.6
| 3.6
|
| Attorney-General's
|
|
|
|
|
|
|
|
|
|
|
|
|
|
|
| Attorney-General's Department
| 26.4
| 25.7
| 26.2
| 27.5
| 28.2
| 44.9
| 53.3
| 40.7
| 37.8
| 37.5
| 0.8
| 0.8
| 0.8
| 0.8
|
| Legal Practice
| 15.8
| 15.7
| 15.6
| 15.9
| 16.1
| 21.7
| 19.4
| 18.2
| 18.4
| 18.6
| 1.1
| 1.1
| 1.1
| 1.1
|
| Aust Federal Police
| 189.6
| 121.1
| 126.3
| 135.2
| 136.2
| 60.5
| 50.5
| 49.4
| 48.2
| 48.5
| 67.2
| 67.2
| 67.2
| 67.2
|
| AUSTRAC
| 1.9
| 2.0
| 2.0
| 2.0
| 2.0
| 6.4
| 5.9
| 5.4
| 5.4
| 5.5
| 0.0
| 0.0
| 0.0
| 0.0
|
| Human Rights & Equal Opp Comm
| 9.8
| 9.4
| 5.1
| 5.1
| 5.2
| 10.7
| 7.5
| 5.8
| 5.7
| 5.7
| 1.0
| 2.4
| 2.4
| 2.4
|
| National Crime Authority
| 15.9
| 15.7
| 15.8
| 16.0
| 16.1
| 20.8
| 28.6
| 25.3
| 25.5
| 18.9
| 0.4
| 0.5
| 0.5
| 0.5
|
| Office of Parliamentary Counsel
| 3.9
| 4.7
| 4.0
| 4.1
| 4.1
| 2.3
| 1.9
| 1.9
| 2.0
| 2.0
| 0.7
| 0.7
| 0.7
| 0.7
|
| Office of Dir of Public Prosecutions
| 28.2
| 27.1
| 27.0
| 27.1
| 27.4
| 28.1
| 26.5
| 24.4
| 24.4
| 24.9
| 0.4
| 0.4
| 0.4
| 0.4
|
| Family Court of Australia
| 54.3
| 55.1
| 54.2
| 54.7
| 55.3
| 45.4
| 51.5
| 44.3
| 44.7
| 45.1
| 0.6
| 0.6
| 0.6
| 0.6
|
| Federal Court of Australia
| 27.5
| 24.0
| 23.7
| 23.2
| 23.2
| 25.9
| 28.8
| 27.5
| 27.5
| 27.8
| 1.0
| 1.0
| 1.0
| 1.0
|
| Administrative Appeals Tribunal
| 11.4
| 13.9
| 12.5
| 12.6
| 12.7
| 14.1
| 12.8
| 12.1
| 12.1
| 12.1
| 0.5
| 0.5
| 0.5
| 0.5
|
| Aust Bureau of Criminal Intelligence
| 1.2
| 1.2
| 1.2
| 1.2
| 1.2
| 4.1
| 3.9
| 2.7
| 2.8
| 2.8
| 1.3
| 1.3
| 1.3
| 1.3
|
| National Native Title Tribunal
| 7.8
| 6.7
| 6.8
| 6.8
| 6.9
| 8.3
| 17.0
| 15.1
| 15.4
| 15.5
| 0.1
| 0.1
| 0.1
| 0.1
|
| Office of Film and Literature Classif
| 5.1
| 2.2
| 0.0
| 0.0
| 0.0
| 0.0
| 0.0
| 0.0
| 0.0
| 0.0
| 2.4
| 2.7
| 2.7
| 2.7
|
| Total
| 398.7
| 324.4
| 320.5
| 331.5
| 334.7
| 293.3
| 307.5
| 273.0
| 269.7
| 264.7
| 77.4
| 79.3
| 79.3
| 79.3
|
| Communications and the Arts
|
|
|
|
|
|
|
|
|
|
|
|
|
|
|
| Dept of Communications and the Arts
| 53.4
| 50.9
| 51.3
| 51.8
| 52.3
| 56.6
| 53.9
| 47.9
| 47.9
| 48.2
| 5.2
| 5.2
| 5.2
| 5.2
|
| Defence
|
|
|
|
|
|
|
|
|
|
|
|
|
|
|
| Department of Defence - total (c)
| 4135.4
| 4213.3
| 4184.8
| 4105.0
| 4147.7
| 1380.8
| 1433.9
| 1427.6
| 1472.1
| 1547.8
| 1.0
| 1.0
| 1.0
| 1.0
|
| Military salaries
| 3209.1
| 3260.8
| 3222.1
| 3215.5
| 3243.2
|
|
|
|
|
|
|
|
|
|
| Civilian Salaries
| 926.4
| 952.5
| 962.7
| 889.5
| 904.5
|
|
|
|
|
|
|
|
|
|
| Veterans' Affairs
|
|
|
|
|
|
|
|
|
|
|
|
|
|
|
| Department of Veterans' Affairs
| 147.7
| 128.7
| 131.7
| 129.4
| 129.9
| 92.2
| 92.0
| 76.9
| 73.9
| 74.1
| 1.2
| 1.2
| 1.2
| 1.2
|
|
|
|
|
|
|
|
|
|
|
|
|
|
|
|
|
| Employment, Education, Training
|
|
|
|
|
|
|
|
|
|
|
|
|
|
|
| and Youth Affairs
|
|
|
|
|
|
|
|
|
|
|
|
|
|
|
| Department of Employ, Education
|
|
|
|
|
|
|
|
|
|
|
|
|
|
|
| Training and Youth Affairs
| 627.8
| 474.9
| 186.3
| 172.3
| 175.5
| 322.3
| 254.5
| 156.1
| 135.3
| 137.6
| 23.8
| 14.1
| 14.4
| 14.6
|
| Nat Board of Employ, Educ & Training
| 2.8
| 1.8
| 1.8
| 1.9
| 1.9
| 2.2
| 2.1
| 1.7
| 1.7
| 1.8
| 0.0
| 0.0
| 0.0
| 0.0
|
| Total
| 630.6
| 476.7
| 188.2
| 174.2
| 177.4
| 324.5
| 256.6
| 157.8
| 137.0
| 139.4
| 23.8
| 14.1
| 14.4
| 14.6
|
| Environment, Sport and Territories
|
|
|
|
|
|
|
|
|
|
|
|
|
|
|
| Dept of Environ, Sport & Territories
| 46.7
| 43.7
| 38.9
| 32.6
| 32.2
| 29.7
| 23.6
| 21.4
| 18.6
| 18.4
| 2.6
| 2.3
| 2.4
| 2.4
|
| C'wealth Bureau of Meteorology
| 81.0
| 86.1
| 85.9
| 85.8
| 86.4
| 61.5
| 50.9
| 51.9
| 48.1
| 47.4
| 14.7
| 12.5
| 12.7
| 9.1
|
| Antarctic Division
| 19.1
| 19.6
| 19.9
| 20.3
| 20.8
| 23.0
| 22.9
| 23.7
| 23.7
| 23.7
| 0.9
| 0.9
| 0.9
| 0.9
|
| Territories
| 1.5
| 0.8
| 0.6
| 0.6
| 0.7
| 1.5
| 3.5
| 0.3
| 0.3
| 0.3
| 0.0
| 0.0
| 0.0
| 0.0
|
| National Capital Planning Authority
| 2.4
| 3.1
| 3.2
| 3.3
| 3.3
| 5.6
| 2.6
| 1.7
| 1.6
| 1.6
| 1.4
| 1.4
| 1.4
| 1.4
|
| Total
| 150.7
| 153.4
| 148.5
| 142.6
| 143.4
| 121.3
| 103.5
| 99.0
| 92.3
| 91.4
| 19.6
| 17.1
| 17.4
| 13.7
|
| Finance
|
|
|
|
|
|
|
|
|
|
|
|
|
|
|
| Department of Finance
| 42.5
| 42.9
| 46.0
| 46.3
| 46.7
| 31.2
| 25.8
| 16.7
| 16.7
| 17.1
| 4.4
| 4.7
| 4.7
| 4.7
|
| Australian National Audit Office
| 25.4
| 25.0
| 25.1
| 25.3
| 25.5
| 23.3
| 26.7
| 23.6
| 24.1
| 24.7
| 0.2
| 0.2
| 0.2
| 0.3
|
| Commonwealth Superannuation Admin
| 16.9
| 17.4
| 17.5
| 17.6
| 17.7
| 8.3
| 7.2
| 6.8
| 6.9
| 6.6
| 0.4
| 0.4
| 0.4
| 0.4
|
| Office of Govt Information Technology
| 2.9
| 2.3
| 3.2
| 2.4
| 2.1
| 9.1
| 12.7
| 13.4
| 9.9
| 5.5
| 0.2
| 0.2
| 0.2
| 0.2
|
| Office of Asset Sales
| 4.6
| 2.6
| 0.0
| 0.0
| 0.0
| 2.1
| 2.3
| 0.0
| 0.0
| 0.0
| 0.0
| 0.0
| 0.0
| 0.0
|
| Total
| 92.3
| 90.3
| 91.7
| 91.6
| 92.1
| 74.1
| 74.7
| 60.5
| 57.5
| 53.9
| 5.2
| 5.5
| 5.5
| 5.5
|
| Administrative Services
|
|
|
|
|
|
|
|
|
|
|
|
|
|
|
| Dept of Administrative Services
| 74.7
| 87.6
| 72.9
| 75.0
| 75.8
| 99.9
| 57.2
| 53.5
| 45.5
| 46.1
| 29.8
| 29.8
| 29.8
| 29.3
|
| Australian Electoral Commission
| 32.1
| 36.1
| 33.1
| 33.1
| 33.3
| 31.3
| 29.2
| 26.4
| 26.6
| 26.8
| 6.7
| 6.3
| 6.5
| 6.6
|
| Total
| 106.8
| 123.7
| 105.9
| 108.1
| 109.0
| 131.2
| 86.5
| 80.0
| 72.1
| 72.8
| 36.5
| 36.2
| 36.3
| 35.9
|
| Foreign Affairs and Trade
|
|
|
|
|
|
|
|
|
|
|
|
|
|
|
| Dept of Foreign Affairs and Trade
| 162.0
| 145.5
| 148.4
| 150.1
| 152.0
| 299.6
| 339.1
| 236.0
| 237.9
| 240.3
| 56.0
| 56.0
| 56.0
| 56.0
|
| Aust-Japan Foundation
| 0.3
| 0.2
| 0.2
| 0.2
| 0.2
| 0.4
| 0.8
| 0.5
| 0.6
| 0.6
| 0.0
| 0.0
| 0.0
| 0.0
|
| Aust Agency for International Develope
| 38.0
| 34.1
| 34.9
| 35.2
| 35.5
| 16.5
| 23.2
| 19.4
| 19.3
| 19.4
| 0.7
| 0.7
| 0.7
| 0.7
|
| Total
| 200.3
| 179.8
| 183.5
| 185.5
| 187.7
| 316.5
| 363.2
| 255.9
| 257.8
| 260.3
| 56.8
| 56.8
| 56.8
| 56.8
|
|
|
|
|
|
|
|
|
|
|
|
|
|
|
|
|
| Health and Family Services
|
|
|
|
|
|
|
|
|
|
|
|
|
|
|
| Dept of Health and Family Services
| 165.9
| 138.3
| 133.4
| 121.8
| 123.3
| 124.9
| 136.6
| 122.0
| 111.5
| 116.4
| 28.7
| 28.7
| 28.7
| 28.7
|
| Professional Services Review Scheme
| 0.4
| 0.6
| 0.6
| 0.5
| 0.5
| 0.7
| 1.3
| 1.3
| 0.9
| 1.0
| 0.0
| 0.0
| 0.0
| 0.0
|
| Total
| 166.2
| 138.8
| 133.9
| 122.2
| 123.8
| 125.7
| 137.9
| 123.3
| 112.5
| 117.3
| 28.7
| 28.7
| 28.7
| 28.7
|
| Immigration & Multicultural Affairs
|
|
|
|
|
|
|
|
|
|
|
|
|
|
|
| Dept of Immig & Multicultural Affairs
| 179.6
| 170.0
| 174.7
| 179.5
| 188.0
| 151.1
| 171.2
| 146.4
| 141.2
| 146.0
| 10.1
| 10.2
| 10.4
| 10.6
|
| Immigration Review Tribunal
| 4.7
| 3.8
| 7.4
| 6.6
| 6.1
| 2.9
| 3.4
| 3.1
| 3.0
| 2.8
| 0.0
| 0.0
| 0.0
| 0.0
|
| Refugee Review Tribunal
| 9.5
| 10.5
| 10.0
| 9.2
| 7.8
| 4.6
| 5.2
| 5.1
| 4.8
| 4.2
| 0.0
| 0.0
| 0.0
| 0.0
|
| Total
| 193.8
| 184.3
| 192.2
| 195.4
| 201.9
| 158.5
| 179.8
| 154.6
| 148.9
| 153.1
| 10.1
| 10.2
| 10.4
| 10.7
|
| Industrial Relations
|
|
|
|
|
|
|
|
|
|
|
|
|
|
|
| Department of Industrial Relations
| 34.9
| 41.5
| 41.3
| 41.7
| 42.0
| 27.5
| 21.3
| 19.4
| 19.4
| 19.4
| 4.6
| 4.1
| 3.8
| 3.8
|
| Affirmative Action Agency
| 1.1
| 1.2
| 1.0
| 1.0
| 1.0
| 1.1
| 1.0
| 0.9
| 0.9
| 0.9
| 0.0
| 0.0
| 0.0
| 0.0
|
| Australian Industrial Registry
| 18.7
| 19.5
| 19.6
| 19.7
| 19.9
| 21.7
| 20.6
| 20.8
| 21.1
| 21.2
| 0.1
| 0.1
| 0.1
| 0.1
|
| Total
| 54.6
| 62.2
| 61.9
| 62.4
| 63.0
| 50.3
| 42.9
| 41.1
| 41.4
| 41.5
| 4.7
| 4.2
| 4.0
| 4.0
|
| Industry, Science and Tourism
|
|
|
|
|
|
|
|
|
|
|
|
|
|
|
| Dept of Industry, Science & Tourism
| 68.7
| 66.0
| 61.2
| 57.7
| 56.7
| 59.7
| 66.0
| 46.4
| 36.8
| 35.1
| 0.6
| 0.9
| 0.9
| 0.9
|
| Aust Customs Service
| 237.2
| 233.0
| 238.9
| 246.1
| 253.0
| 144.7
| 129.6
| 128.0
| 130.3
| 125.1
| 20.7
| 21.1
| 21.6
| 22.0
|
| Anti-Dumping Authority
| 1.4
| 1.4
| 1.4
| 1.4
| 1.4
| 0.2
| 0.3
| 0.3
| 0.3
| 0.3
| 0.0
| 0.0
| 0.0
| 0.0
|
| Total
| 307.2
| 300.3
| 301.4
| 305.3
| 311.1
| 204.5
| 195.9
| 174.7
| 167.4
| 160.5
| 21.2
| 22.0
| 22.5
| 22.9
|
| Primary Industries and Energy
|
|
|
|
|
|
|
|
|
|
|
|
|
|
|
| Dept of Primary Industries and Energy
| 66.4
| 44.5
| 51.0
| 47.7
| 46.7
| 53.3
| 49.0
| 38.5
| 36.0
| 34.9
| 7.9
| 8.0
| 8.2
| 8.4
|
| ABARE
| 10.3
| 10.7
| 10.6
| 10.6
| 10.7
| 11.8
| 4.4
| 4.2
| 4.1
| 4.1
| 7.6
| 7.7
| 7.9
| 8.0
|
| Aust Geological Survey Organisation
| 30.3
| 26.4
| 27.1
| 27.9
| 28.5
| 41.0
| 19.6
| 12.9
| 12.9
| 13.1
| 13.0
| 13.3
| 13.6
| 13.9
|
| Total
| 106.9
| 81.5
| 88.7
| 86.3
| 86.0
| 106.1
| 73.0
| 55.6
| 52.9
| 52.1
| 28.4
| 29.0
| 29.7
| 30.3
|
| Prime Minister and Cabinet
|
|
|
|
|
|
|
|
|
|
|
|
|
|
|
| Dept of Prime Minister and Cabinet
| 29.2
| 25.5
| 24.0
| 24.1
| 24.3
| 16.0
| 21.3
| 15.1
| 14.9
| 14.9
| 0.3
| 2.2
| 2.2
| 2.2
|
| Commonwealth Ombudsman
| 5.7
| 5.1
| 5.1
| 5.2
| 5.2
| 2.7
| 3.1
| 2.5
| 2.5
| 2.5
| 0.2
| 0.2
| 0.2
| 0.2
|
| Governor-Gen Office & Establishments
| 3.8
| 3.7
| 3.6
| 3.7
| 3.8
| 3.4
| 4.2
| 4.0
| 4.0
| 4.0
| 0.2
| 0.4
| 0.4
| 0.4
|
| Office of Inspector-Gen of Intel & Sec
| 0.5
| 0.5
| 0.5
| 0.5
| 0.5
| 0.1
| 0.1
| 0.1
| 0.1
| 0.1
| 0.0
| 0.0
| 0.0
| 0.0
|
| Office of National Assessments
| 4.6
| 4.7
| 4.7
| 4.8
| 4.8
| 2.1
| 1.4
| 1.4
| 1.1
| 1.1
| 0.0
| 0.0
| 0.0
| 0.0
|
| Public Service and Merit Protection Comm
| 6.7
| 8.4
| 8.5
| 8.5
| 8.6
| 18.1
| 6.6
| 5.1
| 5.0
| 5.1
| 6.6
| 4.5
| 4.5
| 4.5
|
| Total
| 50.4
| 48.0
| 46.4
| 46.8
| 47.3
| 42.2
| 36.8
| 28.2
| 27.6
| 27.7
| 7.3
| 7.3
| 7.3
| 7.3
|
| Social Security
|
|
|
|
|
|
|
|
|
|
|
|
|
|
|
| Department of Social Security
| 923.9
| 38.7
| 32.3
| 27.1
| 20.5
| 519.2
| 44.5
| 46.7
| 55.2
| 62.5
| 0.8
| 0.8
| 0.8
| 0.8
|
| Commonwealth Service Delivery Agency
| 0.0
| 49.5
| 0.0
| 0.0
| 0.0
| 0.0
| 73.0
| 0.0
| 0.0
| 0.0
| 1587.7
| 1526.6
| 1407.0
| 1403.5
|
| Total
| 923.9
| 88.2
| 32.3
| 27.1
| 20.5
| 519.2
| 117.5
| 46.7
| 55.2
| 62.5
| 1588.5
| 1527.4
| 1407.8
| 1404.2
|
|
|
|
|
|
|
|
|
|
|
|
|
|
|
|
|
| Transport and Regional Development
|
|
|
|
|
|
|
|
|
|
|
|
|
|
|
| Dept of Transport & Regional Devel
| 58.6
| 45.1
| 43.0
| 43.1
| 43.9
| 34.6
| 32.7
| 32.5
| 31.7
| 31.7
| 1.2
| 1.2
| 1.2
| 1.2
|
| Treasury
|
|
|
|
|
|
|
|
|
|
|
|
|
|
|
| Department of the Treasury
| 34.2
| 32.5
| 33.3
| 32.0
| 32.1
| 17.1
| 17.1
| 12.7
| 11.6
| 11.4
| 0.9
| 0.5
| 0.5
| 0.5
|
| Australian Bureau of Statistics
| 176.3
| 149.4
| 142.9
| 143.9
| 145.1
| 149.1
| 67.8
| 67.7
| 68.2
| 95.3
| 26.0
| 26.5
| 27.1
| 27.7
|
| Australian Taxation Office
| 857.7
| 850.2
| 846.8
| 861.7
| 881.9
| 375.7
| 436.4
| 346.7
| 321.2
| 335.5
| 3.0
| 2.7
| 2.7
| 2.8
|
| Aust Competition & Consumer Comm
| 16.7
| 19.2
| 19.3
| 19.5
| 19.7
| 14.7
| 15.1
| 14.6
| 14.3
| 14.3
| 0.3
| 0.3
| 0.3
| 0.3
|
| National Competition Council
| 1.1
| 1.5
| 1.7
| 1.7
| 1.7
| 0.9
| 1.2
| 1.2
| 1.2
| 1.2
| 0.0
| 0.0
| 0.0
| 0.0
|
| Insurance and Superannuation Comm
| 26.1
| 25.2
| 25.5
| 25.7
| 25.9
| 15.5
| 11.5
| 9.8
| 9.6
| 9.7
| 1.1
| 0.8
| 0.8
| 0.8
|
| Industry Commission
| 16.9
| 15.8
| 14.3
| 14.3
| 14.5
| 9.1
| 8.6
| 5.6
| 5.8
| 7.0
| 0.2
| 0.2
| 0.2
| 0.2
|
| Economic Planning Advisory Comm
| 1.8
| 0.2
| 0.0
| 0.0
| 0.0
| 0.8
| 0.0
| 0.0
| 0.0
| 0.0
| 0.0
| 0.0
| 0.0
| 0.0
|
| Total
| 1130.9
| 1094.0
| 1083.9
| 1098.9
| 1120.9
| 582.8
| 557.7
| 458.4
| 431.9
| 474.4
| 31.5
| 31.0
| 31.6
| 32.3
|
|
|
|
|
|
|
|
|
|
|
|
|
|
|
|
|
| Grand Total
| 8977.0
| 7854.0
| 7459.3
| 7377.2
| 7463.0
| 4669.1
| 4205.3
| 3648.9
| 3605.1
| 3728.2
| 1952.1
| 1881.2
| 1763.9
| 1758.6
|
|
|
|
|
|
|
|
|
|
|
|
|
|
|
|
|
| Grand Total (excl. Defence military salaries)
| 5767.9
| 4593.2
| 4237.2
| 4161.7
| 4219.9
| 4669.1
| 4205.3
| 3648.9
| 3605.1
| 3728.2
| 1952.1
| 1881.2
| 1763.9
| 1758.6
|
| (a) Data aligns with equivalent data presented in
Budget Paper No 4 (1997-98).
|
|
|
|
|
|
|
|
|
|
|
|
|
|
|
| (b) Section 35 of the Audit Act 1901 provides that
items in the Appropriation Bills may be annotated to
allow certain receipts to be deemed to be appropriated.
For actual 1995-96 any
|
|
|
|
|
|
|
|
|
|
|
|
|
|
|
| expenditure ofamounts deemed to have been appropriated
is recorded against either net salaries or net non-salary
running costs.
|
|
|
|
|
|
|
|
|
|
|
|
|
|
|
| (c) Data for the Department of Defence aligns with
data in Budget Paper No 4 (1997-98). The non-salary
component excludes property operating expenses as appropriated
under
|
|
|
|
|
|
|
|
|
|
|
|
|
|
|
| Sub Division 185-02 of the Bills. Defence operates
under global budget funding arrangements and is not
subject to most running cost operating arrangements.
|
|
|
|
|
|
|
|
|
|
|
|
|
|
|
|
|
|
|
|
|
|
|
|
|
|
|
|
|
|
|